Photo: Sergio Ruiz, flickr
Introduction
The Transportation Authority is the Congestion Management Agency for San Francisco. As required by state law, we develop and adopt a Congestion Management Program to monitor activity on our transportation network and adopt plans for mitigating traffic congestion in the city. Our Congestion Management work also aids in the development of the San Francisco Transportation Plan and provides input to San Francisco’s priorities for Plan Bay Area every four years.
Every two years, we release a report to update San Francisco’s Congestion Management Program. This report analyzes the performance of our transportation network, including transit, cars, bicycles, and pedestrians. The performance measures are primarily based on INRIX roadway speed data and SFMTA vehicle telemetry data, augmented by other sources. The report also identifies ways to increase the productivity of existing transportation infrastructure and encourage more efficient use of transportation investments in order to promote safety, better manage congestion, improve air quality, and facilitate sustainable development.
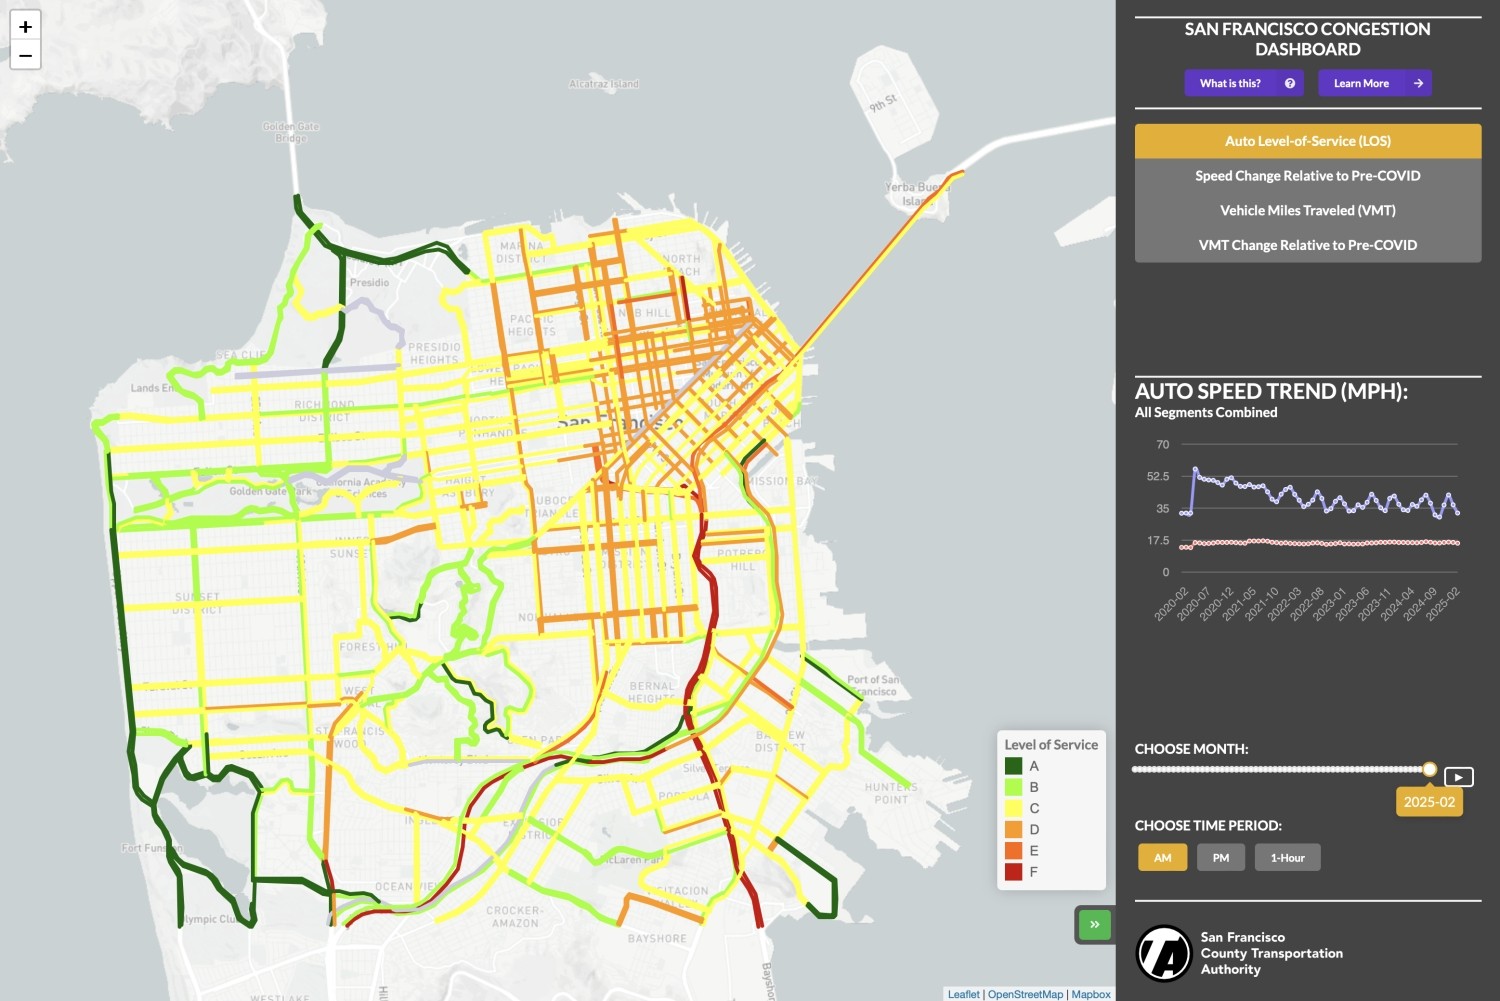
San Francisco Congestion Dashboard
Explore monthly changes in congestion and vehicle miles traveled (VMT) in San Francisco.
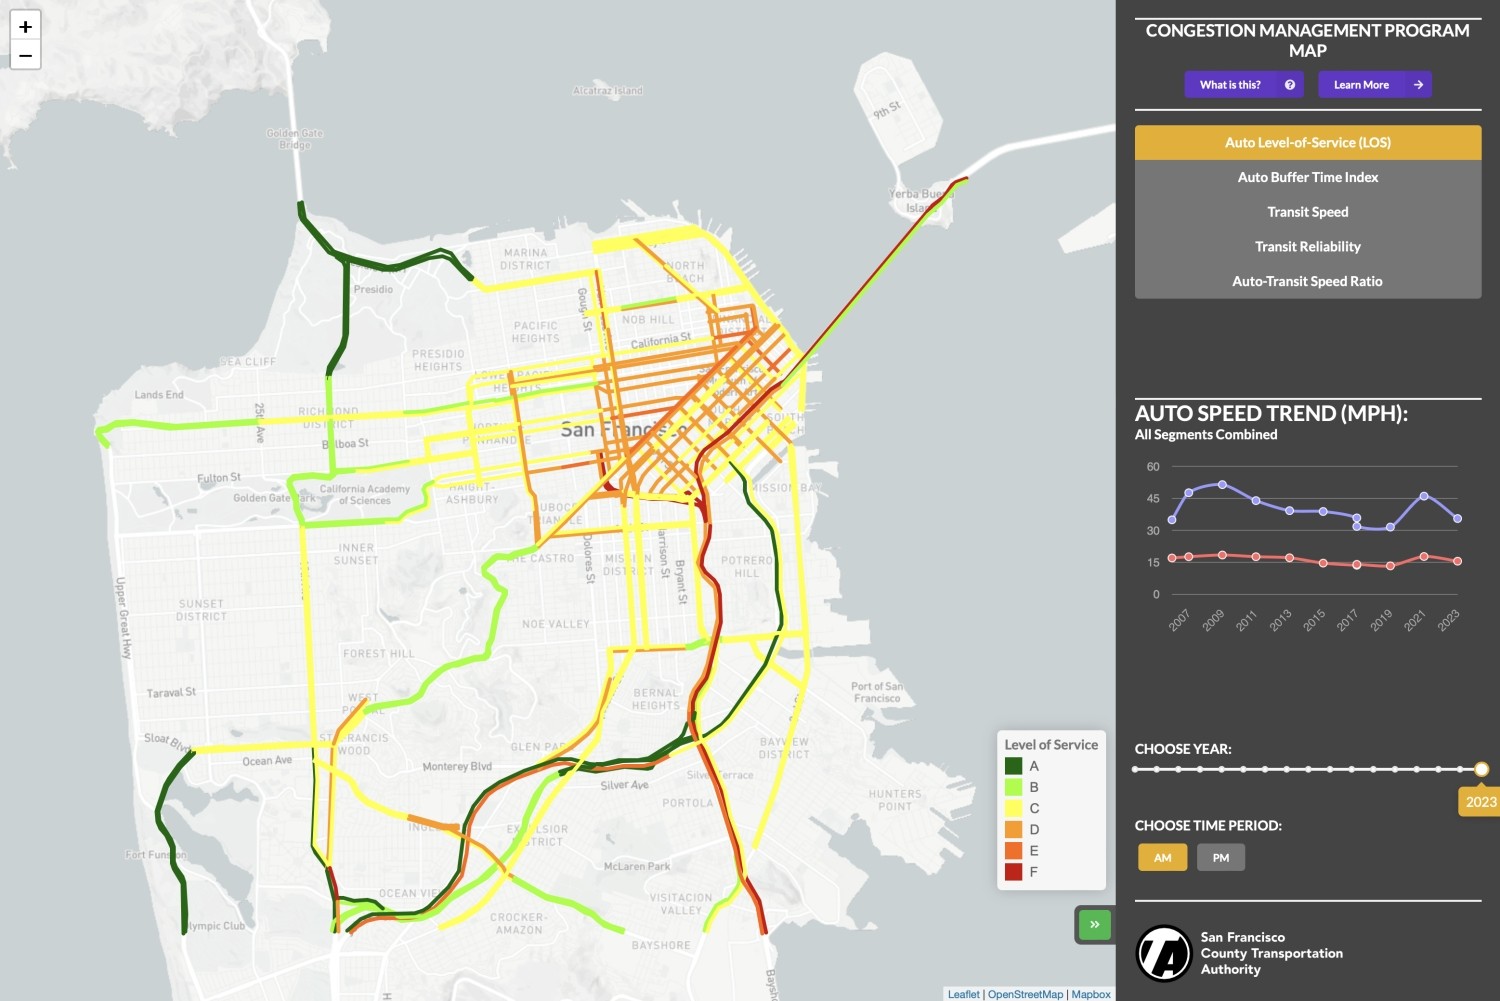
Congestion Management Program Map
Explore biennial changes in automobile congestion and transit speeds in San Francisco on the Congestion Management Program road network.
Watch this video to learn how to navigate the map.
2025 Congestion Management Program Report
Transportation system performance has begun to stabilize since the COVID-era changes. Traffic speeds decreased slightly between 2024 and 2025. Transit speeds and transit travel time reliability stayed constant between 2023 and 2025, and transit ridership is continuing to recover. Roadway travel time reliability became better on arterials, but reliability on freeways at peak hours worsened significantly, which may reflect overall increasing peak period congestion near pre-COVID levels, while also having more day-of-week variation in peak period congestion typical of the post-COVID era. Traffic counts on Tuesdays through Thursdays at mid-block locations have reached 92% of pre-COVID pandemic (2019) levels, perhaps indicating that arterial congestion is nearing pre-pandemic levels. Average monthly shared micromobility trips have more than doubled between 2023 and 2025.
Contact
Drew Cooper, Acting Co-Deputy Director for Data and Forecasting
Past Reports
2023 Congestion Management Program Report
Executive Summary (PDF)
Final Report (PDF)
Appendices (PDF)
SF-CHAMP model land use inputs (base year 2015) (CSV)
2021 Congestion Management Program Report
Full Report (PDF)
Executive Summary (PDF)
Technical Appendices (PDF)
2019 Congestion Management Program Report
Full Report (PDF)
Executive Summary (PDF)
Technical Appendices (PDF)
Data Files (ZIP)
2017 Congestion Management Program Report
Full Report (PDF)
Executive Summary (PDF)
Technical Appendices (PDF)
2015 Congestion Management Program Report
Full Report (PDF)
Technical Appendices (PDF)
2013 Congestion Management Program Report
Full Report (PDF)
Technical Appendices (PDF)
2011 Congestion Management Program Report
Full Report (PDF)
Technical Appendices (PDF)
2009 Congestion Management Program Report
Full Report (PDF)
Technical Appendices (PDF)
Congestion Management Program: Other Documents
Roadway Network Segmentation and Changes (PDF)
Deficiency Plans, 2025 (PDF)
Infill Opportunity Zone
2024 Infill Opportunity Zone
Board of Supervisors Resolution (PDF)
Memorandum (PDF)
Map (PDF)
Planning Department Determination of General Plan Consistency (PDF)
GIS File (GeoPackage)
2009 Infill Opportunity Zone
Board of Supervisors Resolution (PDF)
Eligible Area Analysis and Map (PDF)
GIS File (GeoPackage)
Related programs