Image

Every two years, the San Francisco County Transportation Authority (SFCTA) as the designated county Congestion Management Agency (CMA) for San Francisco prepares the San Francisco Congestion Management Program (CMP). This program is conducted biennially in accordance with state law to monitor congestion, inform policy and long-range planning efforts, and adopt strategies for mitigating traffic congestion that falls below certain thresholds as warranted.
The CMP combines the traffic Level of Service (LOS) and multimodal performance elements required under state CMP legislation, reflecting the legislation’s requirement that LOS be included as one of several multimodal performance measures, and that automobile-focused metrics alone, such as LOS, result in a limited view of transportation issues. For this reason, SFCTA’s approach is guided by San Francisco’s long-standing Transit First policy and emphasis on accessibility for the movement of people and goods by transit, bicycling, walking, and shared modes, while maintaining motor vehicle circulation.
State CMP legislation aims to increase the productivity of existing transportation infrastructure and encourage more efficient use of scarce new dollars for transportation investments, to effectively manage congestion, improve air quality, and facilitate sustainable development. The purpose of the 2025 San Francisco Congestion Management Program is to:
Transportation system performance has begun to stabilize since the COVID-era changes. Arterial and freeway speeds decreased by 4 – 6% between 2024 and 2025. Transit speeds and transit travel time reliability stayed constant between 2023 and 2025. Roadway travel time reliability became better on arterials, but reliability on freeways at peak hours worsened significantly, which may reflect overall increasing peak period congestion near pre-Covid levels, while also having more day-of-week variation in peak period congestion typical of the post-Covid era. Traffic counts on Tuesdays through Thursdays at mid-block locations continued to increase between 2023 and 2025 (+5%), reaching 92% of pre-COVID pandemic (2019) levels. This may indicate that arterial congestion is nearing pre-pandemic levels. The Transportation Authority tracks the ratio of travel speeds by private vehicle vs transit as a primary system performance indicator, reflecting San Francisco’s long-standing Transit First Policy.
Transit ridership is recovering, with Muni, BART, and Caltrain at 72%, 44%, and 54% of 2019 (pre-COVID pandemic) ridership respectively as of Apr/May 2025, and ridership has continued to grow since then. Muni continues to serve more than 95% of San Francisco residents within a five-minute walk of their residence. Moreover, the share of the population within a five-minute walk of a Muni route with a five-minute headway increased to 29% for the AM Peak and to 27% in 2025 for the PM Peak, though this is still lower than the pre-COVID population share within a five-minute walk of a Muni route with a five-minute headway. Multimodal counts conducted at intersections observed sharply rising bicycle counts in the AM Peak (+42%) and PM Peak (+36%) along with more flat pedestrian counts in the AM Peak (+0%) and a modest increase in the PM Peak (+8%). Average monthly micromobility trips have also increased 110% from 2023 to 2025 in data available through September.
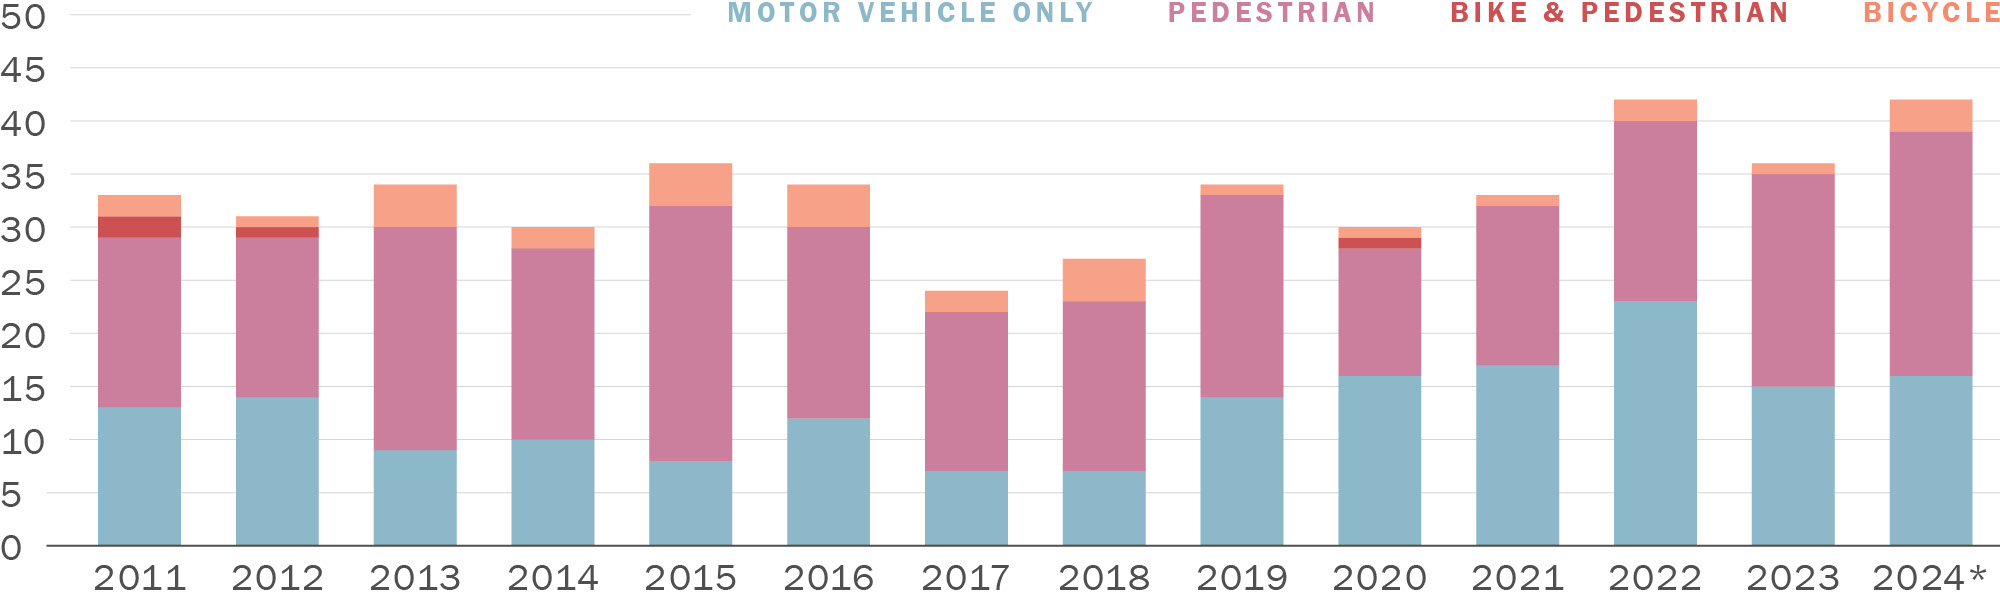
The number of property-damage only (PDO) collisions, non-severe injury collisions, and severe injury collisions in San Francisco has remained mostly stable since 2020. However, the number of fatal traffic collisions in 2024 at 42 (of which 23 and 3 involved pedestrians and bikes, respectively) is the highest observed since 2011 (other than 2022 which has the same number of fatal collisions).
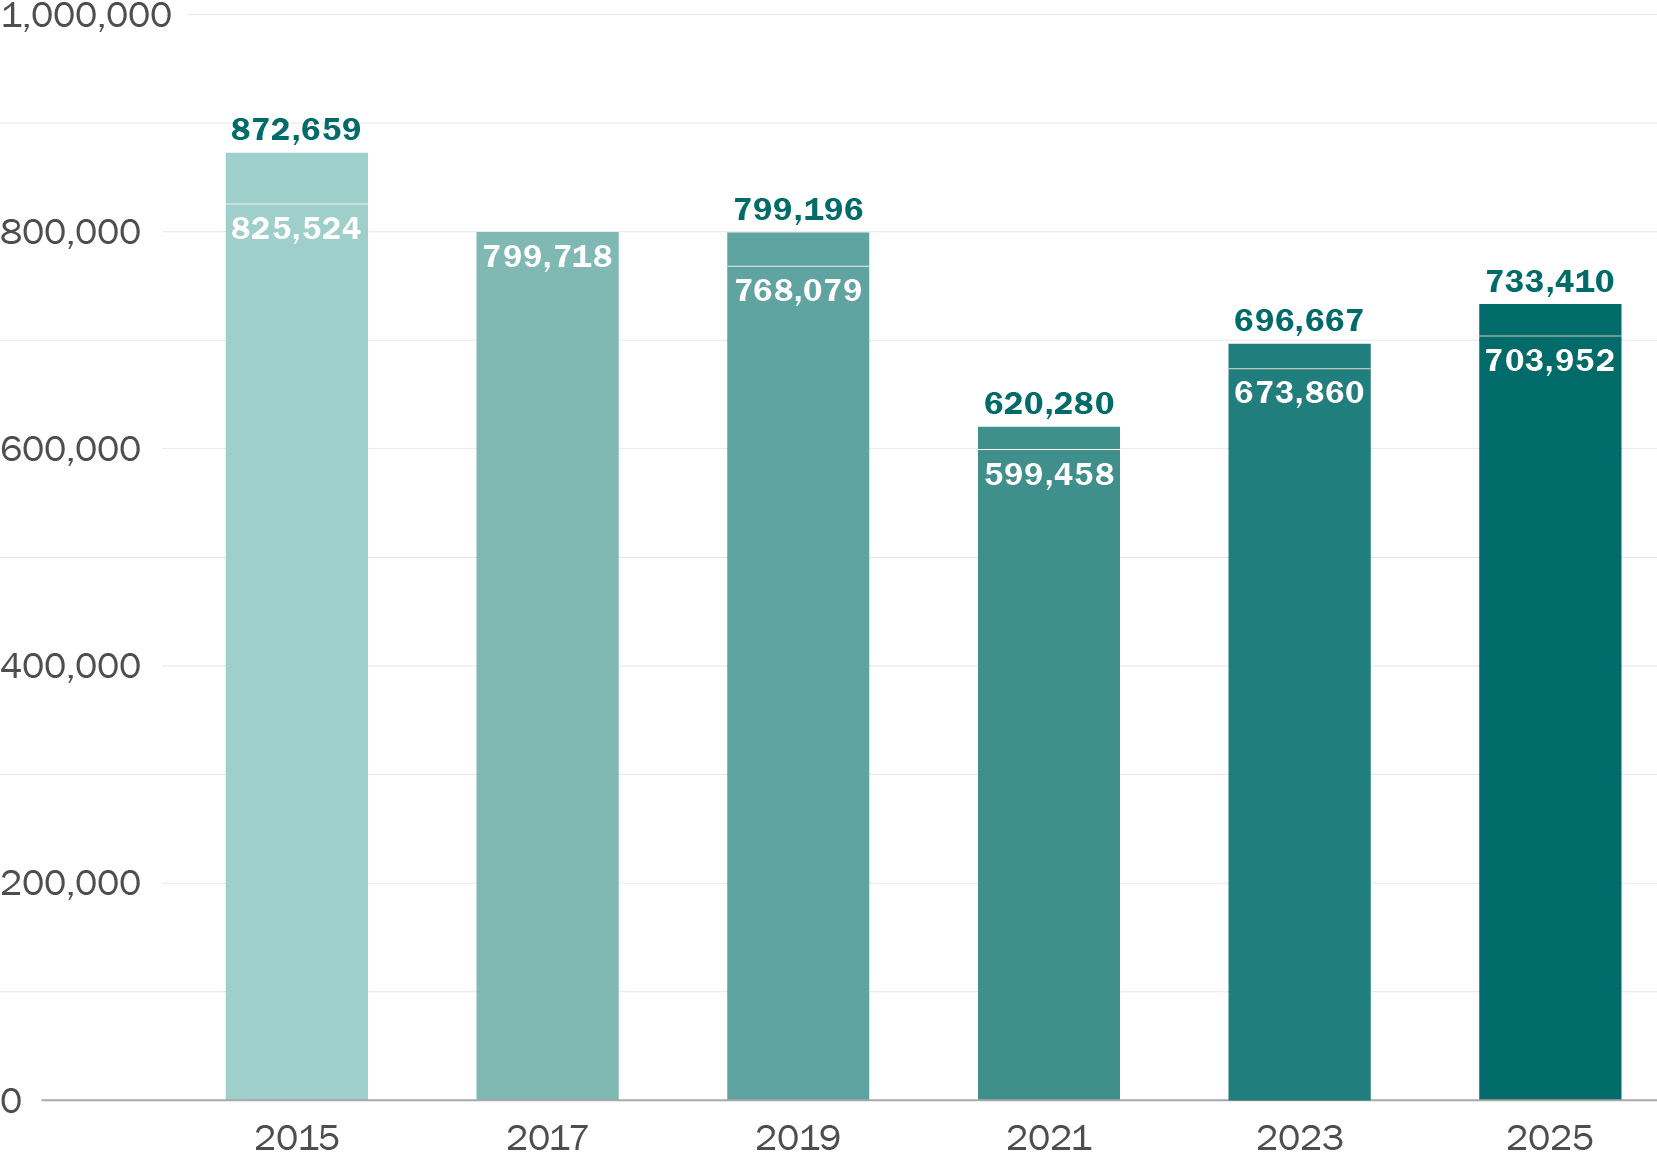
As reported in the Transportation Authority’s Downtown Travel Study (March 2025), while San Francisco continues to be an employment and population hub in the Bay Area, significant changes have occurred in both San Francisco population and employment since the COVID pandemic. San Francisco’s population declined from a peak in 2019 of 882,000 to 814,000 in 2022 due to the COVID pandemic, but its population has been steadily recovering since, reaching 828,000 by 2024. Employment in San Francisco peaked right before the COVID pandemic in 2019 at 764,000, and dropped due to the COVID pandemic between 2019 and 2020. Employment numbers increased to 758,000 in 2022, though there has been a decrease since then to 719,000 in 2024. The COVID pandemic produced profound changes in commuting patterns that affect the transportation system performance metrics reported in this document. In 2019, only 7% of employed San Francisco residents reported regularly working from home, but during the peak of the COVID pandemic in 2021, this share increased to 46%, before declining in 2023 to 24% of employed residents working from home.ACS One-Year Supplemental Estimates, Table K200801
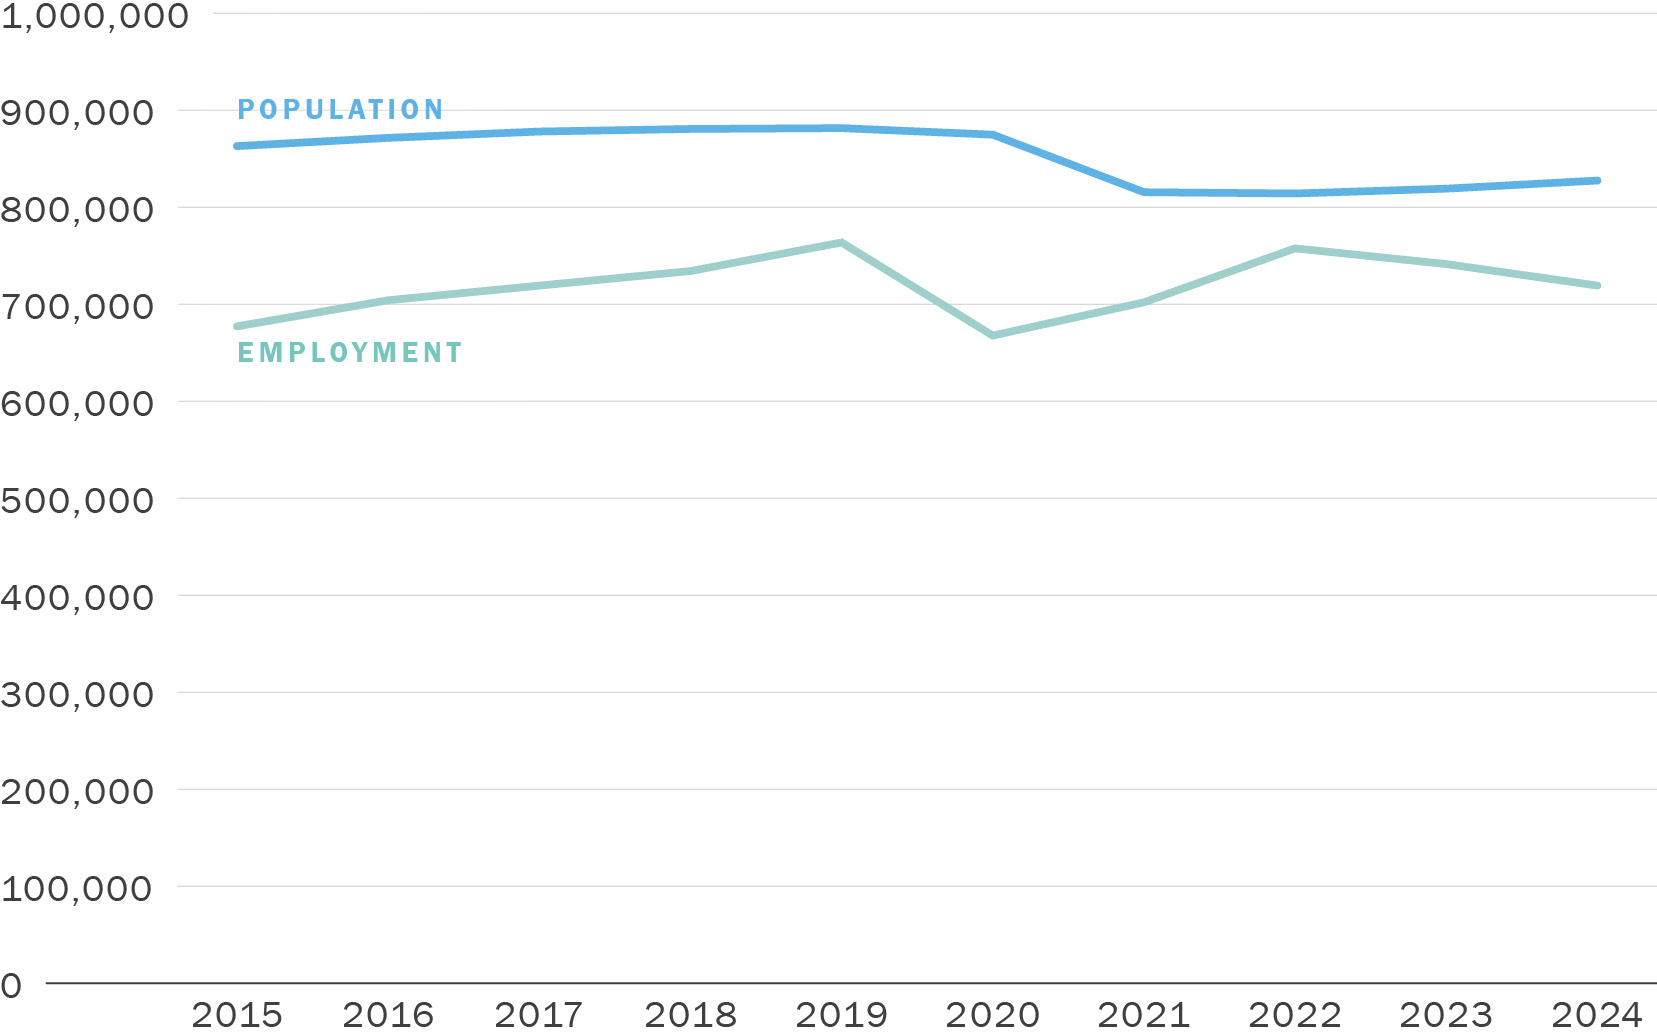
Note: Population and employment estimates are as of July 1 of each year
Population Source: US Census Population and Housing Unit;
Employment Source: California Employment Development Department Current Employment Statistics
Download chart data (CSV)
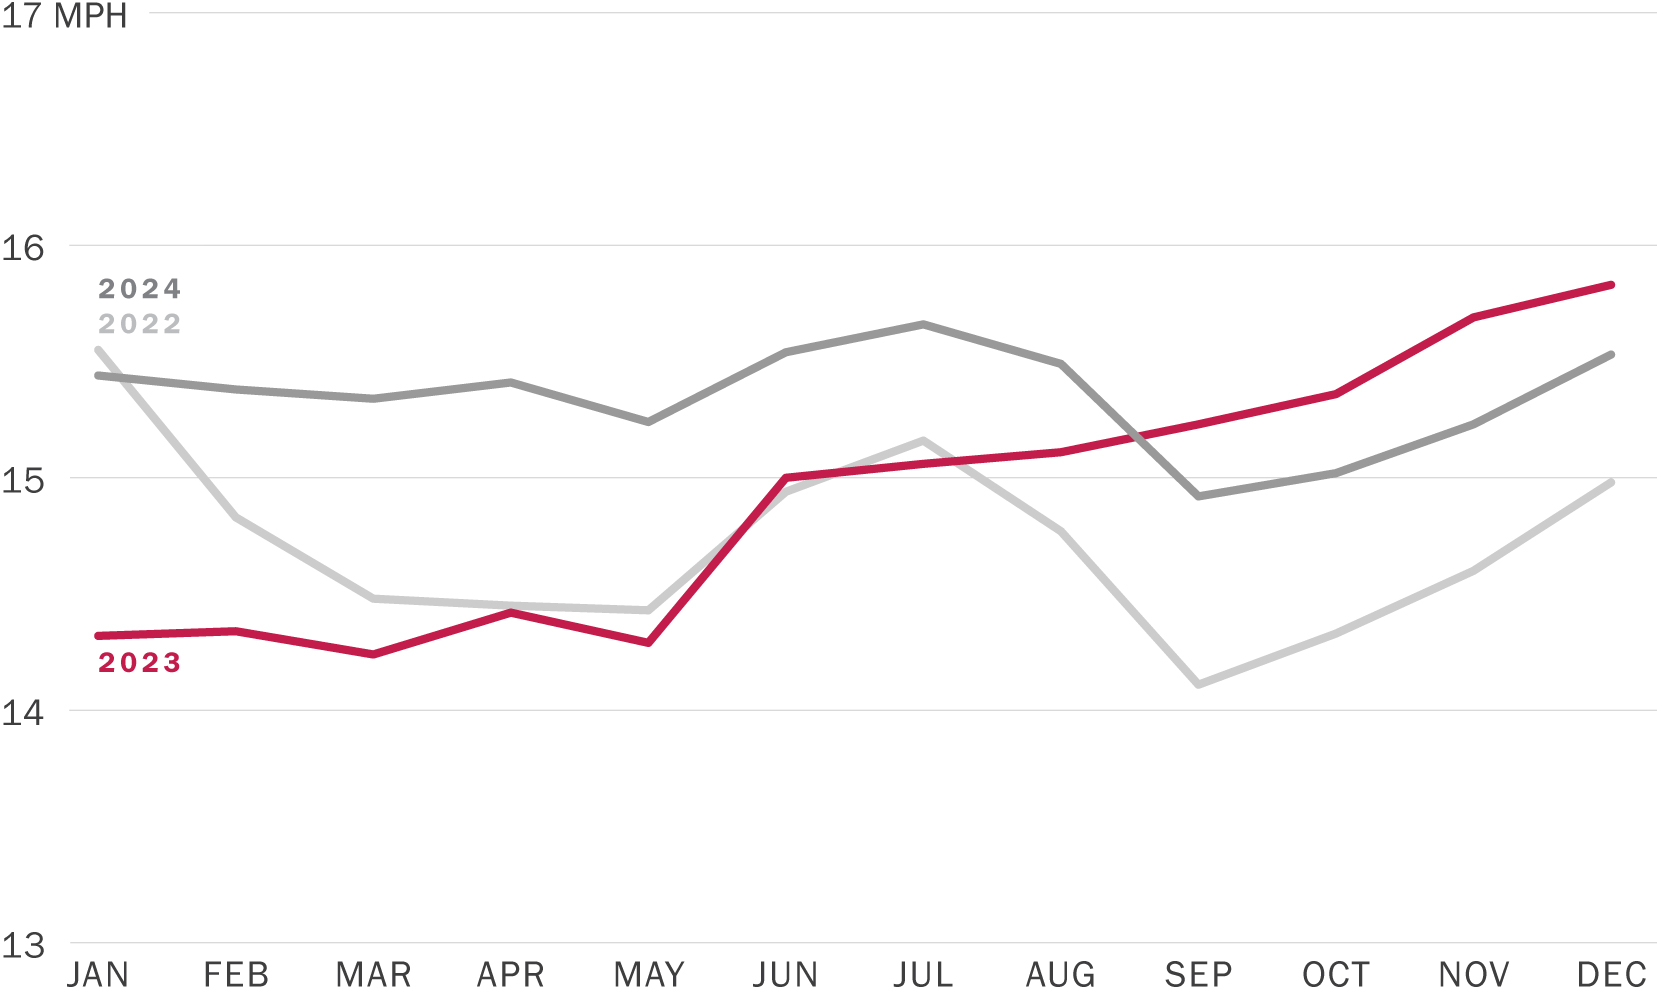
Traffic speeds vary seasonally, with lower speeds in the spring and fall, and higher speeds in the summer and winter during holidays and school closures. The CMP accounts for this seasonality by monitoring speeds in the same months, April and May, of each year. Speeds during 2020 and 2021 followed unique patterns due to the Covid 19 pandemic, but typical seasonality was evident again in 2022. From 2022 to 2025 so far, each year has exhibited normal seasonal trends. However, in August and September of 2023, when speeds typically decline from summer highs, INRIX data showed speeds continuing to increase. Staff could not identify any events that would explain a significant two-month long deviation in typical seasonal speed trends and believe there is an error in the underlying data or change in data processing methods, although INRIX has not confirmed this. After this unexplained increase in speeds data resumed typical seasonal patterns, although at elevated speeds. This resulted in higher peak period traffic speeds in 2025 than in 2023, which is an unintuitive trend that is not supported by contemporaneous arterial traffic counts in 2023 and 2025. As a result, the following analysis compares 2025 data to 2024 rather than data from the previous 2023 cycle, as would be typical.
Download chart data (CSV)
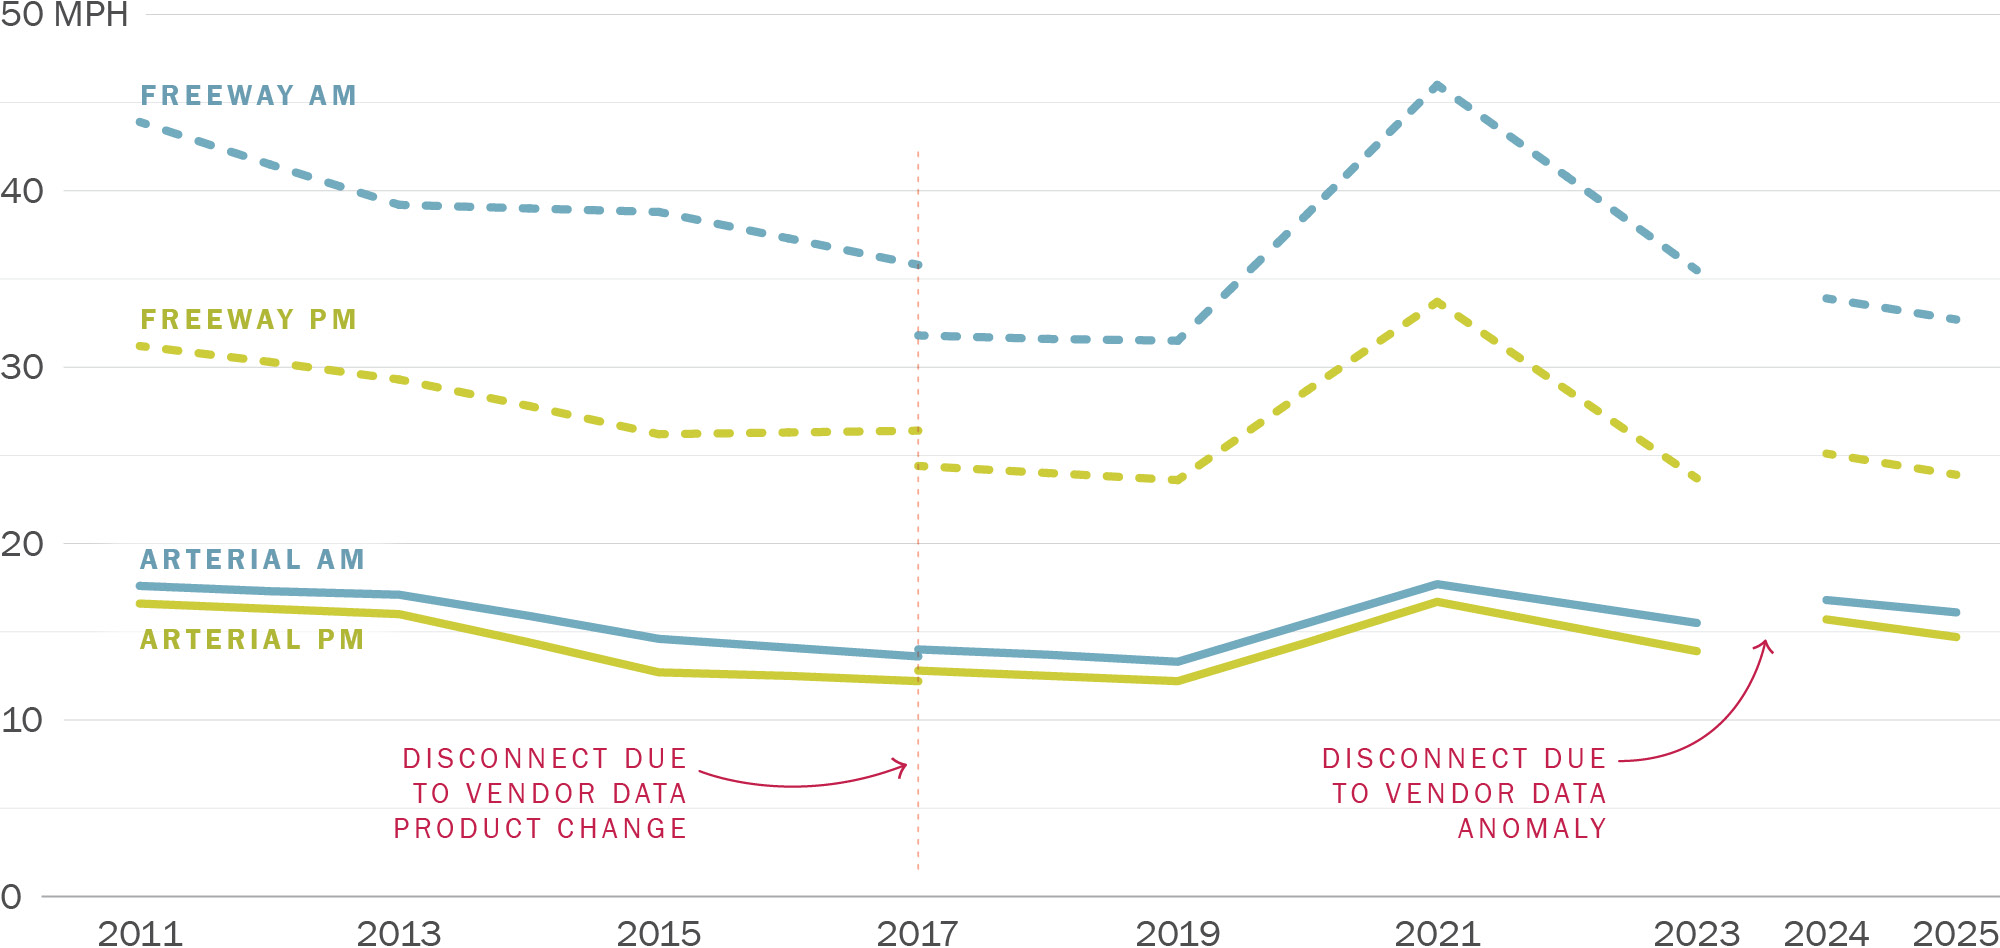
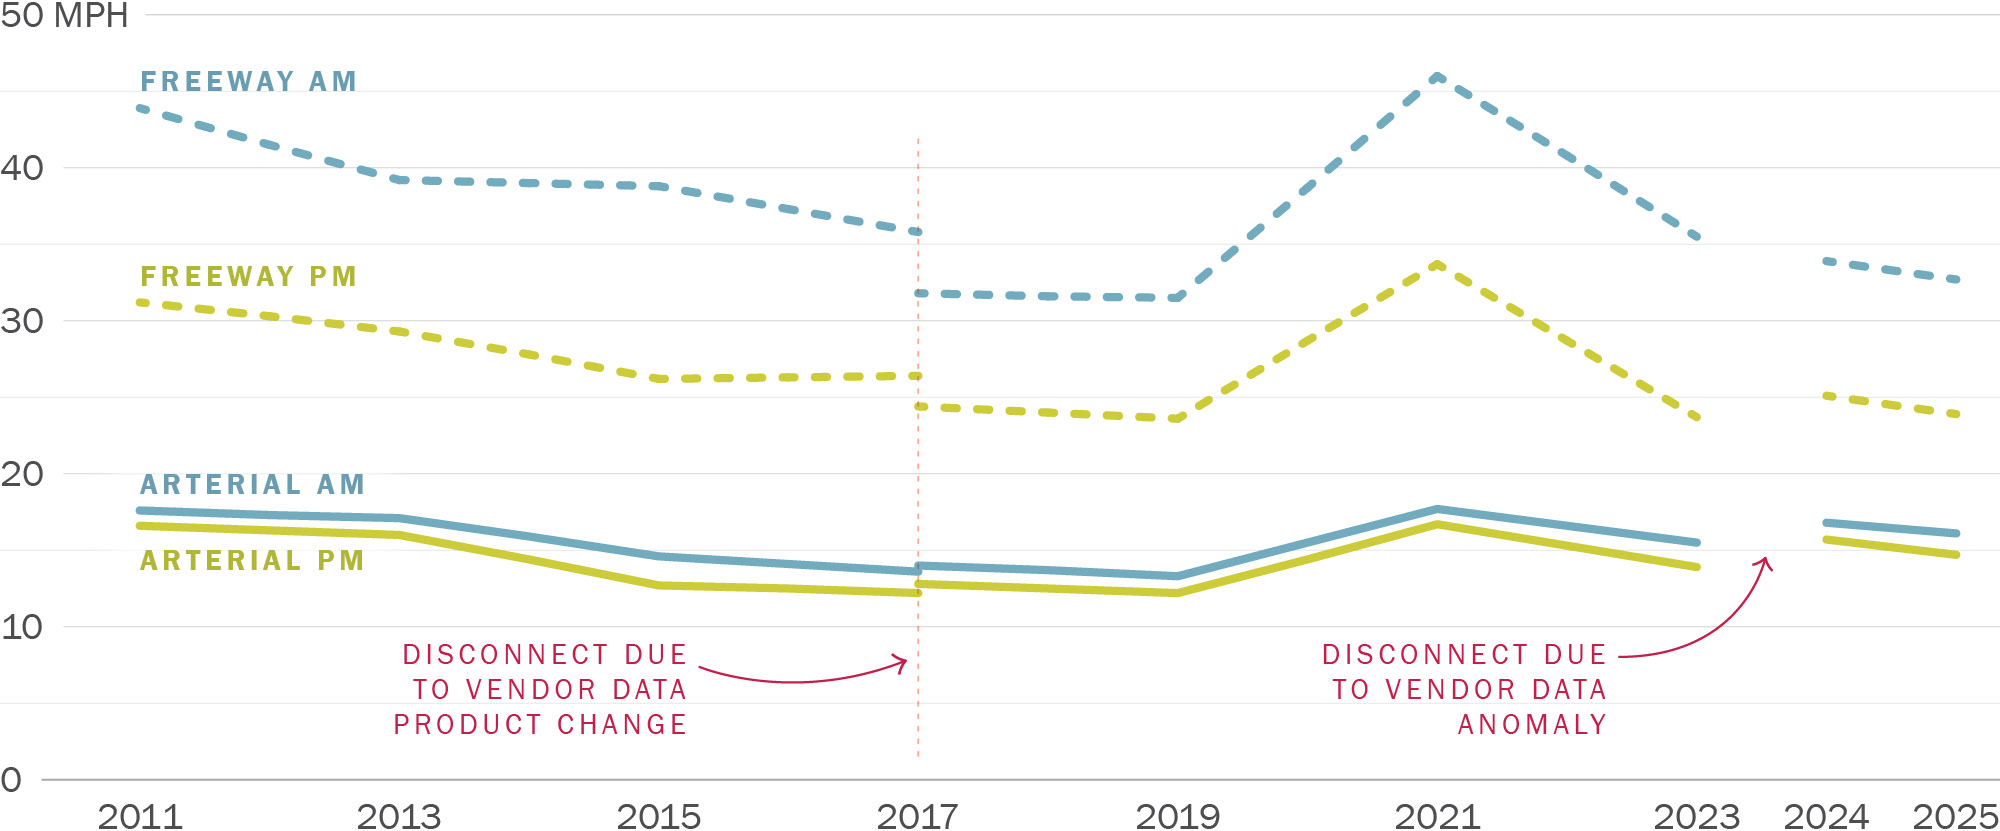
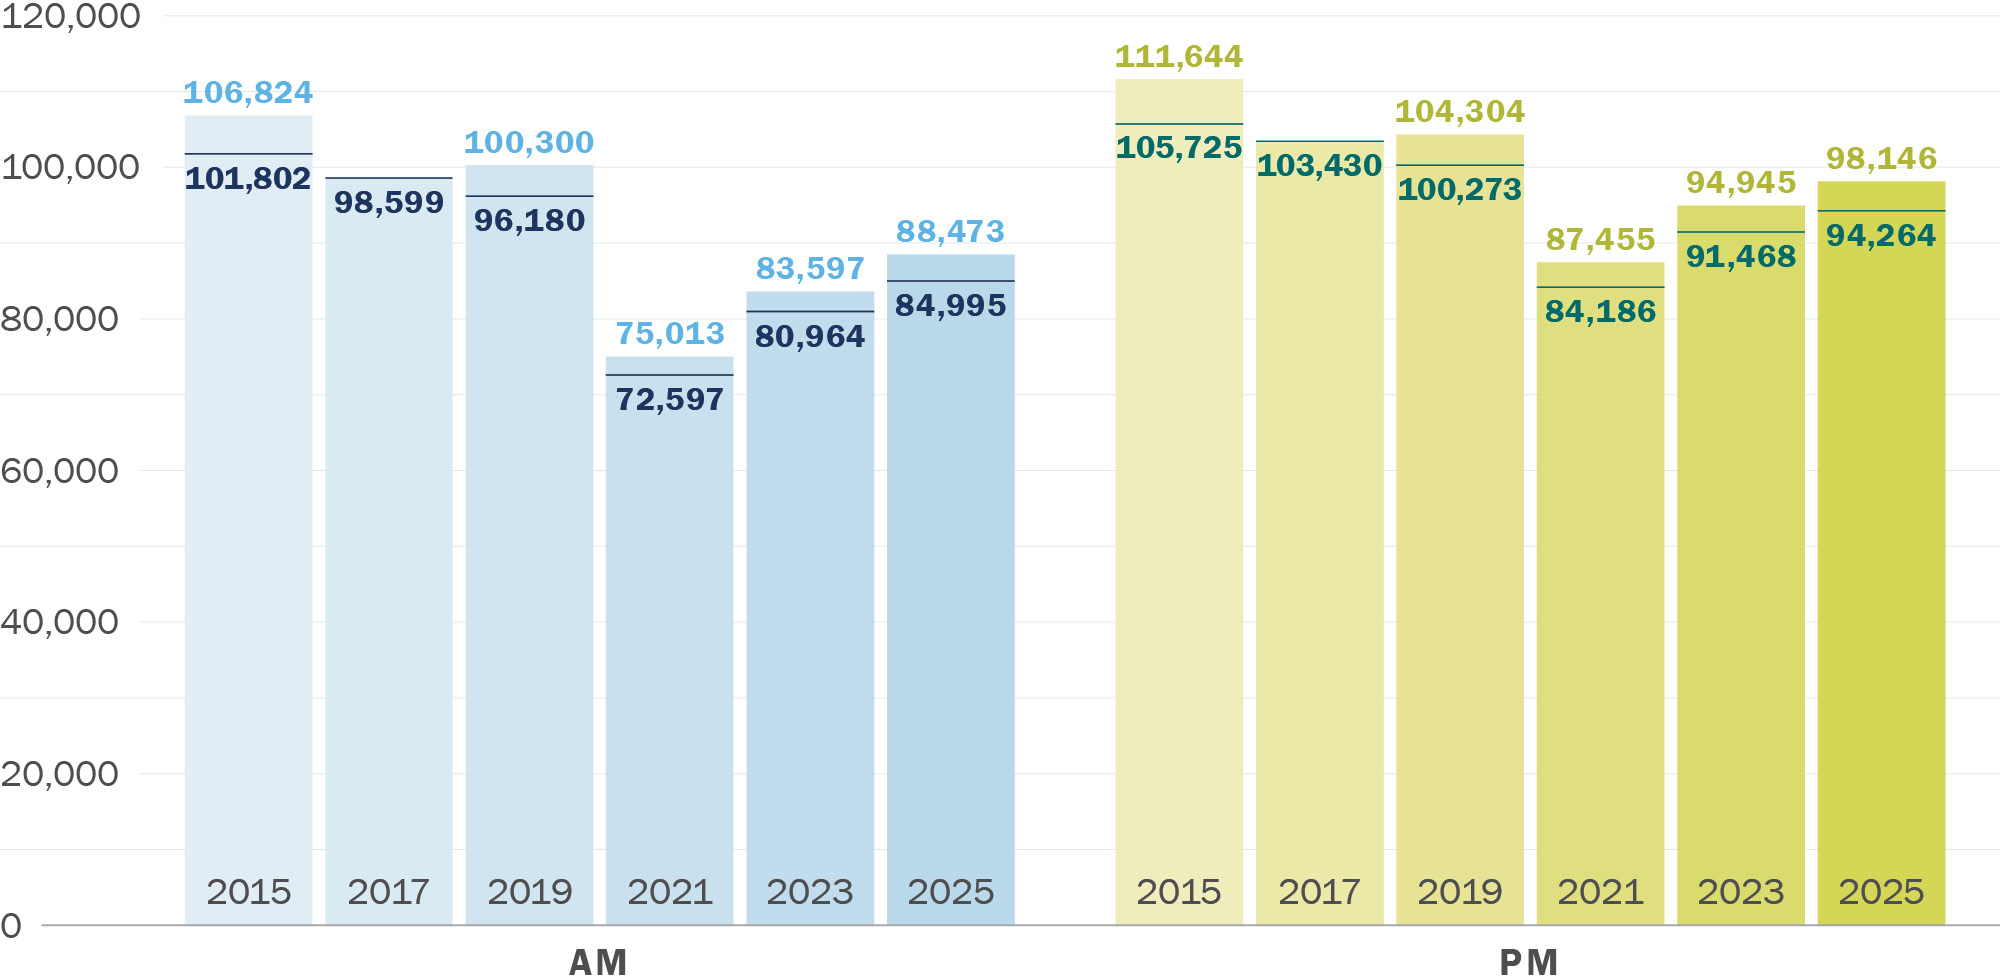
In general, roadway speeds are lower during the PM Peak than in the AM Peak, conforming to long-time historical trends. Roadway speeds increased in 2021 during the COVID pandemic, then decreased between 2021 and 2023 as people began to return to pre-COVID pandemic activity levels. The trend in speeds from 2023 to 2024 is unknown due to the anomaly described above. From 2024 to 2025 Freeway AM Peak speeds decreased by 4% and PM Peak speeds decreased 6%. Arterial speeds decreased by 4% in both the AM Peak and PM Peak between 2024 and 2025 (Figure 0-3).
Note: data collected April – May each year
Download chart data (CSV)
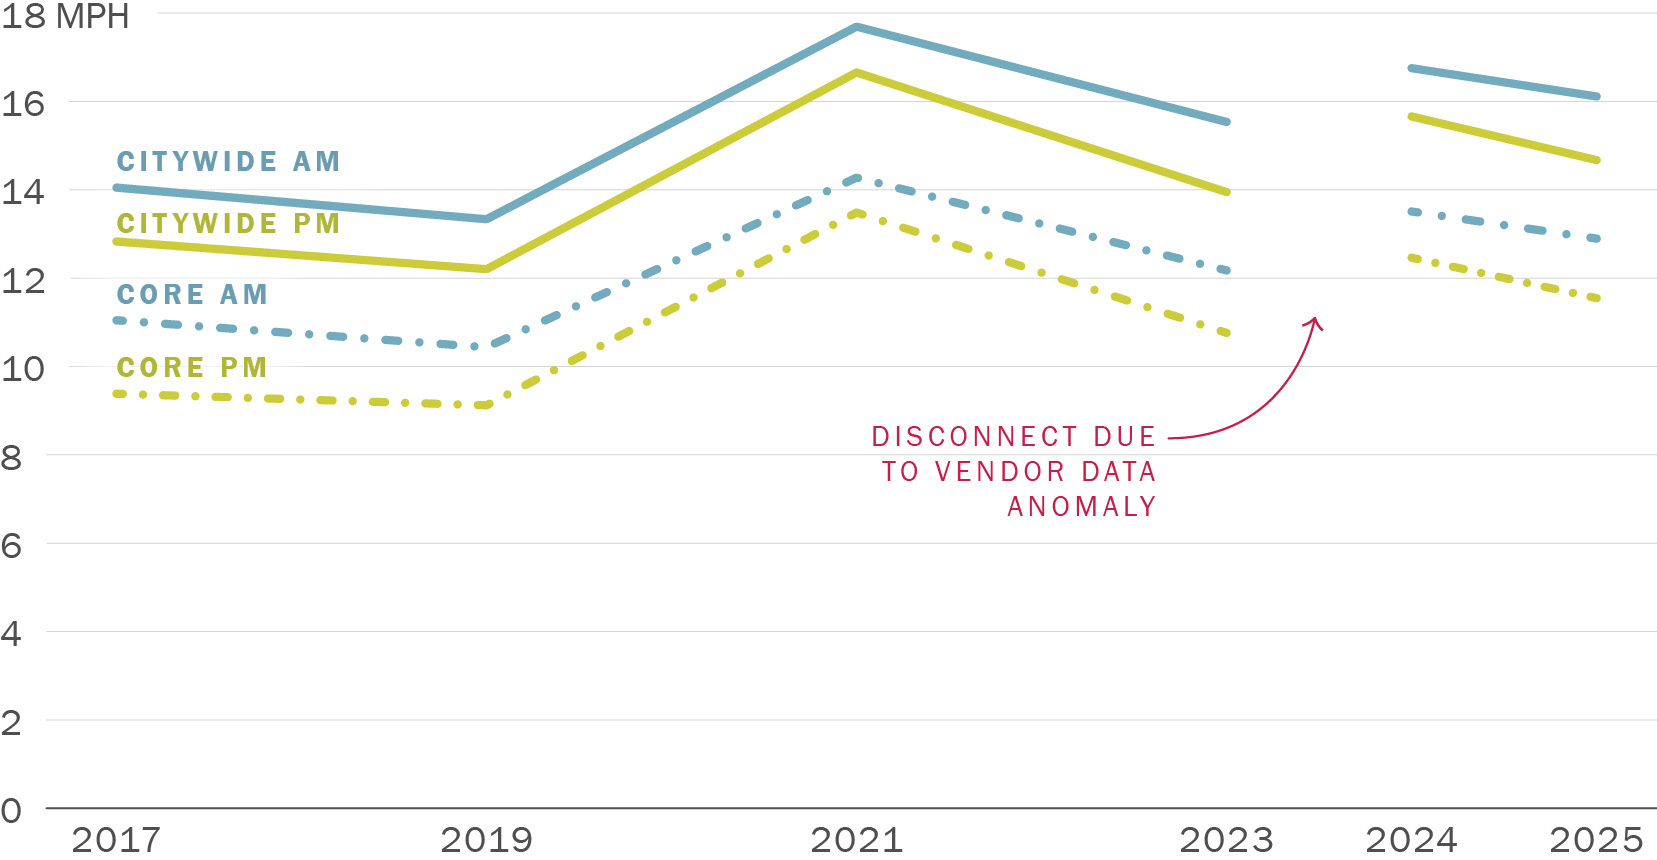
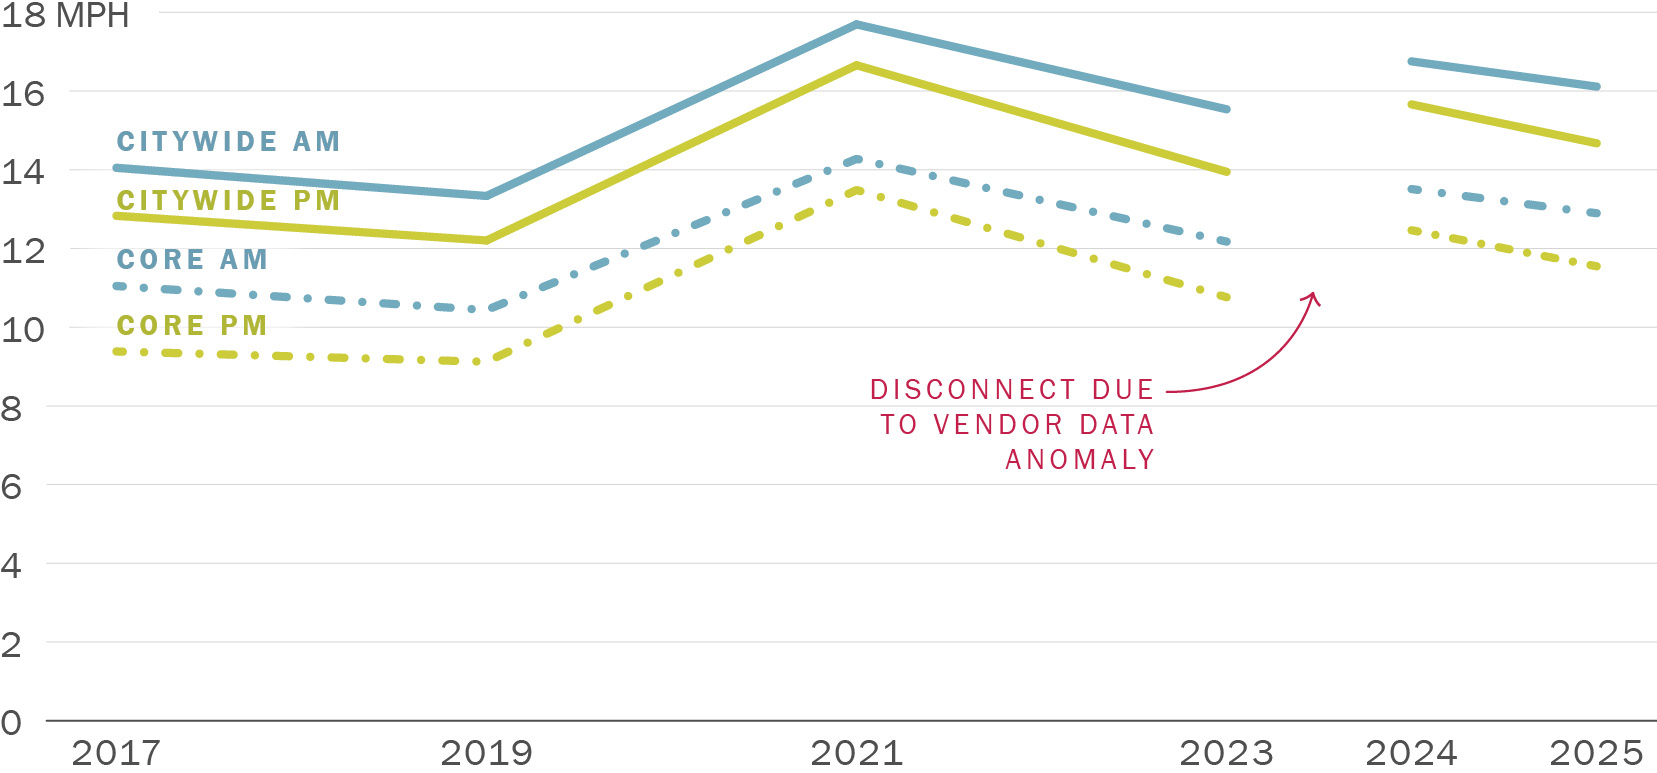
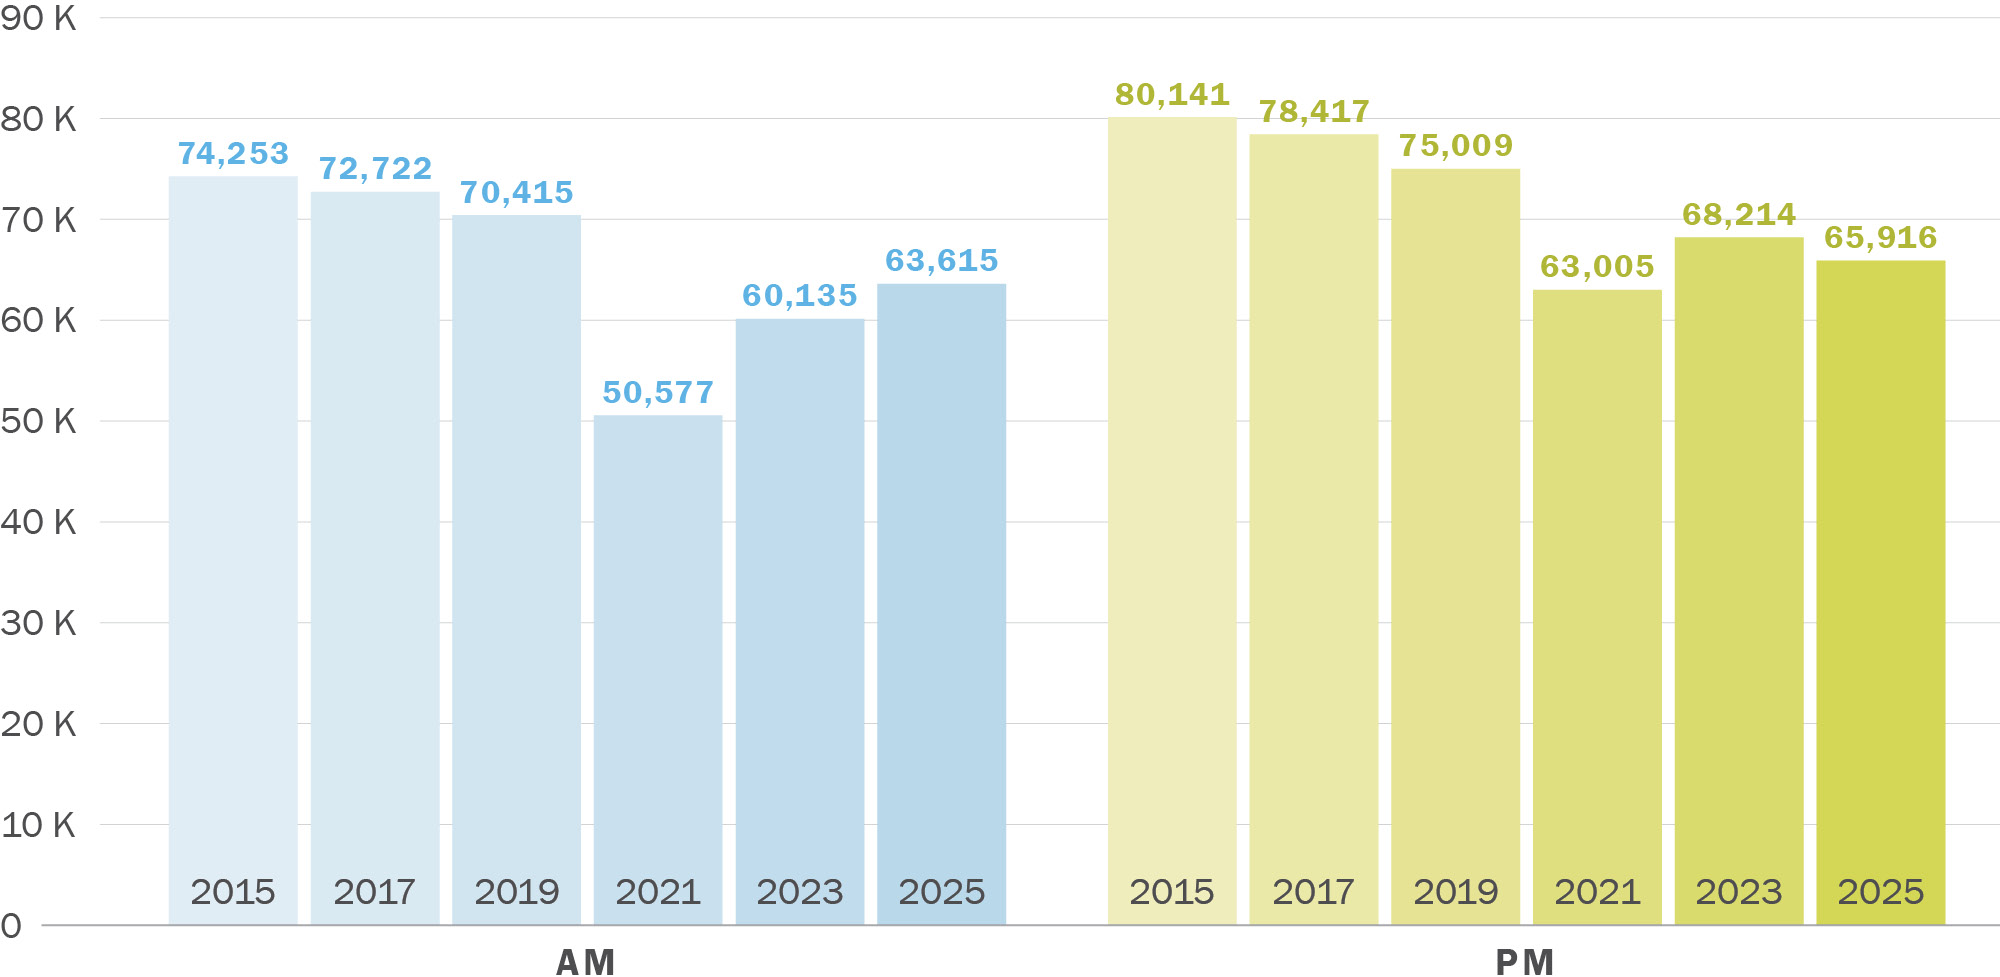
Arterial roadway speeds in the downtown core are historically lower than citywide average arterial speeds. Between 2024 and 2025, arterial speeds in the downtown core declined by 6% in the AM Peak and 7% in the PM Peak, a faster rate of decline than citywide arterial speeds (Figure 4-3)
Note: data collected April – May each year
Downtown Core in this figure is defined to include streets east of Franklin/Gough Streets, and north of the Central Freeway and Mission Creek. It also includes the streets immediately surrounding the Octavia Boulevard entrance/exit of the Central Freeway
Download chart data (CSV)
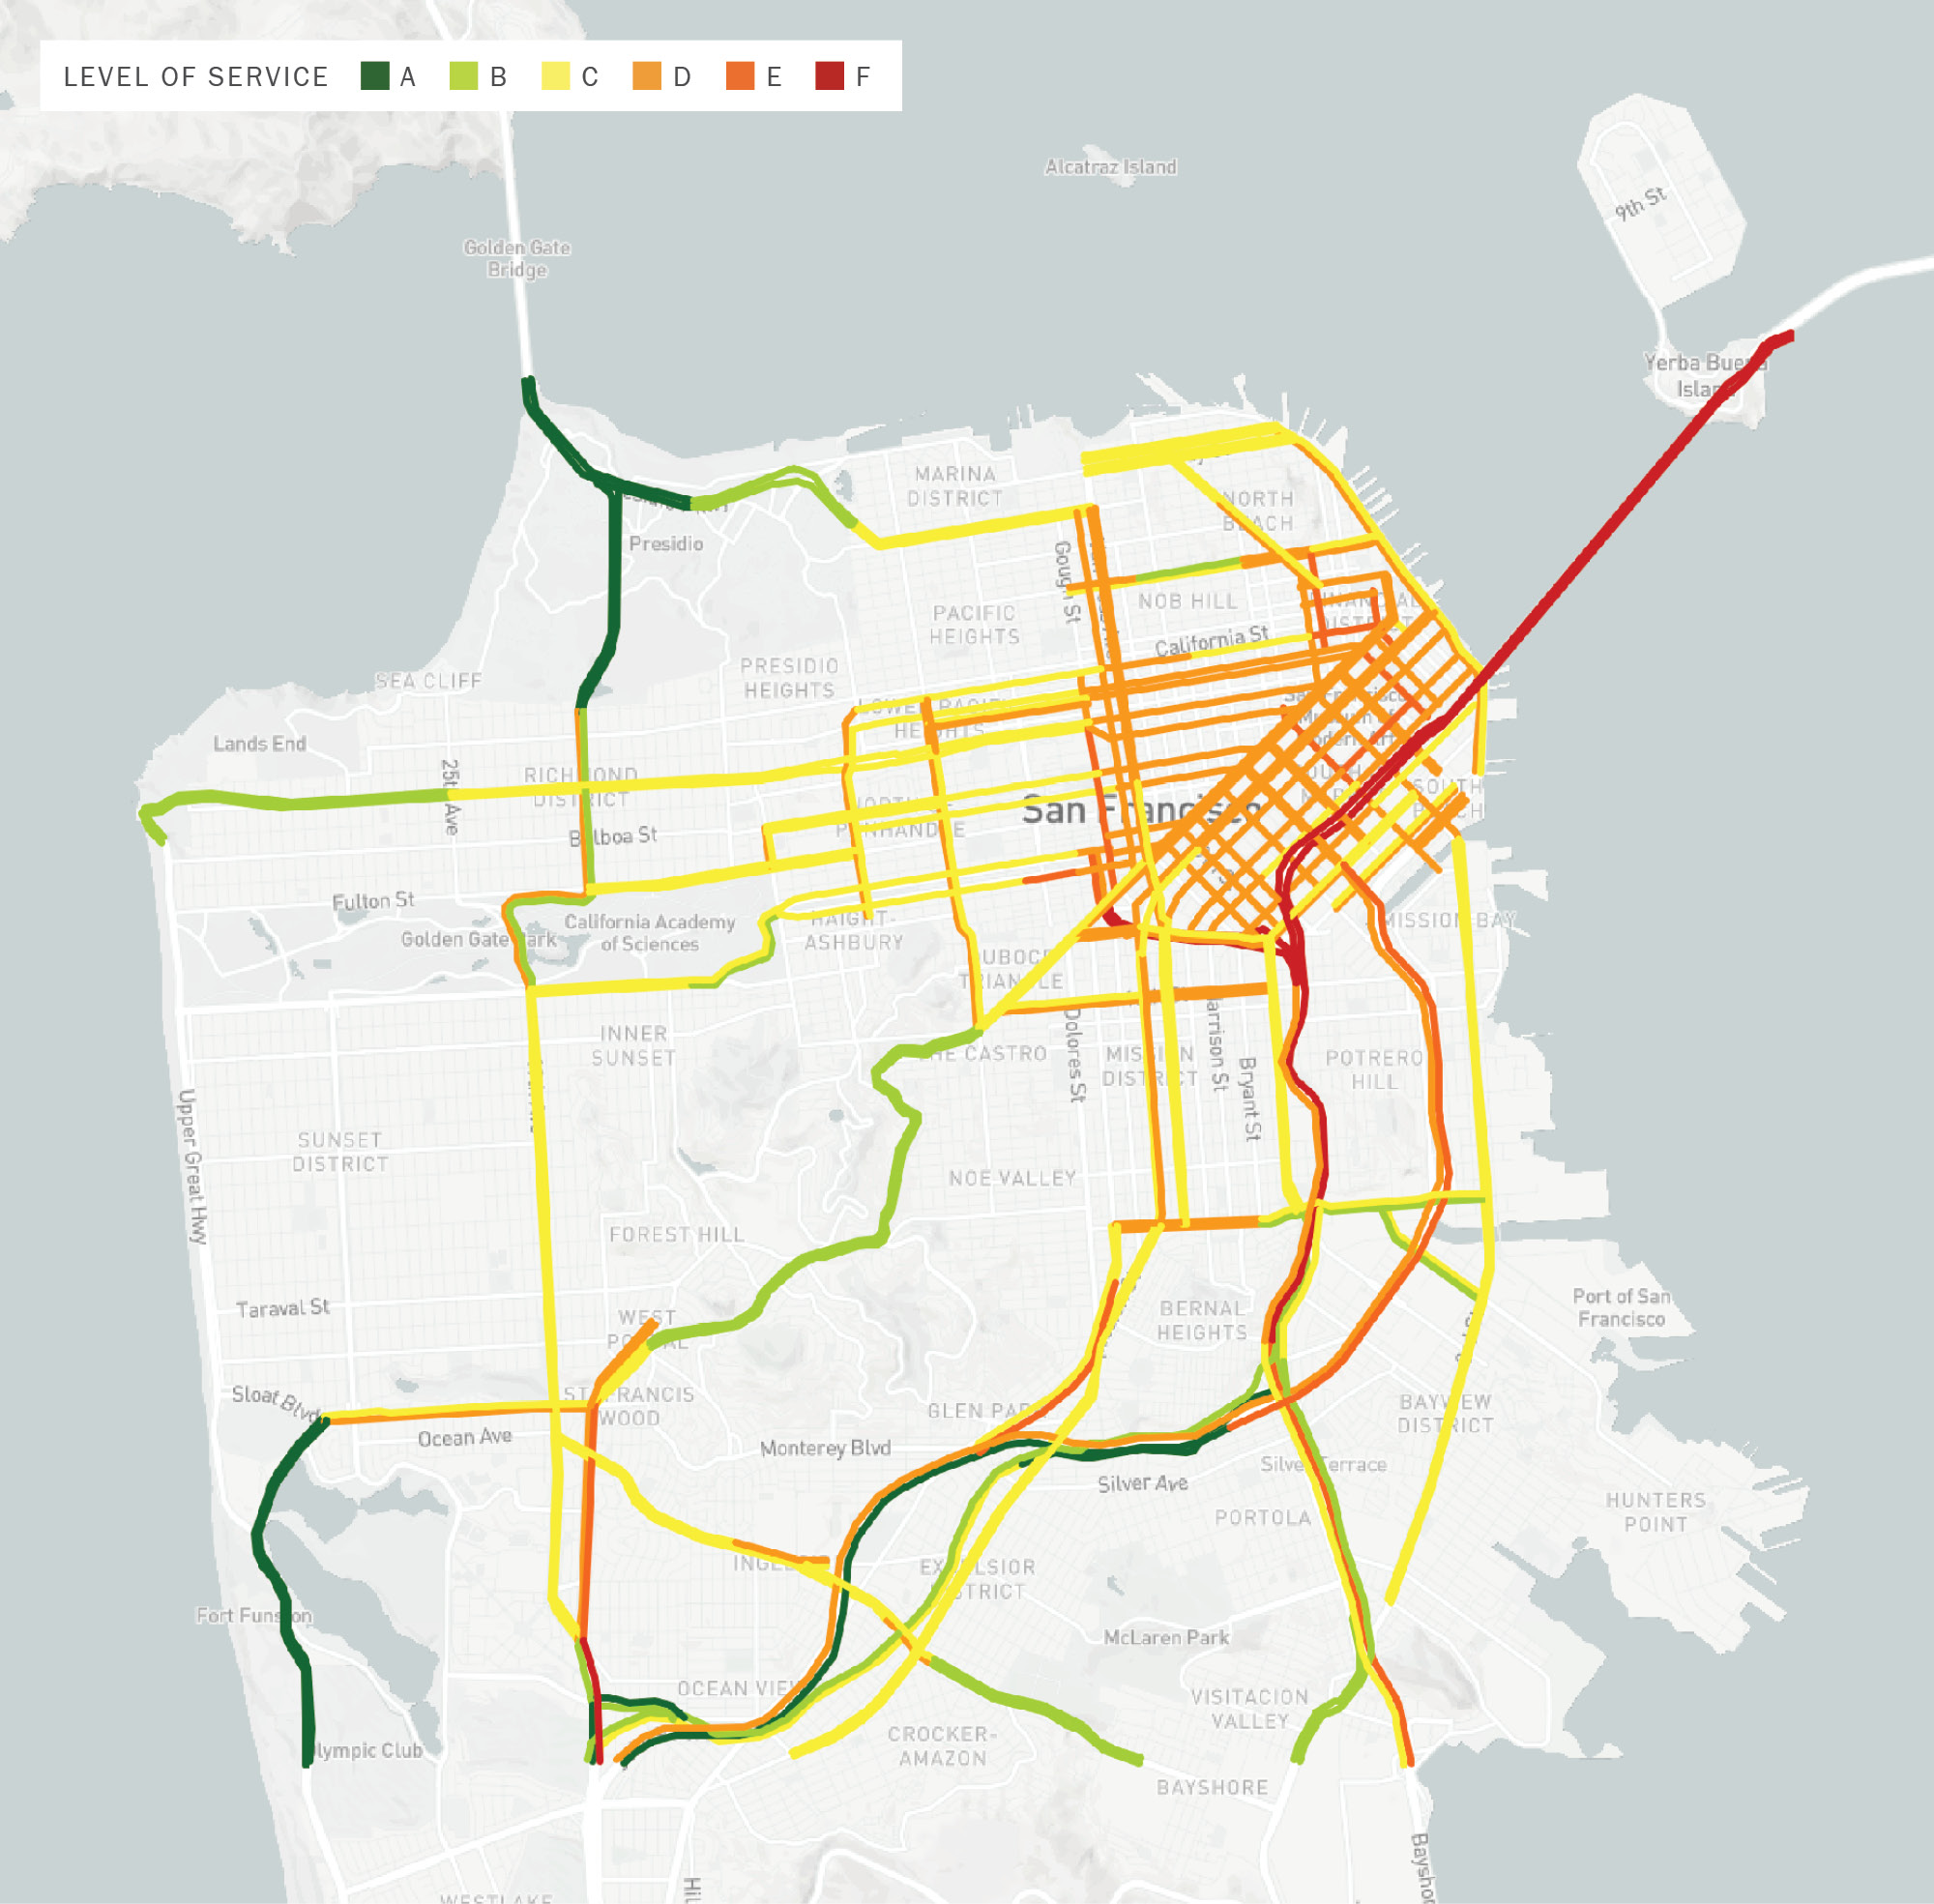
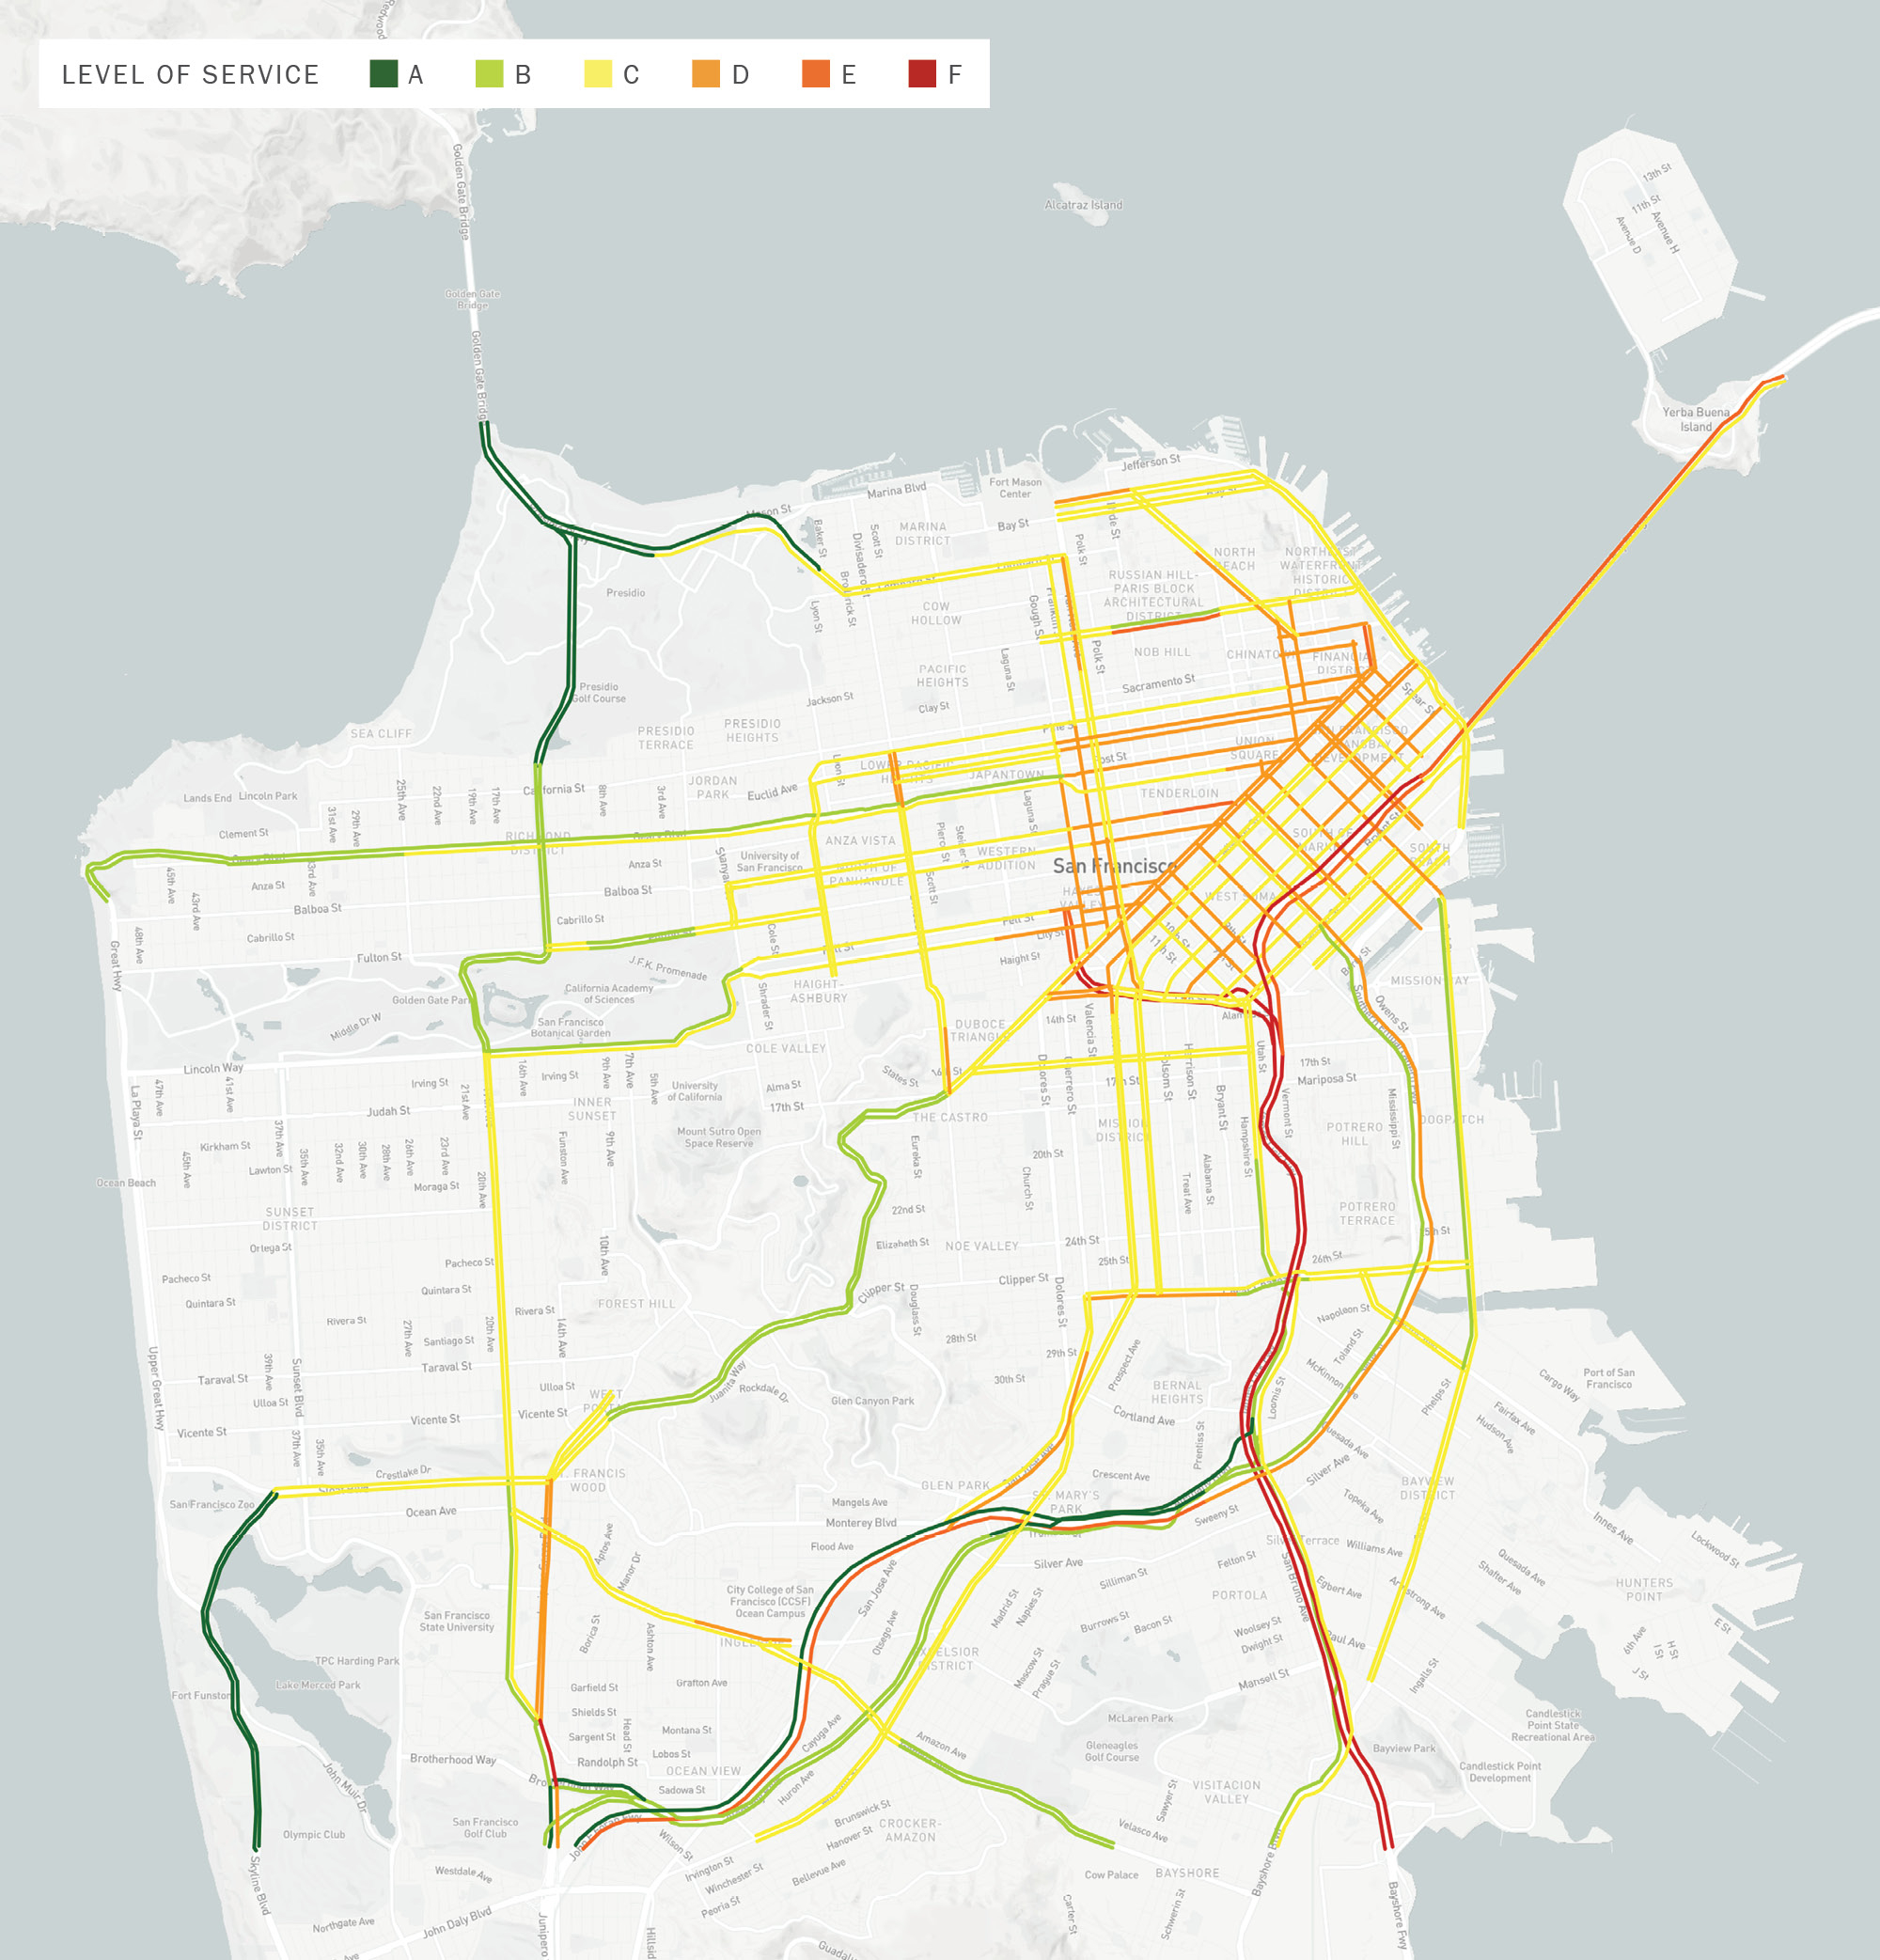
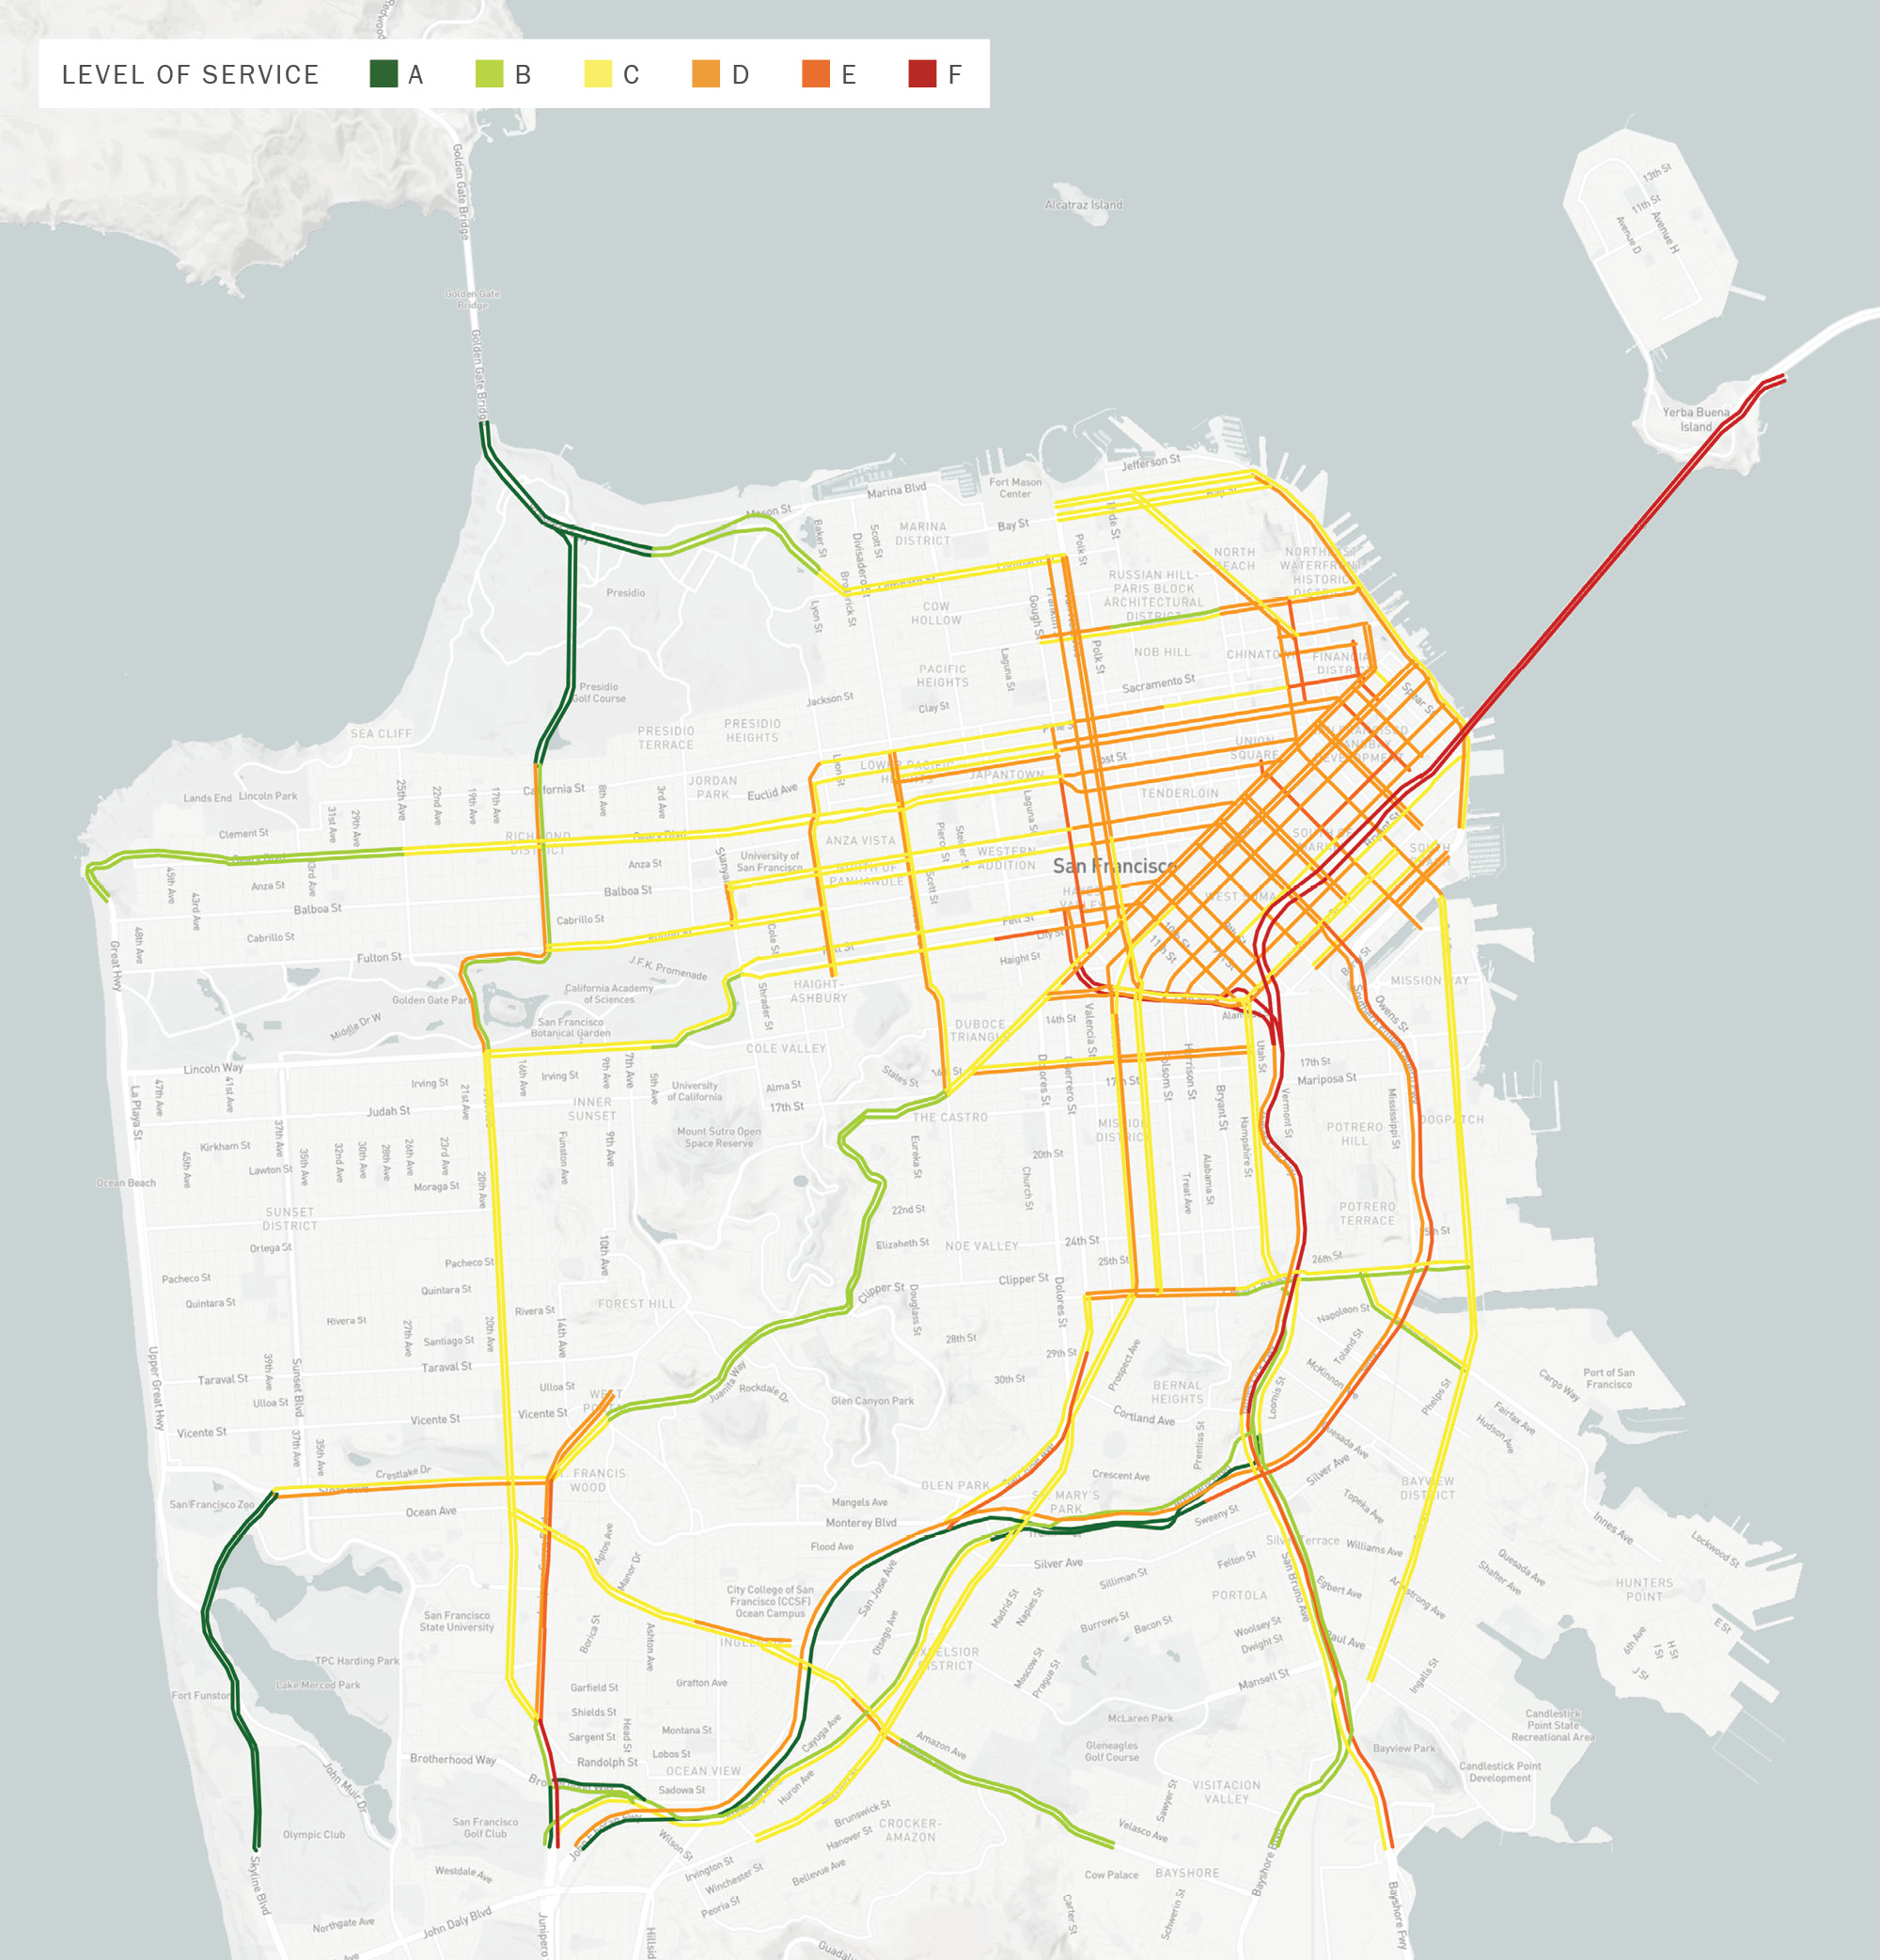
The CMP legislation defines roadway performance primarily by using the LOS traffic engineering concept to evaluate the operating conditions on a roadway. LOS describes operating conditions on a scale of A to F, with “A” describing free flow, and “F” describing bumper-to-bumper conditions.
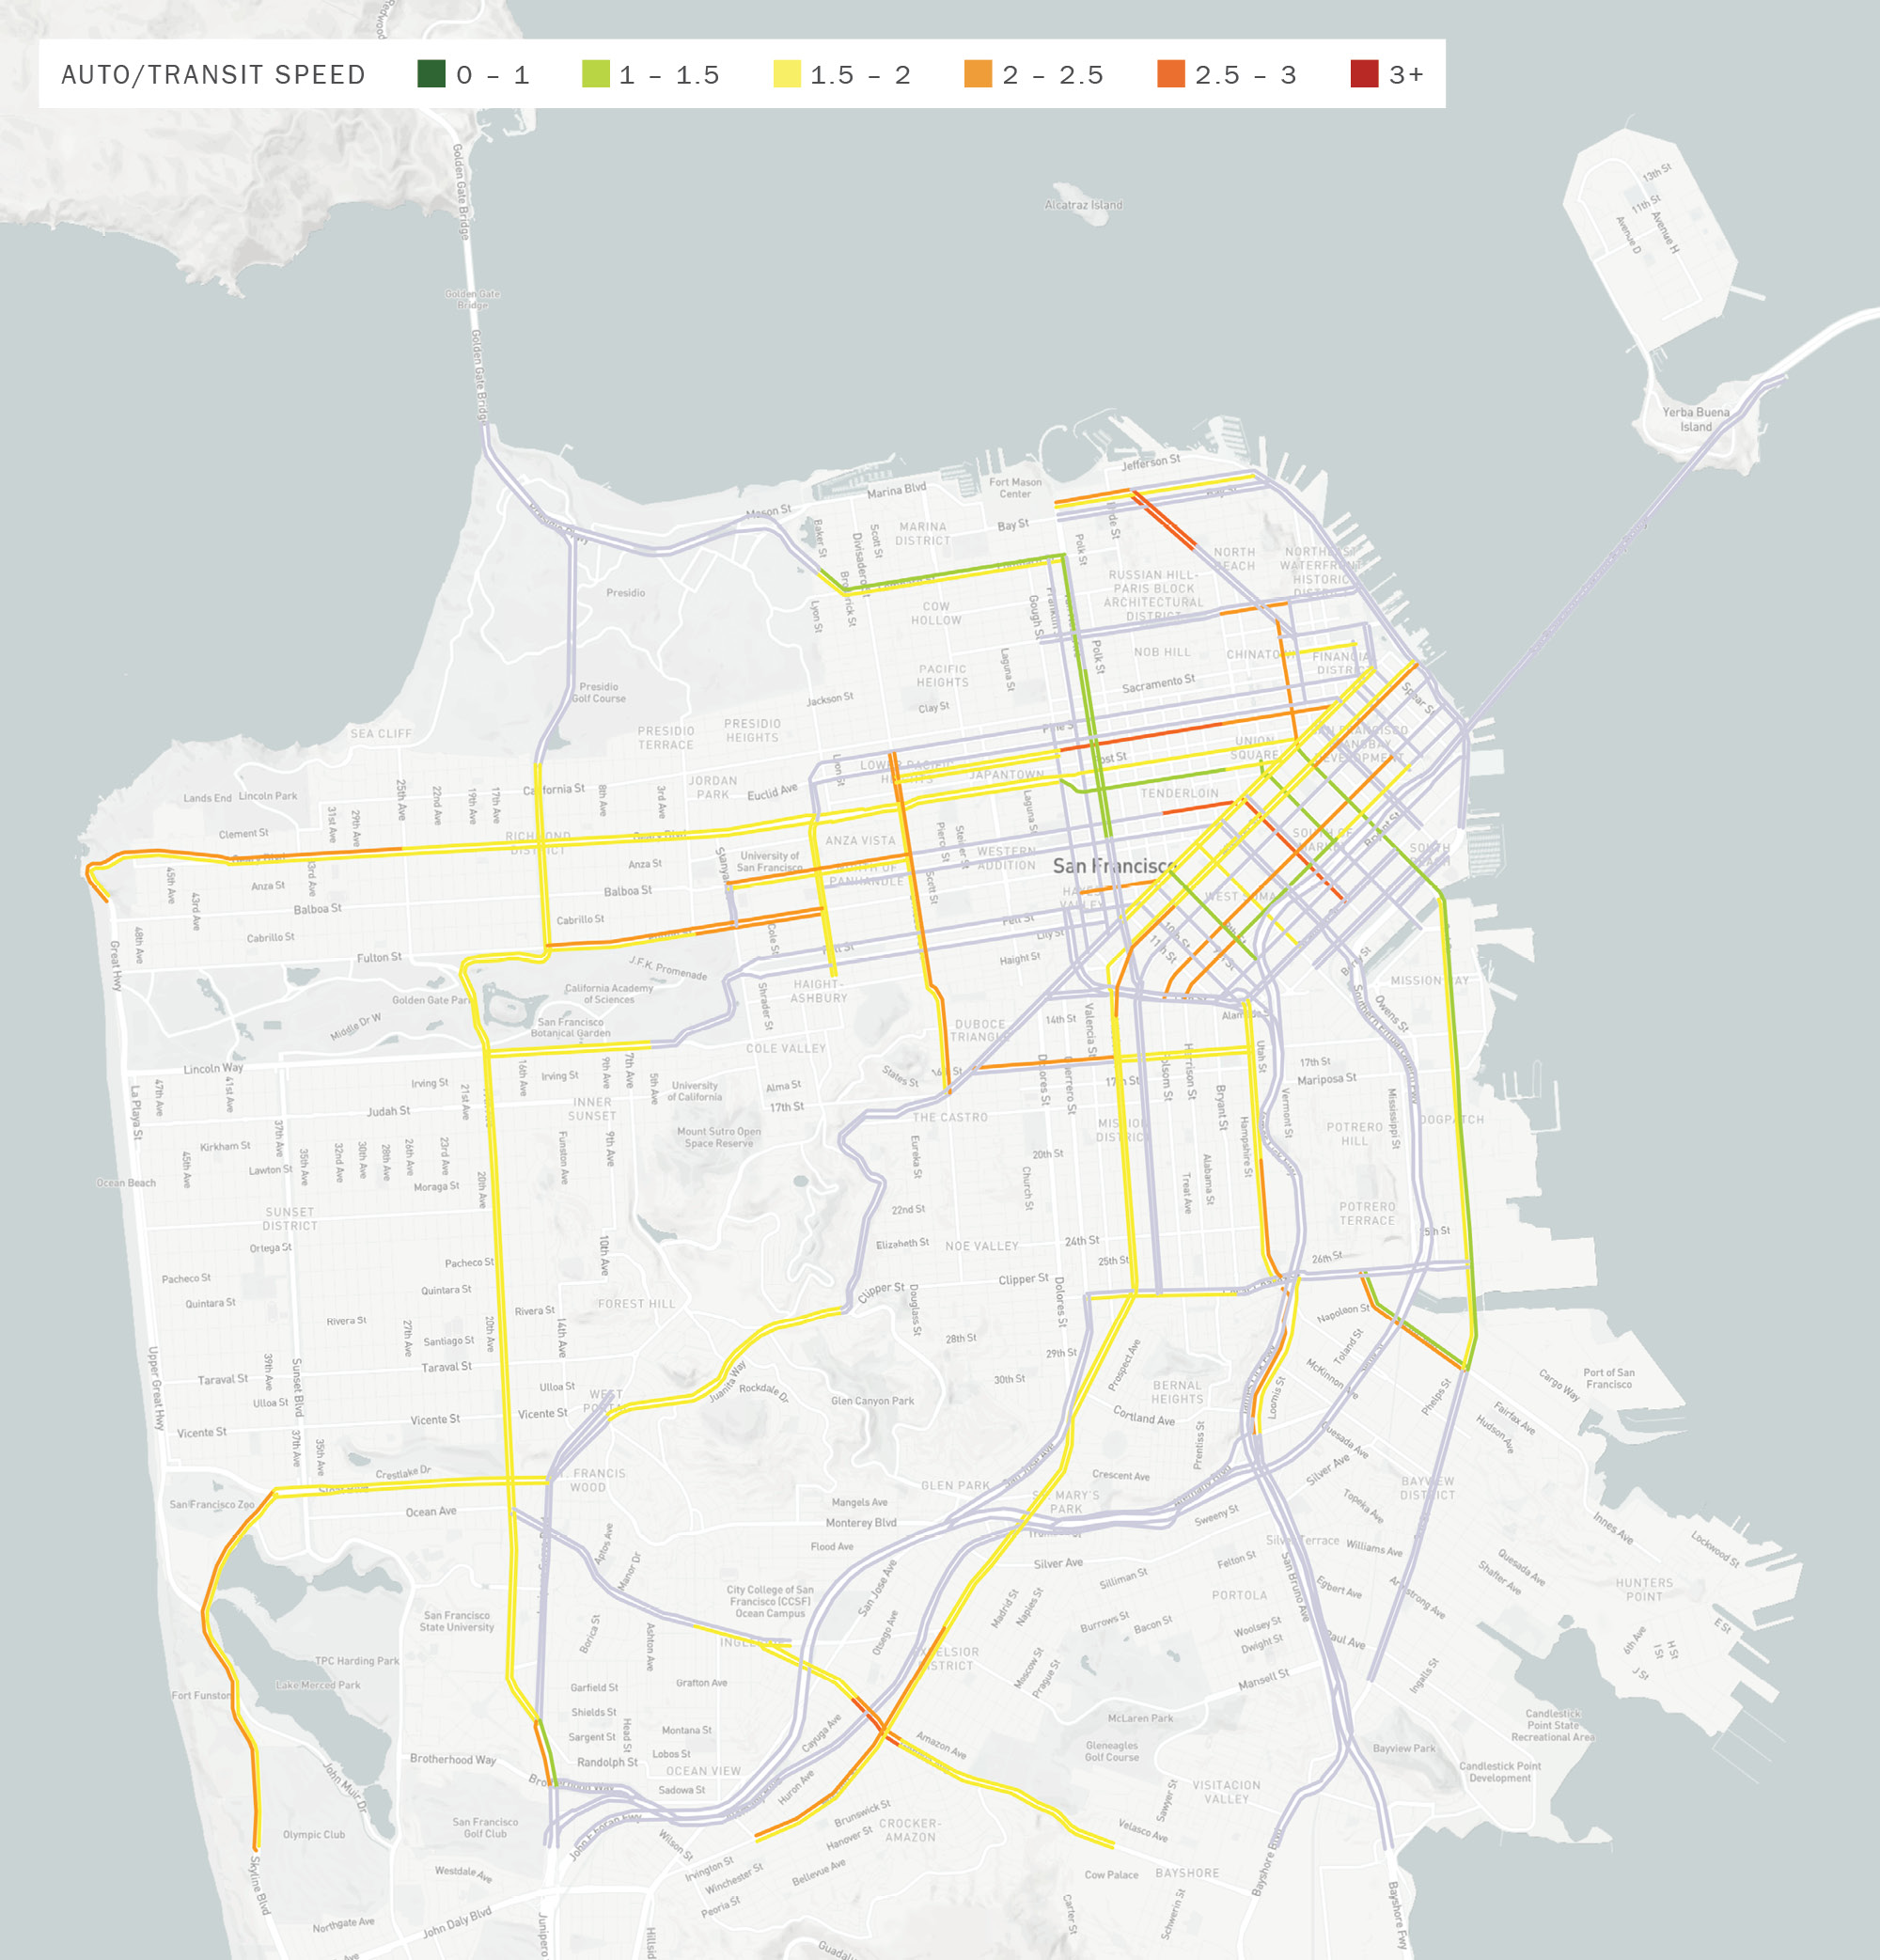
Figure 0-5 shows PM Peak LOS in 2025. Freeways approaching and traversing the downtown core are congested, with LOS ranging from D and F. The southern leg of US-101 and I-280, further from the downtown core, are less congested, with LOS ranging from A to D. Arterials in downtown are nearly uniformly LOS D, while arterials outside of the core perform better and have more variability, ranging from A to D. The AM Peak shows similar trends. As noted in the Downtown Travel Study, this profile of traffic congestion lies within a context of a fluid downtown recovery. An interactive version of this map that allows users to view historical trends for the City overall, as well as for all the individual CMP segments, can be found at cmp.sfcta.org.
While the average travel speeds and LOS provide useful insights into congestion, they do not capture a critical aspect of peoples’ perception of congestion, which is the reliability of travel times. For example, a traveler is likely to perceive the congestion on a roadway where the travel is always 15 minutes differently that they perceive the congestion on a roadway where half the time the travel time is 5 minutes and the other half the time the travel time is 25 minutes. The unreliability of the travel time on this second roadway is onerous because it forces travelers to change their schedule so as to ensure that they aren’t late to their destinations.
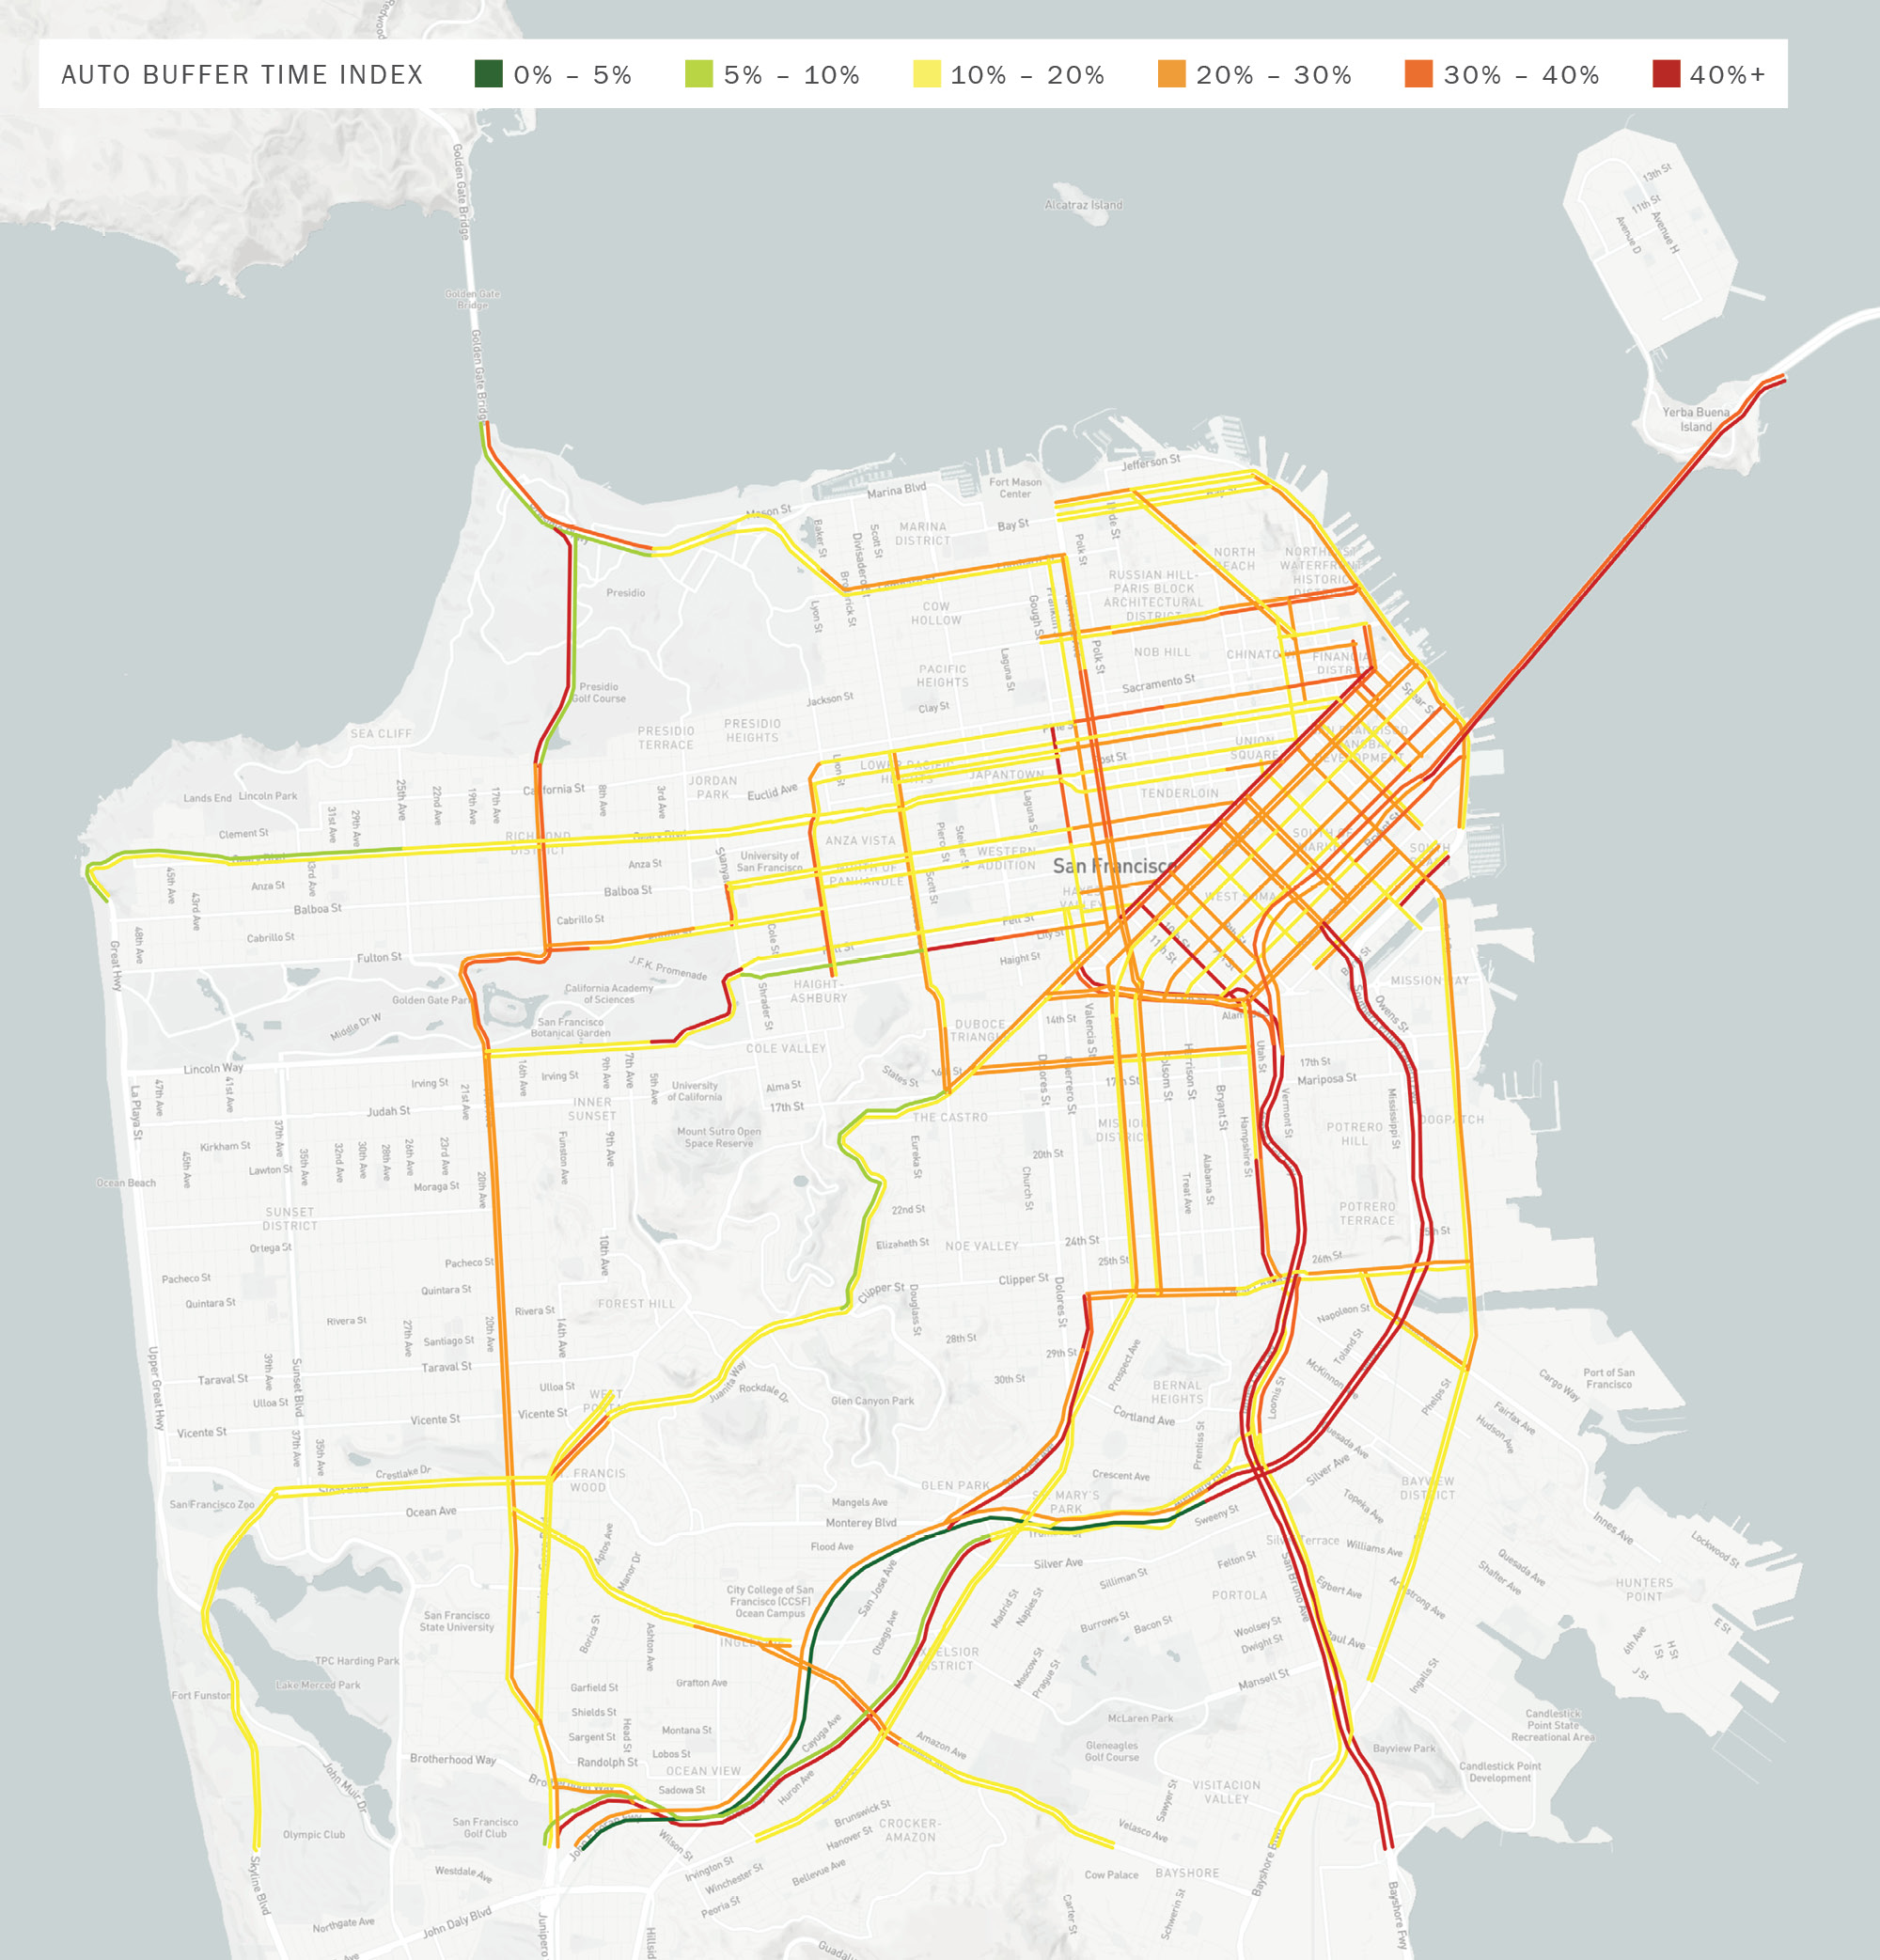
The Buffer Time Index (BTI) is a measure of the unreliability of vehicular travel time, and is calculated as the percent of average additional travel time that the travelers need to budget so that they have a 95% chance of arriving on time. In other words, it is the extra time needed if one does not want to be late more than once a month, and a lower value of BTI indicates higher reliability (see below for a parallel measure for transit travel). For example, a BTI of 20% for a 10 minute trip requires a traveler to budget an extra 2 minutes to not be late more than once a month.
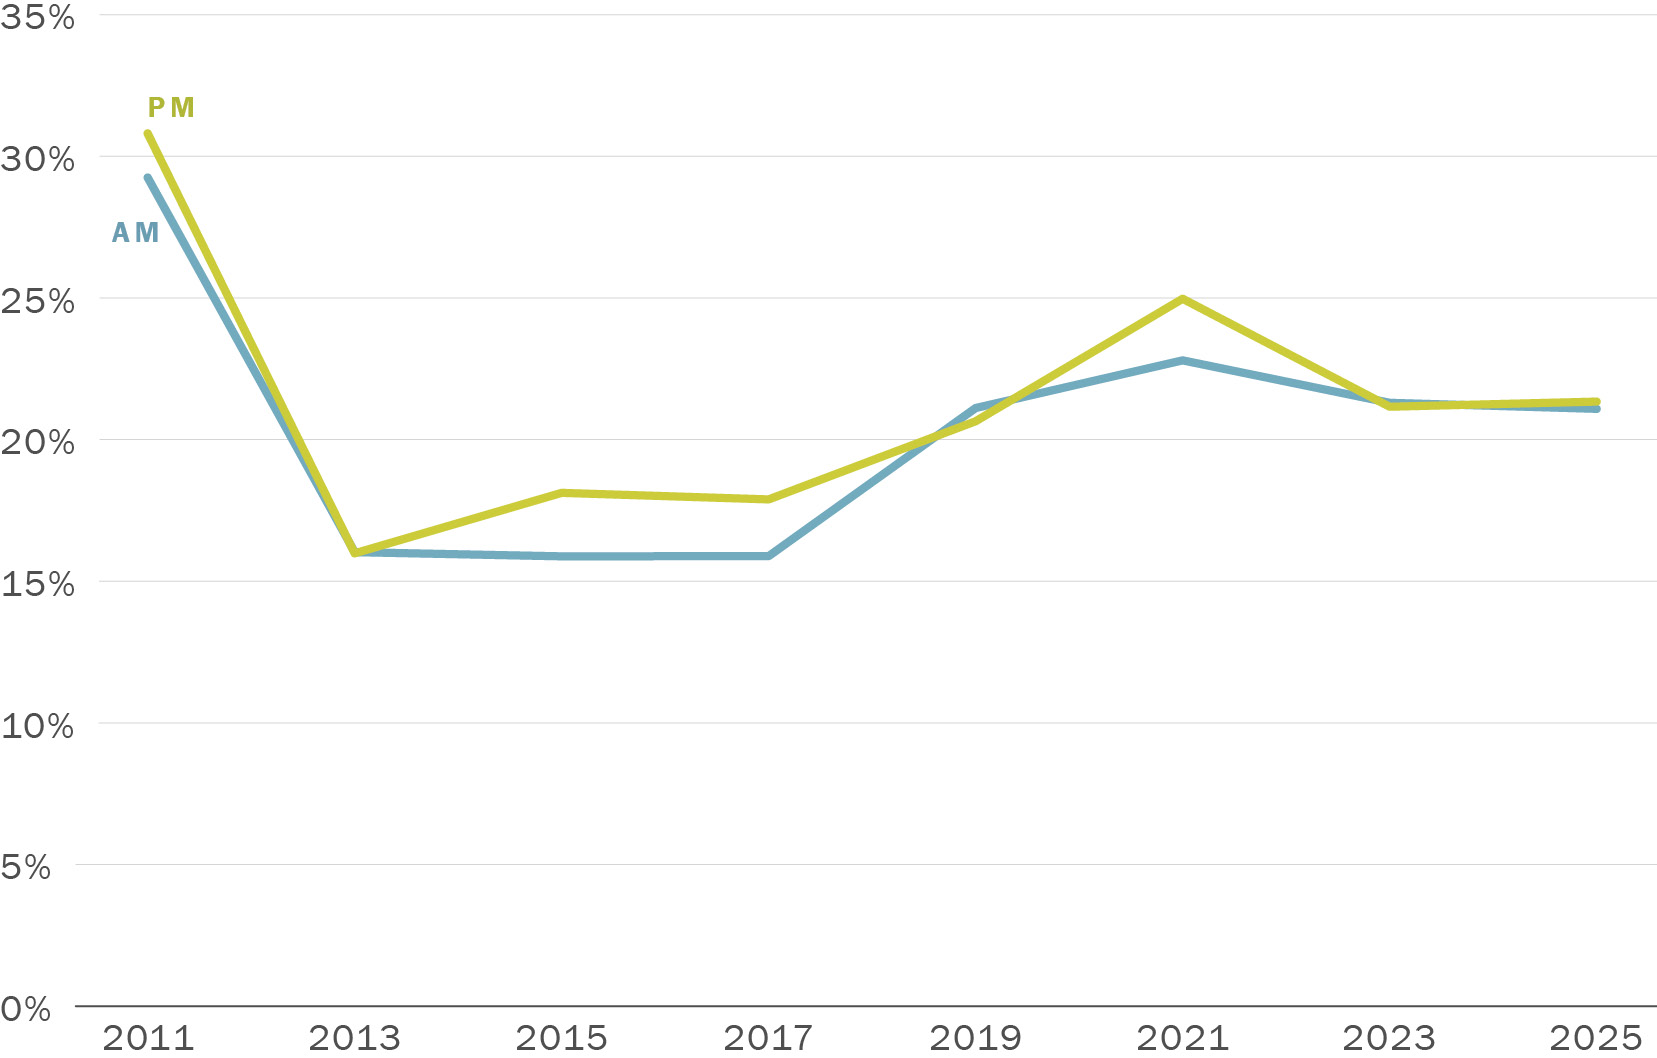
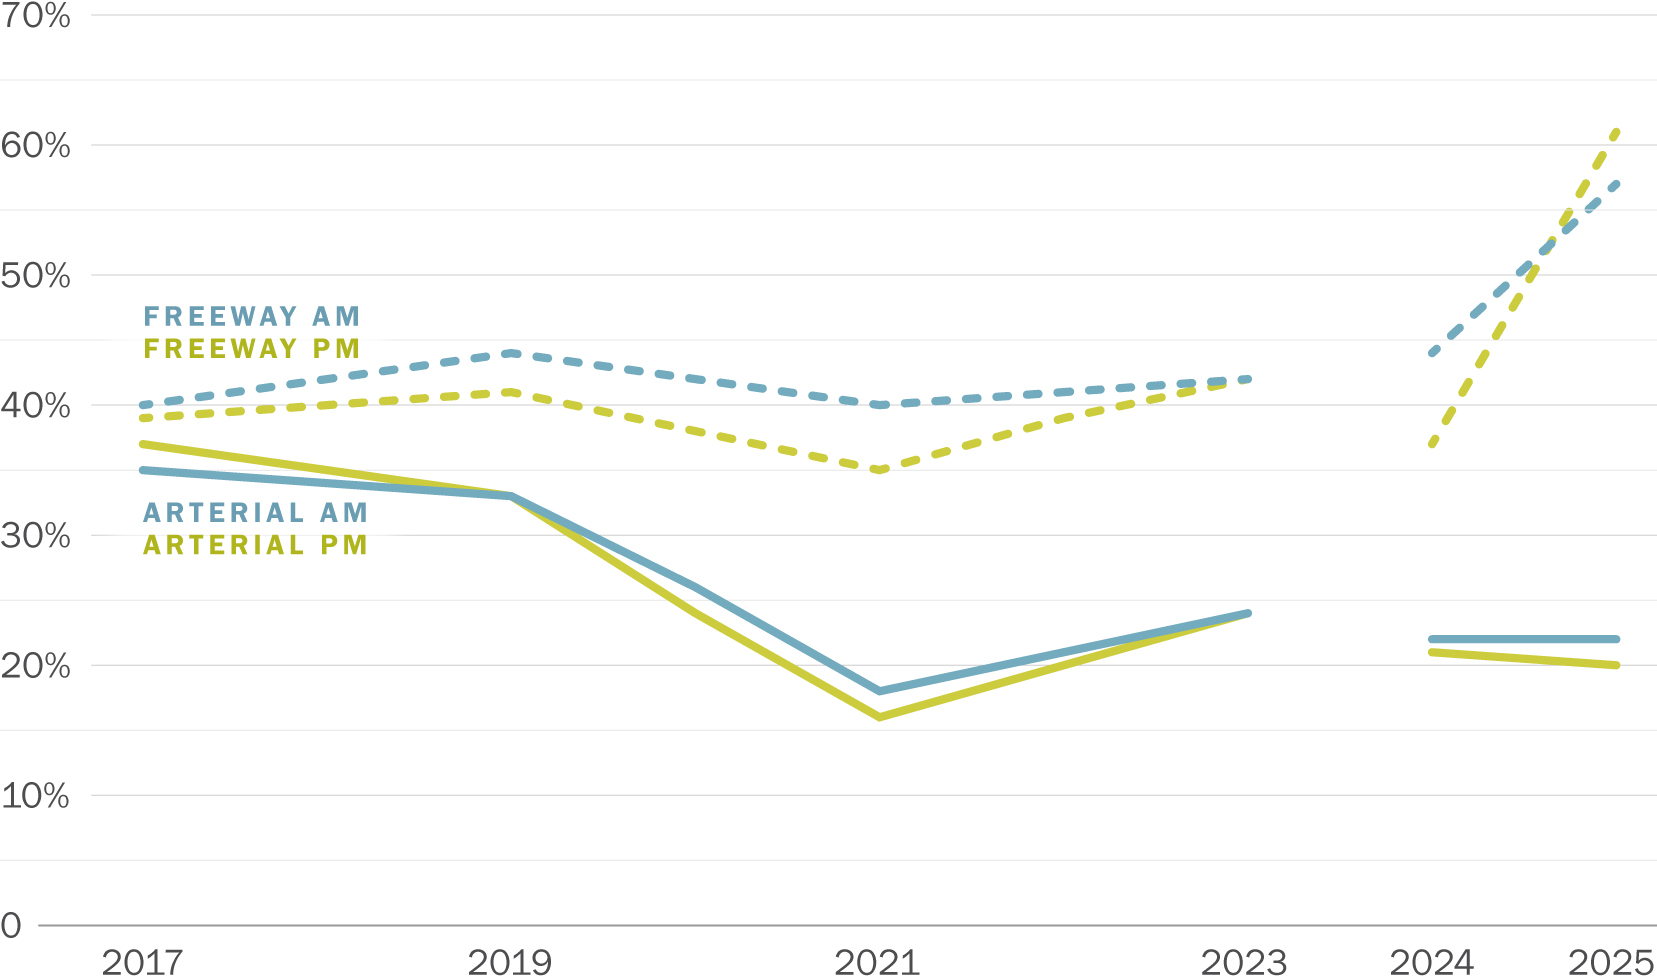
Between 2024 and 2025 reliability remained flat on CMP network arterials, with the BTI remaining at 22% in the AM Peak and decreasing 21% to 20% in the PM Peak (a slight improvement in reliability). In contrast, freeway travel time reliability worsened significantly over the same period from 44% to 57% in the AM Peak and from 37% to 61% in the PM Peak (Figure 0-6), indicating a rising need to manage freeway demand (see San Francisco Freeway Management Study, underway).
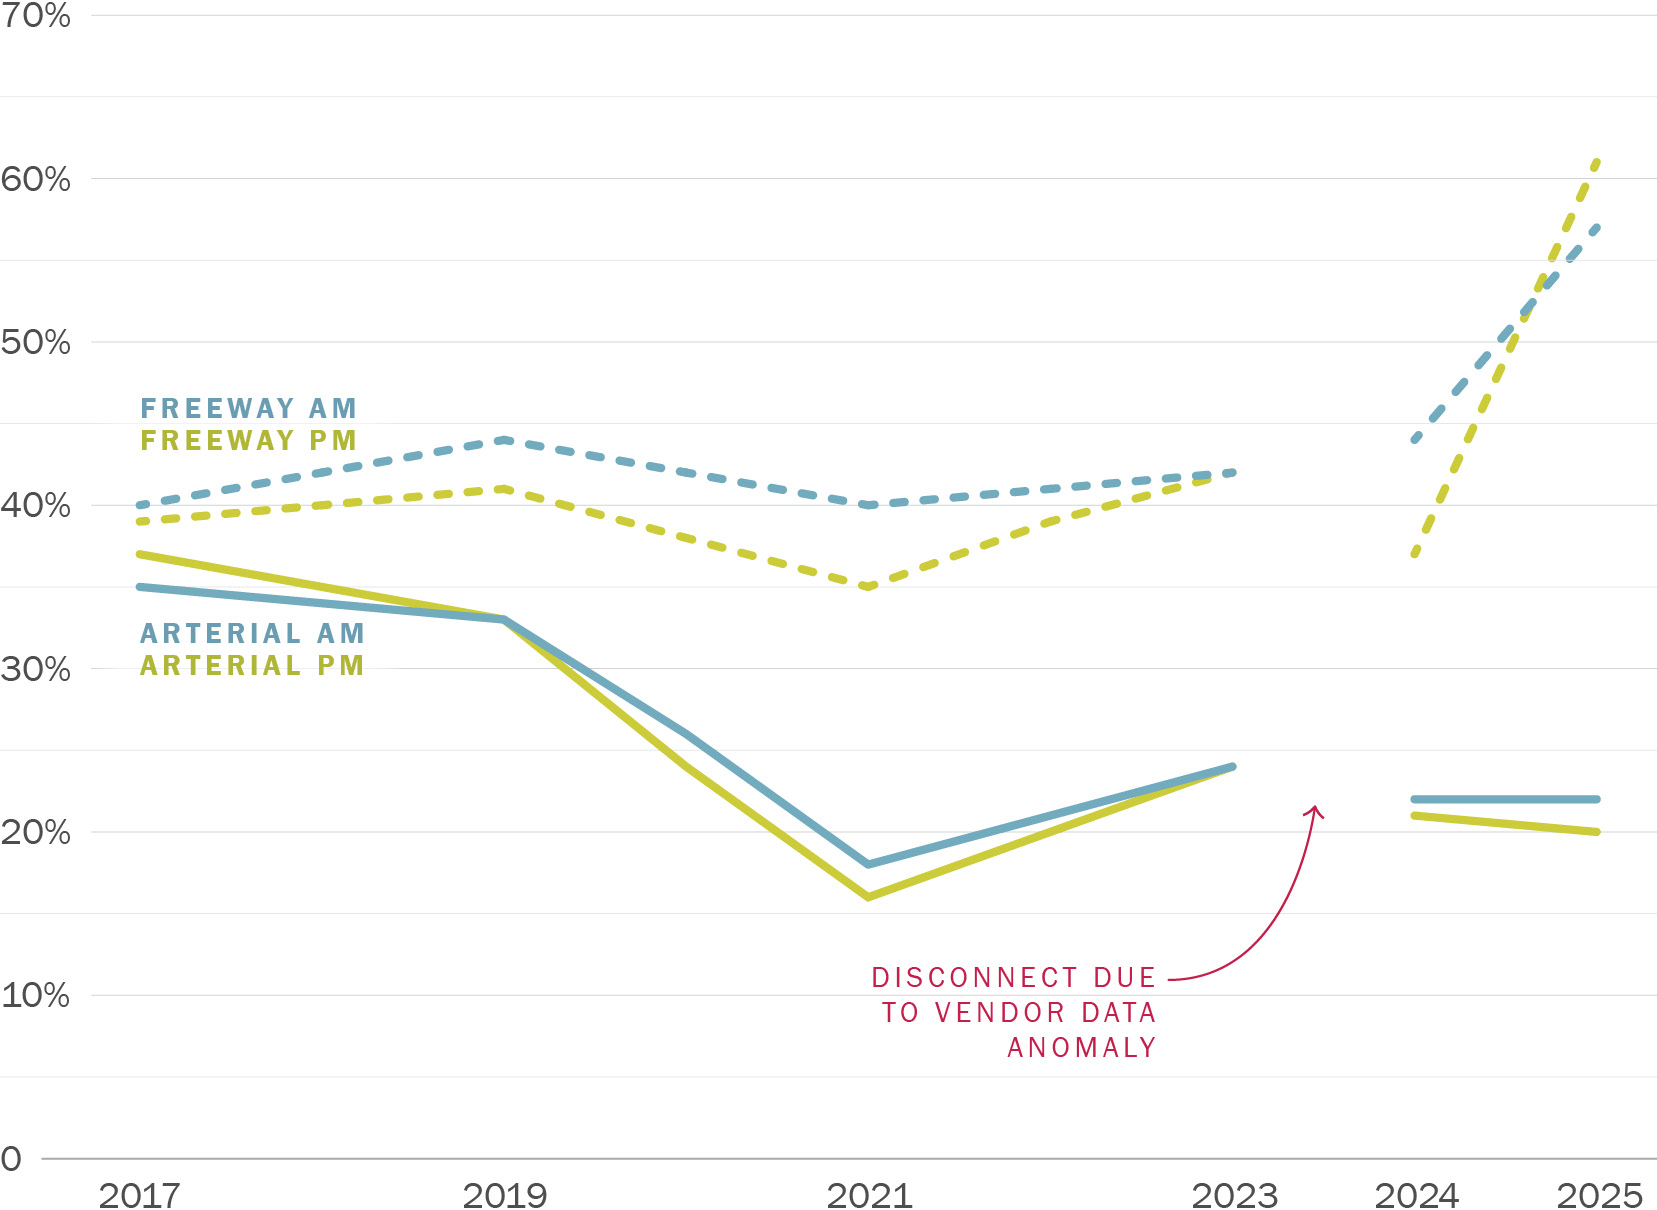
Note: data collected April – May each year
Download chart data (CSV)
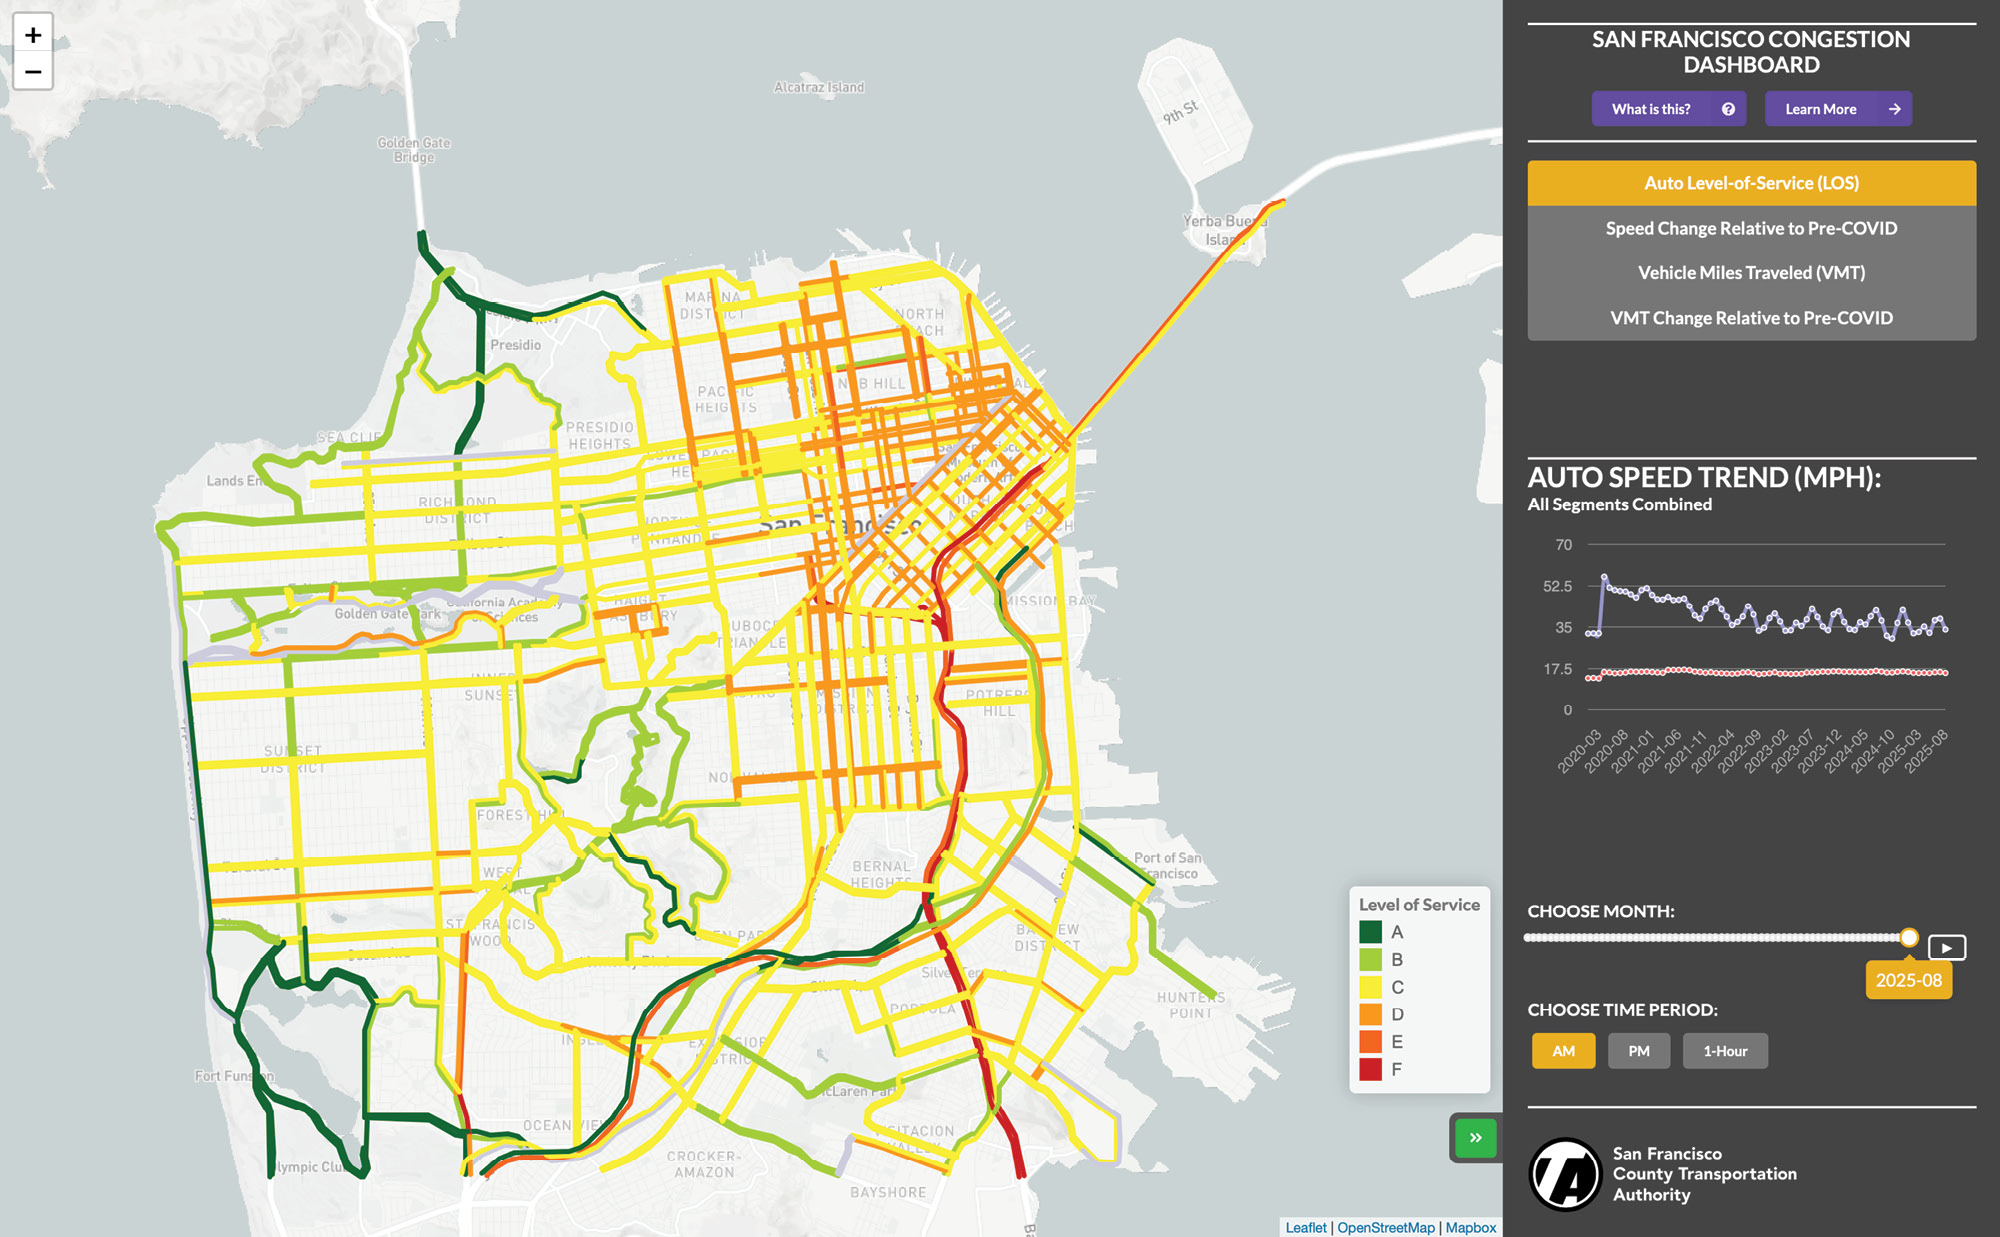
The Transportation Authority maintains the San Francisco Congestion Dashboard (congestion.sfcta.org), shown in Figure 0-7. This tool reports many of the same roadway performance metrics as reported the CMP congestion visualization, but with a much greater frequency (monthly instead of biennially), for a larger set of roadway segments, and at an hourly level as well as for the AM Peak and PM Peak periods starting in January 2020.
Average transit travel speeds on the CMP network for both the AM Peak and PM Peak stayed constant between 2023 and 2025, a positive outcome, given the rise in vehicle traffic and multimodal activity over this period. Transit speeds in 2025 are still higher than that during pre-COVID (Figure 0-8).
Note: Downtown Core in this figure is defined to include streets east of Franklin/Gough Streets, and north of the Central Freeway and Mission Creek. It also includes the streets immediately surrounding the Octavia Boulevard entrance/exit of the Central Freeway
Download chart data (CSV)
Transit (Muni bus) speed information is also used to calculate the coefficient of variation (CV) of speed as a measure of transit speed reliability. The coefficient of variation is calculated by dividing the standard deviation of the speed by the average speed, thereby normalizing the results to compare relative variability between faster and slower segments. The CV is expressed as a percentage of the mean speed. A lower percentage indicates more reliable transit speeds.
Transit reliability has stabilized (i.e. variability stayed the same) since 2023, staying at the same levels (21%) observed in 2019 and 2023 for both the AM Peak and PM Peak (Figure 0-9). With the average transit speeds in 2025 at 9.0 MPH (AM Peak) and 8.1 MPH (PM Peak), a CV of 21% means that approximately 70% of the time, a 3 mile transit trip would take between 15.8 and 24.2 minutes for the AM Peak, and between 17.6 and 26.9 minutes for the PM Peak. As with transit travel times, this is a positive trend and may reflect benefits from a variety of transit priority investments and traffic management strategies that were implemented during this time.
Download chart data (CSV)
In order to assess the competitiveness of transit with driving, the ratio of auto to transit speeds is calculated by comparing auto to transit speeds on the portions of the CMP network for which Muni bus data is available. A ratio of 2 would indicate that, for a particular segment, auto speeds are twice as fast as transit speeds. The ratio had been improving between 2013 and 2019, worsened during the COVID pandemic and has been hovering around 1.7 – 1.8 since 2021. In 2025, the auto-to-transit speed ratio was 1.8 in the AM Peak and PM Peak periods. Due to the Fall 2023 data anomaly, the auto-to-transit speed ratio for 2025 cannot be directly compared to 2023.
The City and County of San Francisco has placed a high priority on supporting walking and cycling/rolling modes (including bicycling, bike share and shuttles) to facilitate active and affordable means of travel. Multimodal counts have been collected at 29 mid-block locations (vehicle only) (Figure 0-10 and Figure 0-11) and 14 intersections (vehicle, bicycle (Figure 0-12), and pedestrian (Figure 0-13) since 2015.
Mid-block mid-week average daily traffic continued to increase between 2023 and 2025 (+4%), reaching 92% of pre-COVID pandemic (2019) levels (Figure 0-10). The 2025 AM Peak and PM Peak mid-block mid-week vehicle counts stand at 88% and 92% of 2019 (pre-COVID pandemic) levels, respectively. The trendlines may also suggest that the ongoing vehicular traffic decrease observed from 2015 to 2019 is continuing past the COVID pandemic.A data error in 2023 midblock traffic counts was discovered that resulted in lower AM Peak period counts. This error is corrected in the 2025 CMP.
Note: Data collected April – May biennially at the same locations, counts shown for the bars are summed over all 29 locations and directions, whereas the white line within each bar only shows counts summed over 28 locations and directions (excluding counts from Van Ness between California and Pine, where no data were collected in 2017).
Download chart data (CSV)
Note: Data collected April – May biennially at the same locations, counts shown for the columns are summed over all 29 locations and directions, whereas the line within each column only shows counts summed over 28 locations and directions (excluding counts from Van Ness between California and Pine, where no data were collected in 2017).
Download chart data (CSV)
Figure 0-12 and Figure 0-13 respectively show bicycle and pedestrian counts collected by SFCTA between 2015 and 2025 throughout the city. In contrast to vehicle counts, bicycle and pedestrian intersection counts show a stronger recovery in the PM Peak than the AM Peak. Bicycle counts showed a particularly strong increase between 2023 and 2025 of +42% for the AM Peak and +36% for the PM Peak. Pedestrian counts saw more modest changes between 2023 and 2025, with AM Peak counts basically unchanged (+0%), and PM Peak counts increasing +8%.
Taken together, travel in the PM Peak (4:30 – 6:30 p.m.) seems to show a slight mode shift from automobiles to bicycles and walking. This shift away from automobiles is not observed in the AM Peak (7:00 – 0 a.m.) however.
Note: Data collected April – May biennially at the same locations, counts shown are summed over all locations.
Download chart data (CSV)
Note: Data collected April – May biennially at the same locations, counts shown are summed over all locations.
Download chart data (CSV)
Safety for road users, including those walking or biking, are key measures of transportation performance, and a critical policy priority for San Francisco. The City and County of San Francisco adopted Vision Zero as a policy in 2014, committing to build better and safer streets, educate the public on traffic safety, enforce traffic laws, and adopt policy changes that save lives. The San Francisco Street Safety Act (July 2025) re-affirmed San Francisco’s commitment to traffic safety and identified specific activities across city agencies to advance the city’s goals.
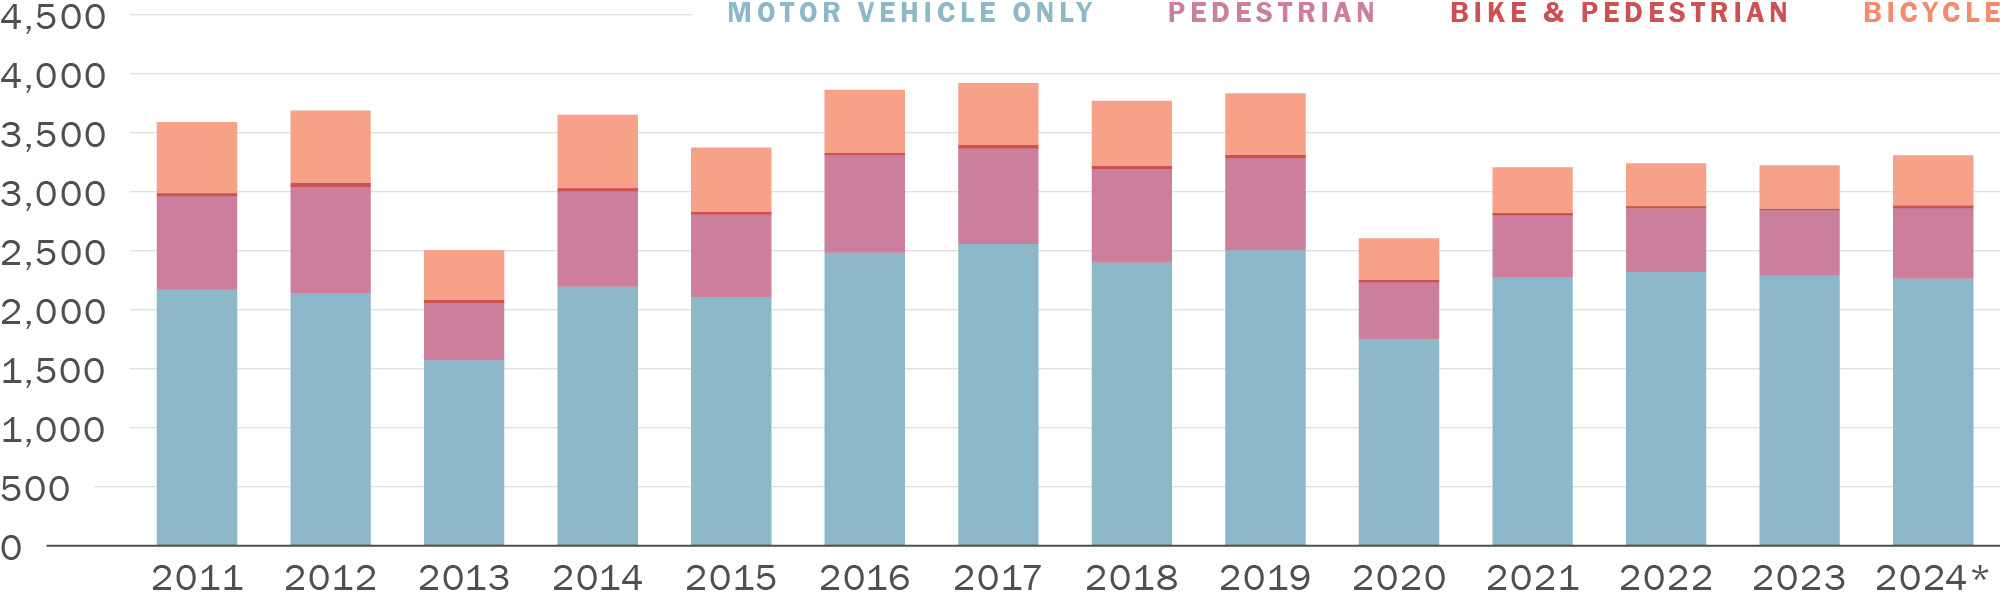
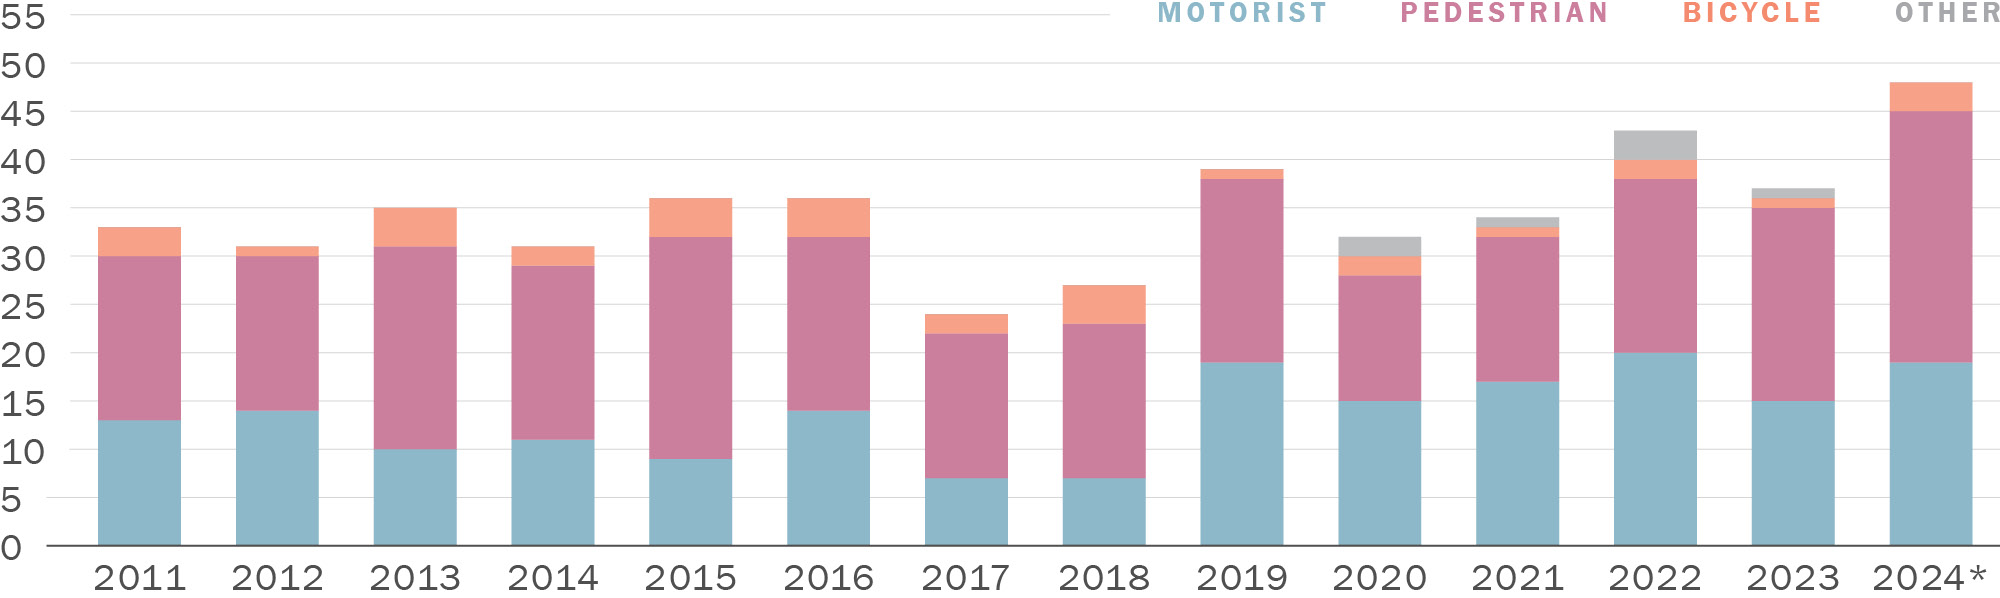
The number of injury collisions (involving people walking or biking) dropped significantly in 2020, probably due to the substantial reduction in vehicle and non-motorized volumes in 2020 due to the COVID pandemic. Speeding remains a top collision factor and concern during this time, among the “Focus on the 5” priorities for SFMTA counter-measure and San Francisco Police Department traffic enforcement efforts. The number of property-damage only (PDO) collisions, non-severe injury collisions, and severe injury collisions have increased from 2020 lows, but remain mostly stable below pre-pandemic highs as of 2024 (Figure 0-14). The total number of fatal collisions in 2024 at 42 (of which 23 and 3 involved people walking and biking, respectively), however, is the highest observed since 2011 (other than 2022 which has the same number of fatal collisions) (Figure 0-15). Total fatalities also increased to their highest level observed since 2011, reaching 48 (Figure 0-16). These totals are higher than those reported through San Francisco’s Vision Zero program, which exclude fatalities that occur on freeways.
* provisional data.
Download chart data (CSV)
* provisional data.
Download chart data (CSV)
* provisional data.
Download chart data (CSV)
Mode share describes the mix of modes, such as transit, biking, walking, and driving used to travel to, from, and within San Francisco. Figure 0-17, Figure 0-18, and Figure 0-19 summarize the share of trips by mode for trips in San Francisco broken down into three different travel markets: all trips to/from/within San Francisco, regional trips to/from San Francisco (trips where one of the trip ends is in San Francisco and the other is not), and trips within San Francisco (trips that both start and end in San Francisco). Driving (alone, sharing a ride, or using a TNC) is the most prevalent mode to both get around within San Francisco (43.9%) and to travel to/from San Francisco (76.3%). For travel within San Francisco, walking is the next most prevalent mode (41.0%). There is also a significant transit share for both travel markets (11.8% for trips within San Francisco, and 21.9% for trips to/from San Francisco).


Download chart data (CSV)
In 2016, the San Francisco Planning Commission adopted new guidelines for evaluating the transportation impacts of new projects. Critically, environmental impact determinations locally and statewide are now based on vehicle miles traveled (VMT) rather than additional automobile delay as measured by level-of-service (LOS). VMT decreased by 20 – 30% in the first 1.5 years of the COVID pandemic. As of 2025, VMT is hovering at around 10% below pre-COVID levels (Figure 0-20).
Source: The Transportation Authority, based on INRIX automobile speed data
Download chart data (CSV)
San Francisco’s strong backbone of local and regional transit has been key to our ability to manage congestion. Muni, BART, Caltrain, and commuter bus lines help move people into, out of, and around the city efficiently. Figure 0-21 shows recent ridership trends for the three largest transit systems serving San Francisco. Muni carries the greatest number of trips in San Francisco, with over 500,000 trips on a typical April – May weekday in 2025. Ridership on all three operators declined significantly with the spread of COVID in 2020. Since then, ridership has been gradually increasing every year, but in Apr – May 2025 ridership is still lower than pre-COVID pandemic levels, with Muni, BART, and Caltrain at 72%, 44%, and 54% of 2019 (pre-COVID pandemic) ridership respectively. As of October 2025 (for Muni and Caltrain) and June 2025 (for BART), ridership has further recovered to 82%, 48%, and 62% of pre-pandemic ridership for Muni, BART, and Caltrain, respectively.

Source: SFMTA/BART/Caltrain
Note: data collected April – May each year except for Caltrain it is February
Download chart data (CSV)
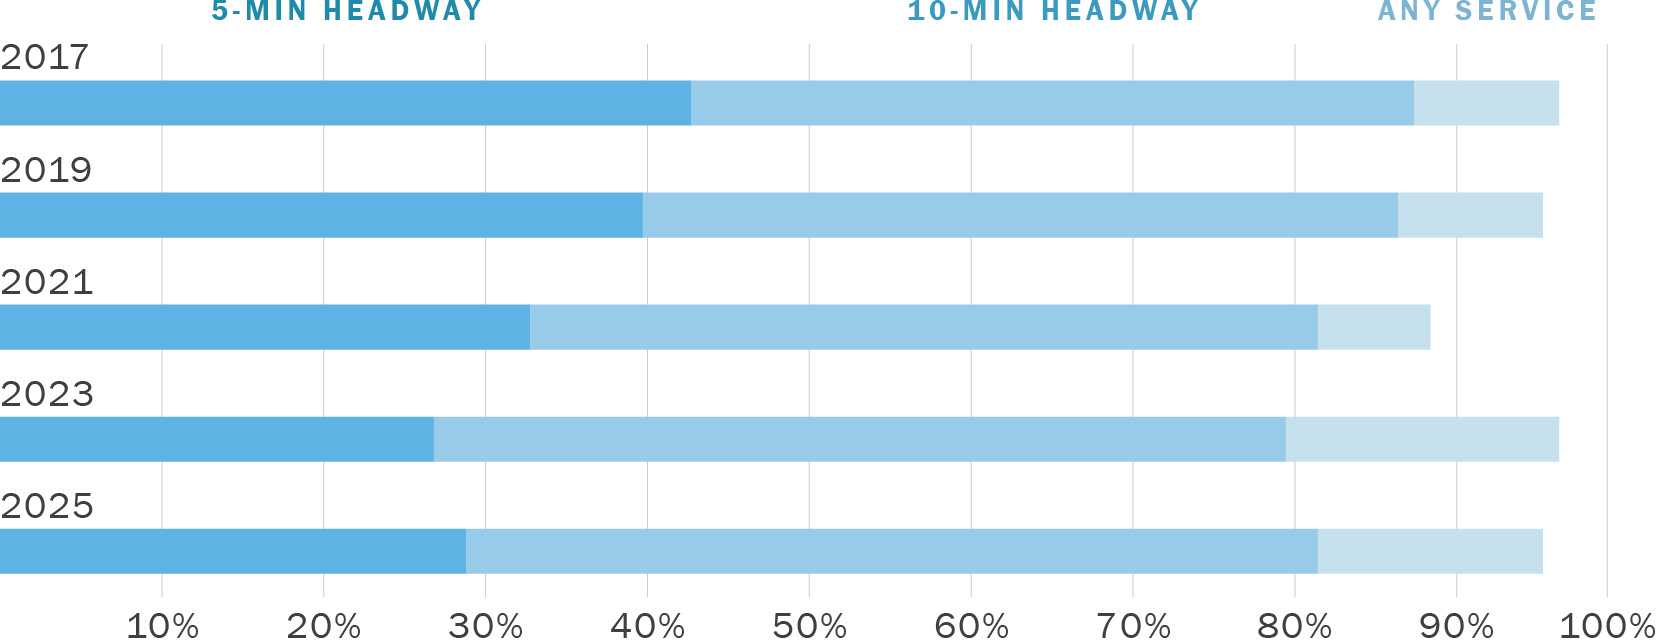
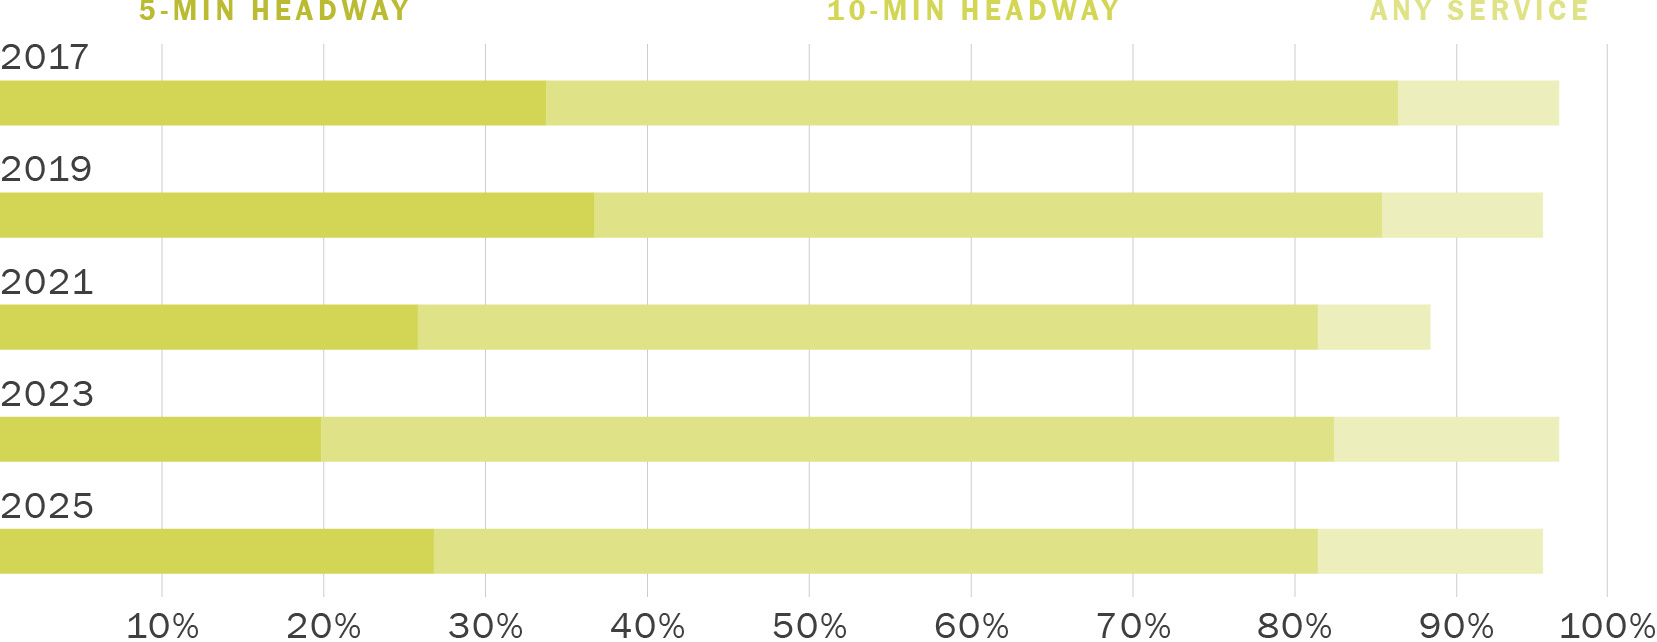
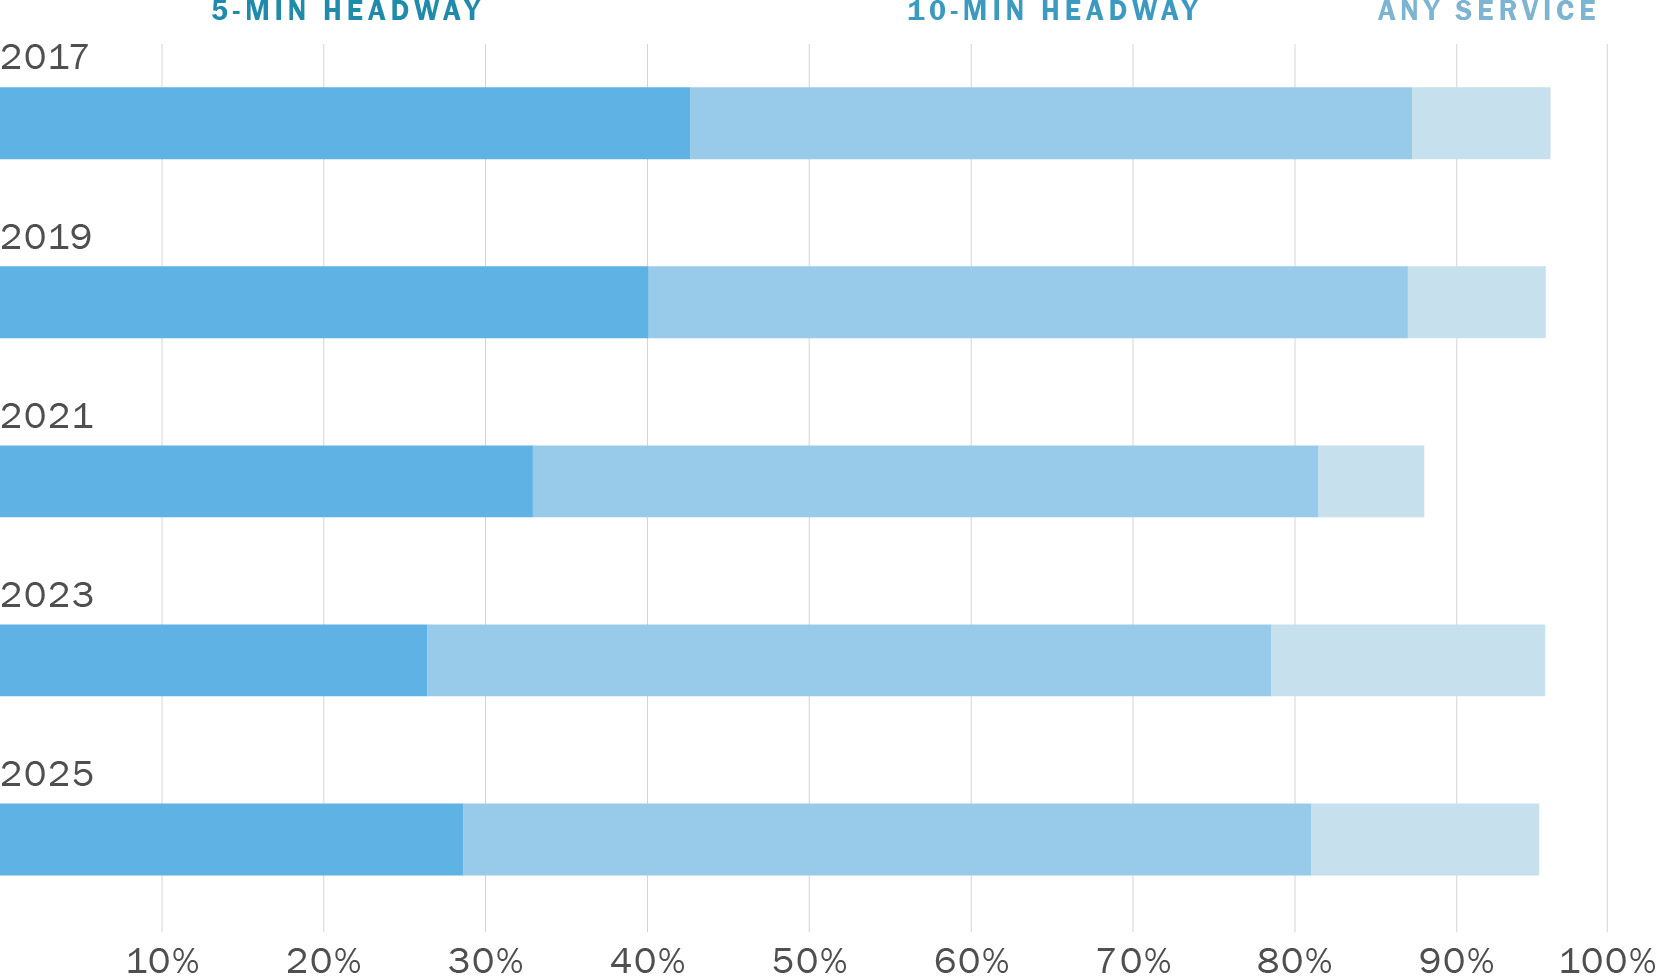
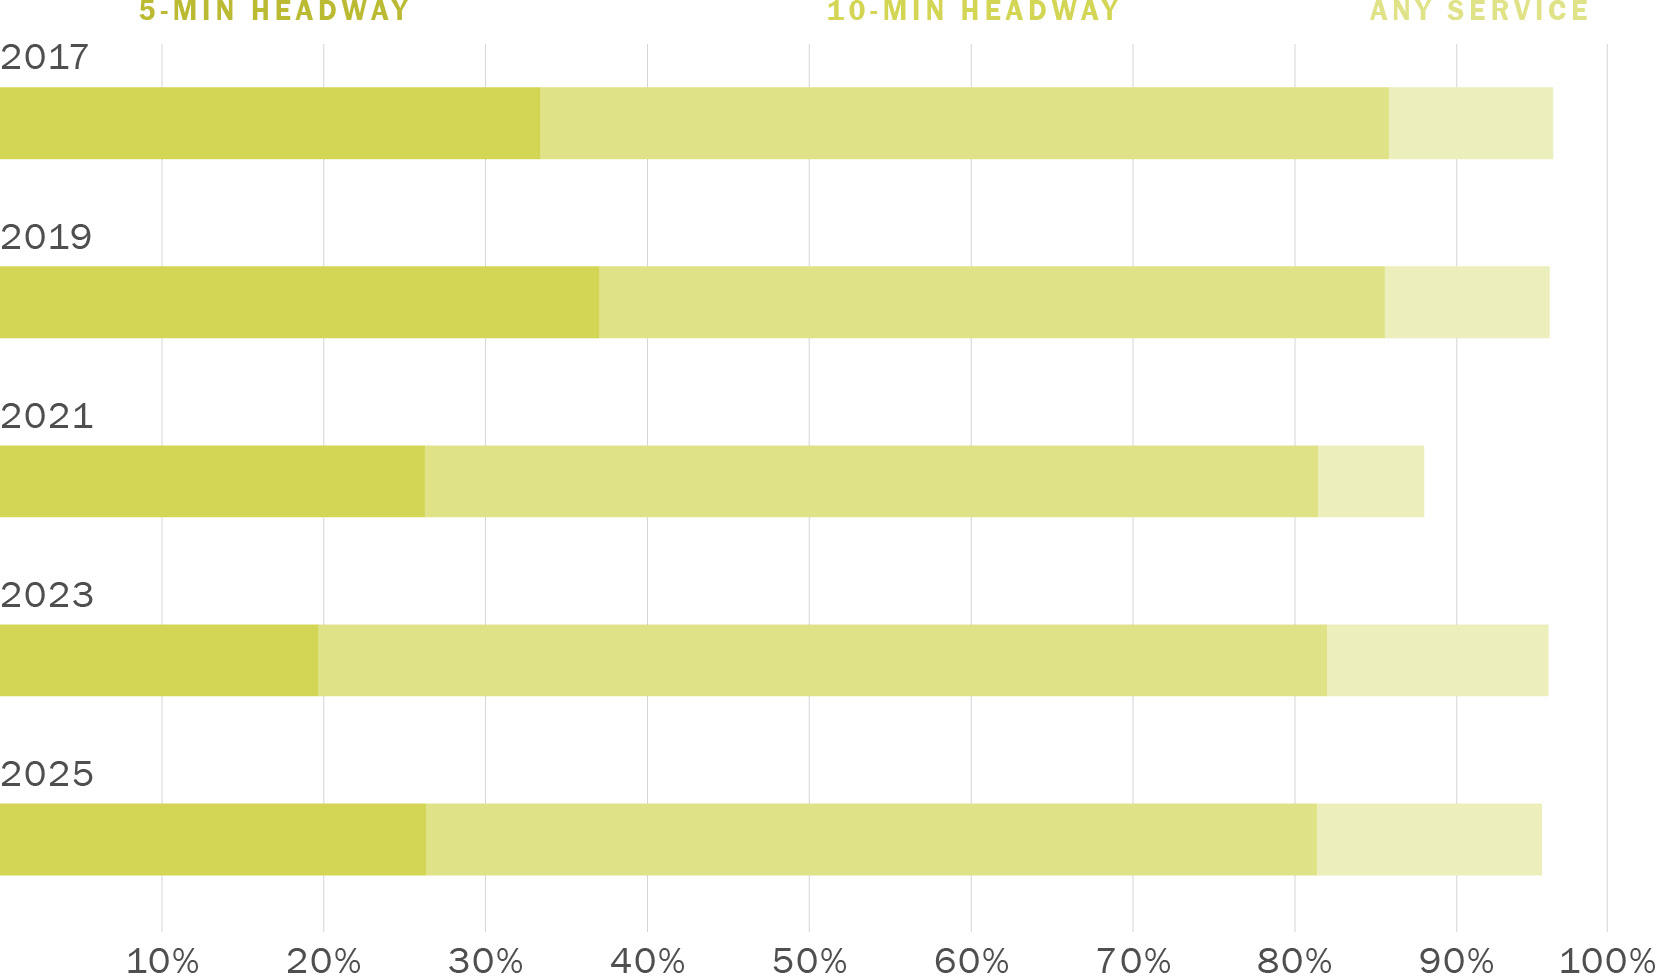
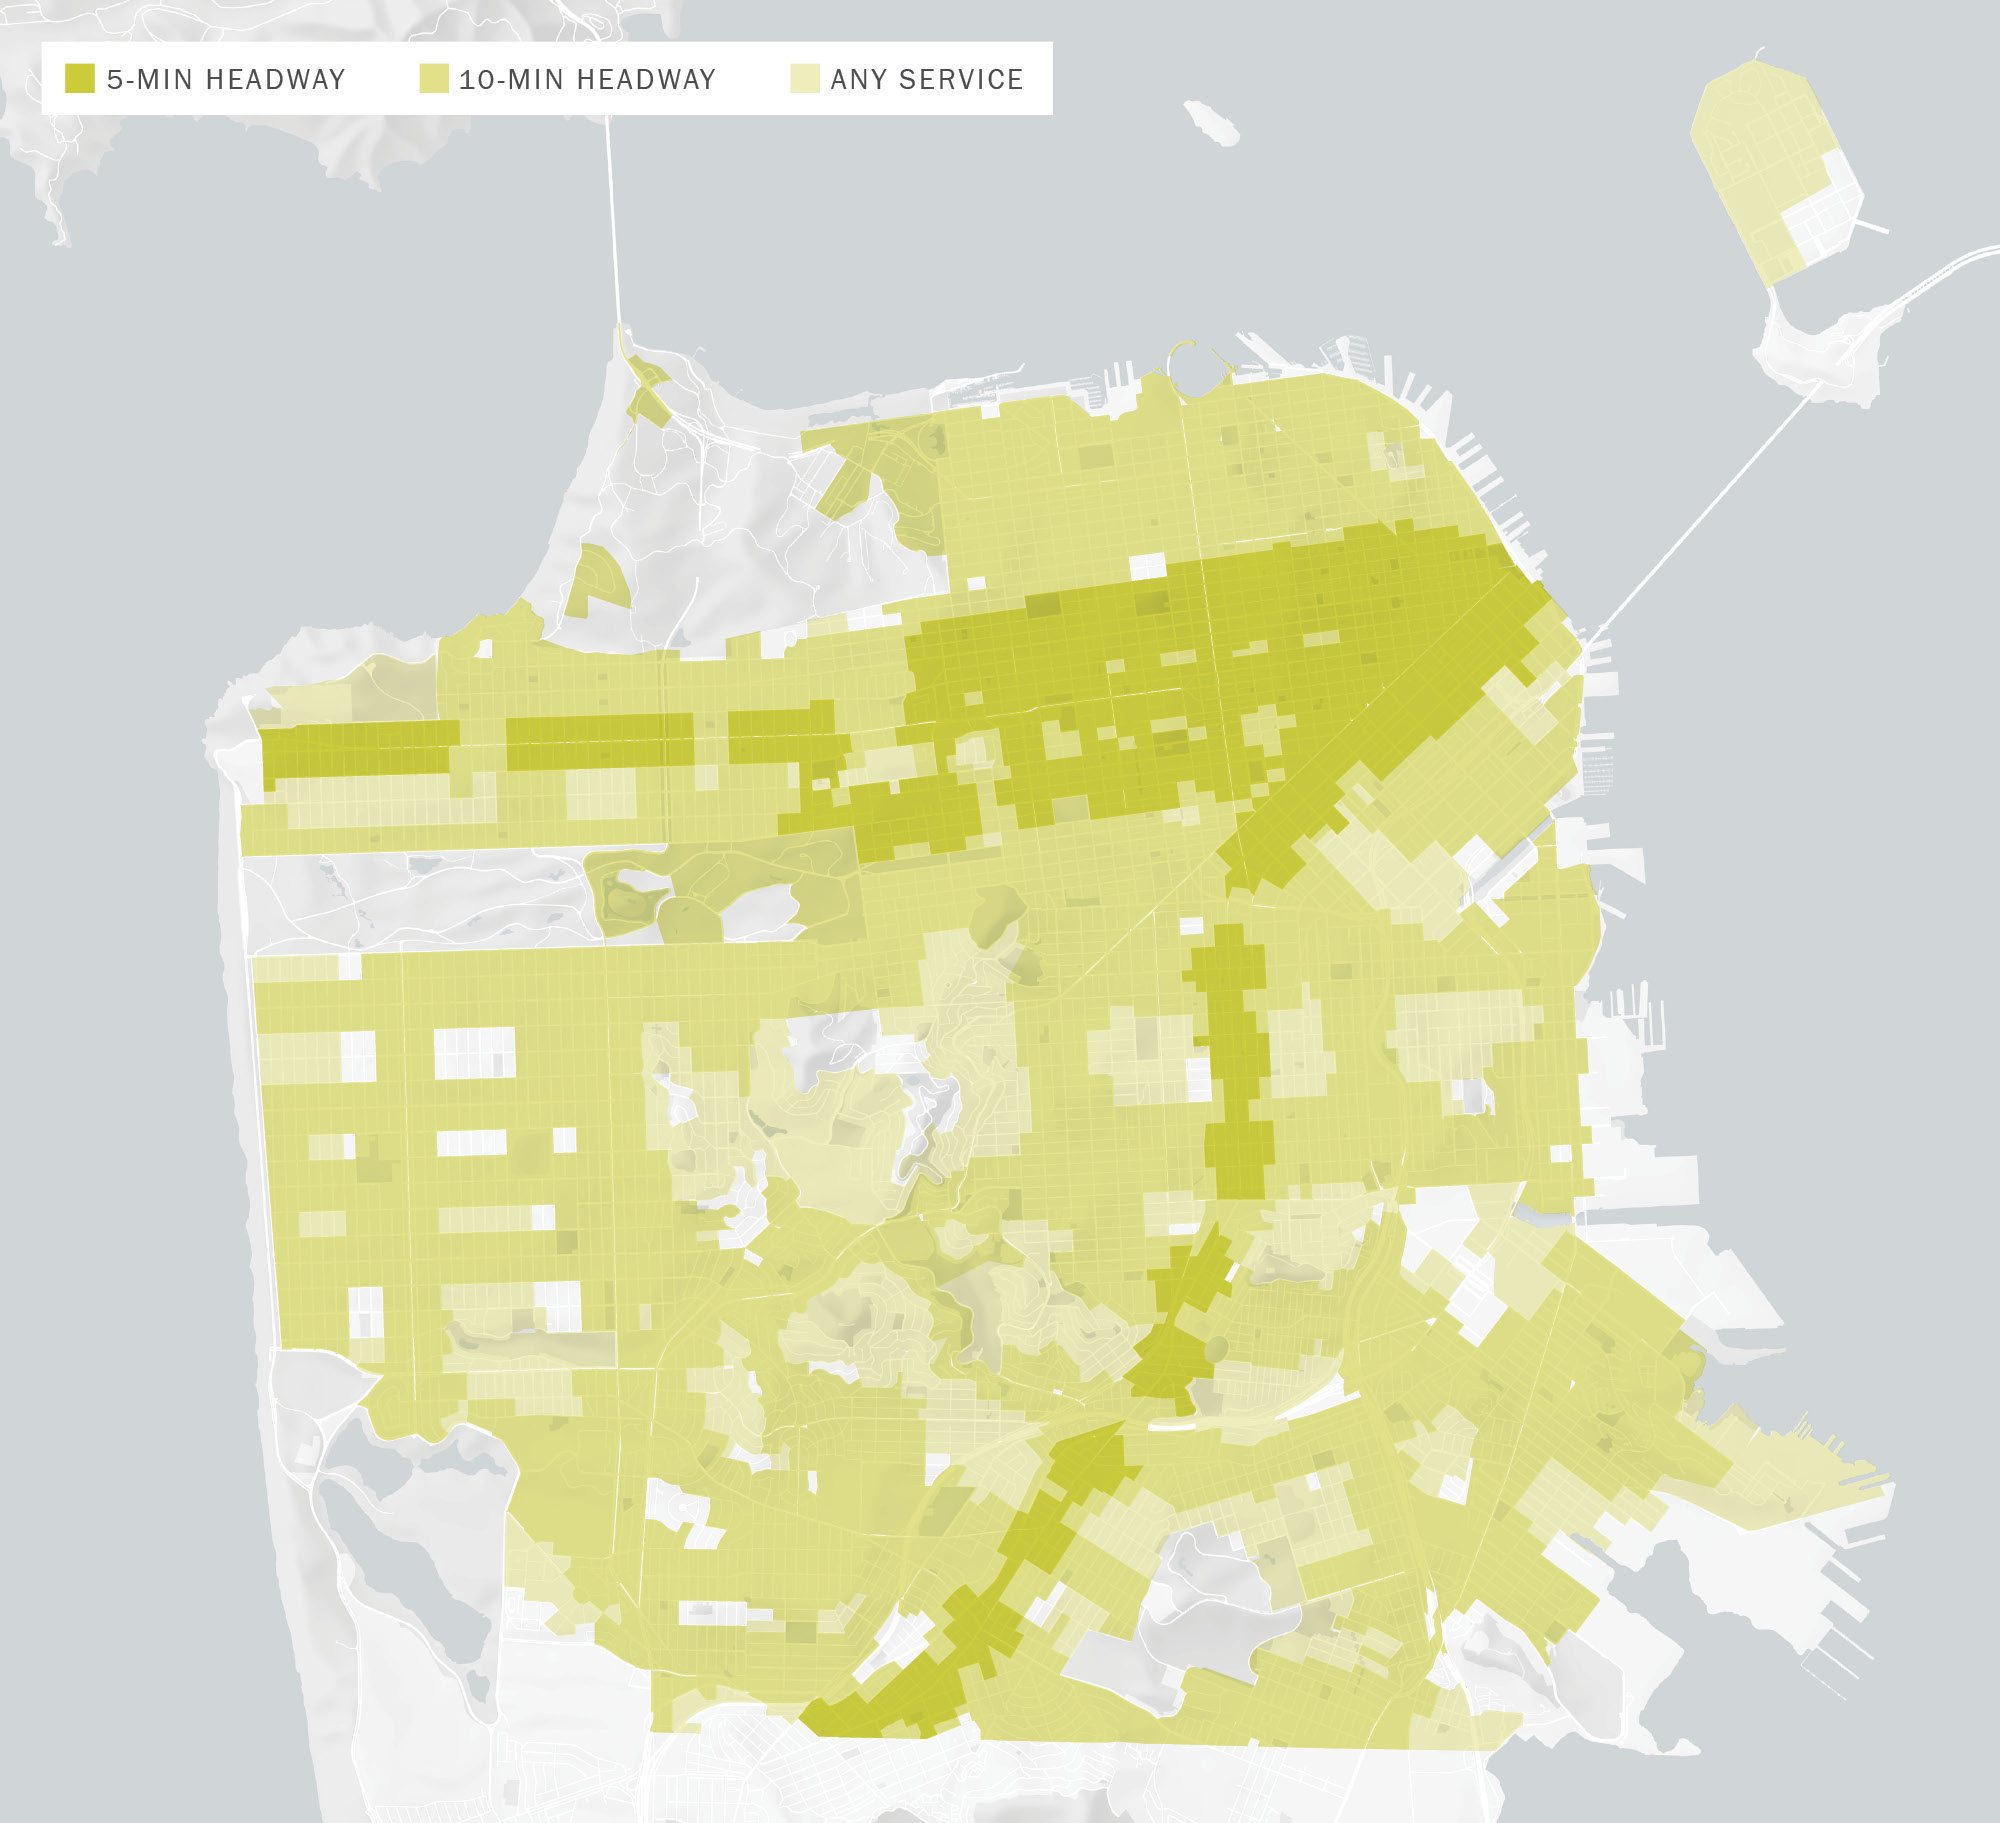
The transit coverage metric reports the percent of San Francisco’s total population and total jobs that are within a five-minute walk of Muni transit service. Since 2023, more than 95% of San Francisco residents live within a five-minute walk of Muni service. Moreover, the share of the population within a five-minute walk of a Muni route with a five-minute headway increased from 27% in 2023 to 29% in 2025 for the AM Peak and from 20% in 2023 to 27% in 2025 for the PM Peak, though this is still lower than the pre-COVID population share within a five-minute walk of a Muni route with a five-minute headway (Figure 0-22 and Figure 0-23). Transit coverage in terms of jobs for both the AM Peak and PM Peak periods show trends similar to those observed in population transit coverage.
Download chart data (CSV)
Download chart data (CSV)
The Transportation Authority is analyzing current conditions and conducting long-range planning to manage congestion. The Downtown Travel Study analyzed post-COVID residential travel trends (March 2025) and the countywide transportation plan update is occurring through the San Francisco Transportation Plan 2050+ study process. Planning, funding, project delivery and policy research efforts are described further below:
The San Francisco Transportation Plan 2050 (SFTP2050) recommends TDM to maximize our countywide infrastructure investment priorities and to reduce congestion by shifting more trips from driving alone to walking, bicycling/rolling, transit, or carpooling. TDM may include policies, low-cost capital improvements, regulations (e.g., requirements on new development), and programs (e.g., information/outreach) designed to facilitate the use of sustainable transportation options.
San Francisco has identified a travel demand management (TDM) policy framework, strategy, and programs to systematically shift how, when, and where people travel, as documented in the 2017 San Francisco TDM Strategy. The Transportation Authority, in partnership with SFMTA and other local and regional agencies involved in TDM, is revising the 2017 TDM Strategy for the post-COVID era. This revision will build off of the Travel Demand Management (TDM) Market Analysis project that SFCTA is currently leading.
As the Treasure Island Mobility Management Agency, the Transportation Authority is leading a comprehensive mobility management program that encompasses new transit service and robust transportation demand management programs. Furthermore, San Francisco is encouraging efficient land use planning by supporting development at higher densities in areas that are mixed-use (closer to jobs and retail) and are well served by transit. Plan Bay Area 2050 identifies Priority Development Areas (PDAs) where densities and transit levels can more readily support transit-oriented development.
From 2016 – 2022, Connect SF was a multiagency collaborative process to build an effective, safe, equitable, and sustainable transportation system for San Francisco’s future. ConnectSF developed a long-range vision for 2065 that serves as the underpinning of Plan Bay Area 2050+ and SFTP 2050+. The Transportation Authority is also coordinating with numerous local, regional state and Federal agencies and with the private sector to address congestion. Key initiatives include:
The Transportation Authority is addressing near- and long-term transportation needs for San Francisco by funding projects and programs — mainly capital infrastructure, through grant programs such as the Proposition L transportation sales tax, Proposition AA vehicle registration fee, Prop D Traffic Congestion Mitigation Tax (TNC Tax), Transportation Fund for Clean Air, and One Bay Area Grants (OBAG) programs, as well as coordinating with other local and regional agencies to apply for State and Federal funding to match local investments. Below are a few signature projects supported with Transportation Authority funds:
The Transportation Authority is also overseeing and leading the delivery of key projects, many of which support infill transit-oriented development, including serving as co-sponsor or lead agency for the construction of:
While the CMP’s focus is primarily on monitoring multimodal system performance and managing current congestion, the City must also plan for future system performance and congestion. San Francisco is a dense urban environment, and a critical challenge is how we manage our limited public right-of-way in order to maximize the movement of people and goods. While technologies such as web conferencing enabled increased levels of working from home which may help reduce peak period congestion, other emerging technologies and mobility services may lead to increased congestion.
Over the past few years, the California Department of Motor Vehicles (DMV) and the California Public Utilities Commission (CPUC) have approved numerous permits for autonomous vehicles (AVs) to operate on San Francisco roadways, culminating in an August 2023 decision by the CPUC to allow two AV companies (Waymo and Cruise) to offer fared ride hailing services at all times of day across the entire City, with no limits on fleet size, not unlike the ride hailing services provided by Transportation Network Companies (TNCs) such as Uber and Lyft. Prior work by the Transportation Authority documented that ride hailing was responsible for approximately 50% of the increase in congestion between 2010 and 2016. As AVs scale up and become more widely deployed, it is reasonable to expect that AV ridehail services may similarly be generating vehicle miles traveled on San Francisco’s roadways and contributing to congestion in San Francisco.
The Transportation Authority, in coordination with other San Francisco agencies, have identified the need for the CPUC to move towards a performance-based incremental permitting of AVs. Such performance-based regulation, as well as the Transportation Authority’s responsibility to monitor transportation system performance and the potential impact of TNCs and AVs on congestion and other performance metrics such as safety, requires that agencies such as the CPUC and the Transportation Authority have access to useful, timely, reliable, and unredacted data. Unfortunately, at present, the data reported to the DMV and CPUC under a variety of testing, pilot, deployment, drivered and driverless permits is too incomplete, inconsistent, and redacted to provide policy-makers with the knowledge they need to make informed decisions. Without reliable data, it is challenging to facilitate safe, equitable, and sustainable integration of AVs into the City’s transportation ecosystem.
The City and County of San Francisco adopted Vision Zero as a policy in 2014, committing to build better and safer streets, educate the public on traffic safety, enforce traffic laws, and adopt policy changes that save lives. The goal is to eliminate traffic fatalities and to create a culture that prioritizes traffic safety. In July 2025, the San Francisco Board of Supervisors passed the San Francisco Street Safety Act, re-affirming the city’s commitments and describing a shared work program toward achievement of city goals. The Transportation Authority and the Controller’s Office were charged with monitoring these actions and assessing progress on an annual basis.
A significant portion of San Francisco’s arterial CMP network overlaps with its Vision Zero High Injury Network. In 2025, the Board of Supervisors adopted the San Francisco Street Safety Act, directing a multiagency coordinated approach to ending severe and fatal traffic crashes. The act directs agencies to pursue strategies to identify and implement infrastructure improvements, improve traffic enforcement, pursue electronic enforcement technologies like red light and speed cameras, establish procedures to implement solutions more efficiently, and prioritize solutions where they are needed most.
The Transportation Authority advances safety by:
KEY TOPICS
As the Congestion Management Agency (CMA) for San Francisco, the San Francisco County Transportation Authority (the Transportation Authority) is responsible for preparing a Congestion Management Program (CMP) update biennially. As mandated by state law, the purposes of the CMP are to:
This document follows MTC’s Guidance for Consistency of Congestion Management Programs with the Regional Transportation Plan, per MTC Resolution 3000.
Each element required by the CMP legislation is discussed in a separate chapter. Each chapter describes the element’s context in San Francisco, the work plan, and implementation guidance. The Transportation Authority Board will adopt any revisions developed during the two upcoming fiscal years as amendments to the current cycle San Francisco CMP.
In preparing the CMP update, the Transportation Authority has consulted with the San Francisco Municipal Transportation Agency (SFMTA) and other partner agencies to update policies and compile system performance data.
CMP requirements were established in 1989 as part of a bi-partisan state legislative package, known as the Katz-Kopp-Baker-Campbell Transportation Blueprint for the Twenty-First Century (AB 471). These requirements became effective when voters approved Proposition 111 on June 5, 1990. AB 1963 (Katz) in September 1994 and AB 2419 (Bowler) in July 1996 further modified CMP law. The passage of AB 298 (Rainey), effective January 1, 1997, made the CMP exempt from the California Environmental Quality Act (CEQA). SB 1636 (Figueroa 2002) amended CMP requirements to allow local jurisdictions to designate Infill Opportunity Zones (IOZs). SB 743 (Steinberg 2013) further revises the definition of “IOZ” to generally encompass a larger area than that allowed in SB 1636.
The 1989 state legislation directs the regional agency (MTC) to not program any surface transportation program funds and congestion mitigation and air quality funds for a project in a local jurisdiction that has been found to be in nonconformance with a congestion management program unless the project is found to be of regional significance. The goal of the legislation is to strengthen and coordinate local transportation funding and land use decisions by requiring preparation of long-range countywide transportation every four years, and monitoring of local transportation conditions every two years.
The CMP legislation aims to increase the productivity of existing transportation infrastructure and encourage more efficient use of scarce new dollars for transportation investments, in order to effectively manage congestion, improve air quality, and ultimately allow continued development. To achieve this, the CMP law is based on five mandates:
The Congestion Management Program is prepared pursuant to the requirements in California Government Code section 65088 – 65089.10. One of the main objectives of the CMP legislation is to foster coordination of local land use and transportation investment decisions at the county or subregional level. To ensure local involvement in this process the CMP law vests significant authority and responsibility in the Congestion Management Agencies (CMAs). CMAs therefore act as a policy forum and technical resource to guide and help coordinate local and regional congestion management efforts.
By statute, congestion management agencies must report on the roadway level of service (LOS) for its countywide network of regionally significant streets and highways (the Metropolitan Transportation System) outside of an infill opportunity zone (IOZ). However, SB 1636 enabled congestion management agencies to consider alternative metrics to LOS for measuring and mitigating roadway congestion within IOZs. To better align San Francisco’s CMP with its longstanding Transit First policy, San Francisco designated an IOZ in 2009 and, pursuant to SB 743 which expanded IOZ criteria, expanded the IOZ designation in 2024. Also pursuant to SB743, in 2016, the San Francisco Planning Commission formally replaced LOS with Vehicle Miles Traveled (VMT) as San Francisco’s measure of local traffic impacts under CEQA.
The following statutory requirements of CMP legislation are mandated for all urban counties in the state:
The following sections highlight the most significant updates included in the 2025 CMP.
Infill Opportunity Zone (IOZ) update: The Board of Supervisors passed a resolution in September 2024 updating the area designated as an IOZ in San Francisco to an area that is on the whole larger than the previously designated (in 2009) IOZ. This IOZ update is reflected throughout the report.
The Draft 2025 San Francisco CMP has undergone public review at the November 19, 2025 meeting of the Transportation Authority’s Citizens Advisory Committee. The Transportation Authority Board also approved the 2025 CMP on December 9 and 16, 2025.
KEY TOPICS
On November 6, 1990, the Board of Supervisors designated the San Francisco County Transportation Authority (the Transportation Authority) as the CMA for the County. The Transportation Authority Board of Commissioners consists of the eleven members of the San Francisco Board of Supervisors, acting as Transportation Authority Commissioners.
The Transportation Authority is a special-purpose government agency, created on November 7, 1989, when San Francisco voters passed Proposition B. Proposition B increased the local sales tax by ½ cent for a period of 20 years, to fund San Francisco transportation projects and services. Prop B was superseded by Prop K in 2003, which is in turn superseded by Prop L in 2022, which extends the ½ cent sales tax for 30 years. The Transportation Authority administers, prioritizes, and programs Proposition L revenues. These revenues also leverage large amounts of State and Federal funds for transportation investments in San Francisco.
On November 2, 2010 San Francisco voters approved Proposition AA, authorizing collection of an additional $10 fee annually on motor vehicles registered in San Francisco and approving an Expenditure Plan for the new funds. The fee funds local street repair, improvements to pedestrian and bicycle conditions, and public transit enhancements. As with Prop L, the Transportation Authority administers, prioritizes, and programs Prop AA funds.
The Proposition D Traffic Congestion Mitigation Tax was passed by San Francisco voters in November 2019. The measure is a surcharge on commercial ride-hail trips, including those provided by autonomous vehicles, that originate in San Francisco, for the portion of the trip within the city. The TNC Tax program seeks to mitigate the effects of increased congestion due to ride-hail trips by directing funds to deliver improvements to transit reliability and safety on San Francisco’s roadways.
In its capacity as the CMA for San Francisco, the Transportation Authority has primary responsibilities in the following areas:
The Transportation Authority’s dual responsibilities — administering the local half-cent transportation sales tax and prioritizing and programming of State and Federal funds through the CMP and SFTP process — are an opportunity to coordinate San Francisco’s transportation planning decisions and optimize the City’s investments in transportation infrastructure and services. The SFTP links transportation objectives and policies to a specific list of transportation investments, prioritized across a long-range planning horizon. The CMP’s seven-year CIP and the Transportation Authority’s Prop L Five-Year Prioritization Programs serve as the main implementation tools for the San Francisco Transportation Plan.
As the CMA, the Transportation Authority serves as the lead coordinator for San Francisco involvement in the regional process to develop a Sustainable Communities Strategy (SCS) and update the Regional Transportation Plan (RTP). Plan Bay Area 2050, which integrates the SCS and RTP into a single regional plan, was recently updated and adopted by MTC and ABAG in October 2021 and amended in November 2024. As required by SB 375 (Steinberg), passed in 2008, Plan Bay Area integrates long-range land use, housing, and transportation planning in the region to reduce greenhouse gas emissions from motor vehicles. An update to the plan, Plan Bay Area 2050+, is expected to be considered for adoption in 2026.
In 2011, the Transportation Authority deepened our role in congestion management on Treasure Island by being designated as the Treasure Island Mobility Management Agency (TIMMA). Subsequent resolutions tasked the Transportation Authority with advancing agency formation documents, planning, and tolling.
In addition, acting as the CMA, the Transportation Authority plays a key role in reviewing and supporting transportation analyses for major local transportation projects and land use policies that may affect the performance of the transportation system.
State law mandates that the Transportation Authority, acting as CMA, biennially determines if the City is in conformance with the adopted Congestion Management Program. A finding of non-conformance has potentially significant consequences for transportation funding in the City. Also, according to state law, it is the City’s responsibility to ensure that transportation projects, programs, and services are put in place, through its implementing departments, to maintain conformance with the CMP.
In fulfilling its CMA mandate, the Transportation Authority must assess City departments’ transportation-related actions at least biennially relative to their congestion management impacts. In doing this, maximizing coordination with the City departments responsible for planning and implementation of transportation actions, so that such actions may be evaluated for congestion management impacts before they are put in place.
As the Congestion Management Agency for San Francisco, the Transportation Authority plays a key sub-regional planning and funding role with the Metropolitan Transportation Commission (MTC), the Bay Area’s regional transportation planning agency, and with the Bay Area Air Quality Management District (BAAQMD), the agency responsible for implementation and monitoring of the region’s Clean Air Plan. The Transportation Authority coordinates local input into MTC’s Regional Transportation Plan (RTP) through the development of the San Francisco Transportation Plan, which establishes the overall vision and priorities for long-range transportation development and funding for San Francisco, and through San Francisco’s portion of the Regional Transportation Improvement Program (RTIP). In these ways, San Francisco influences the vision and goals for transportation and land use planning in the Bay Area.
KEY TOPICS
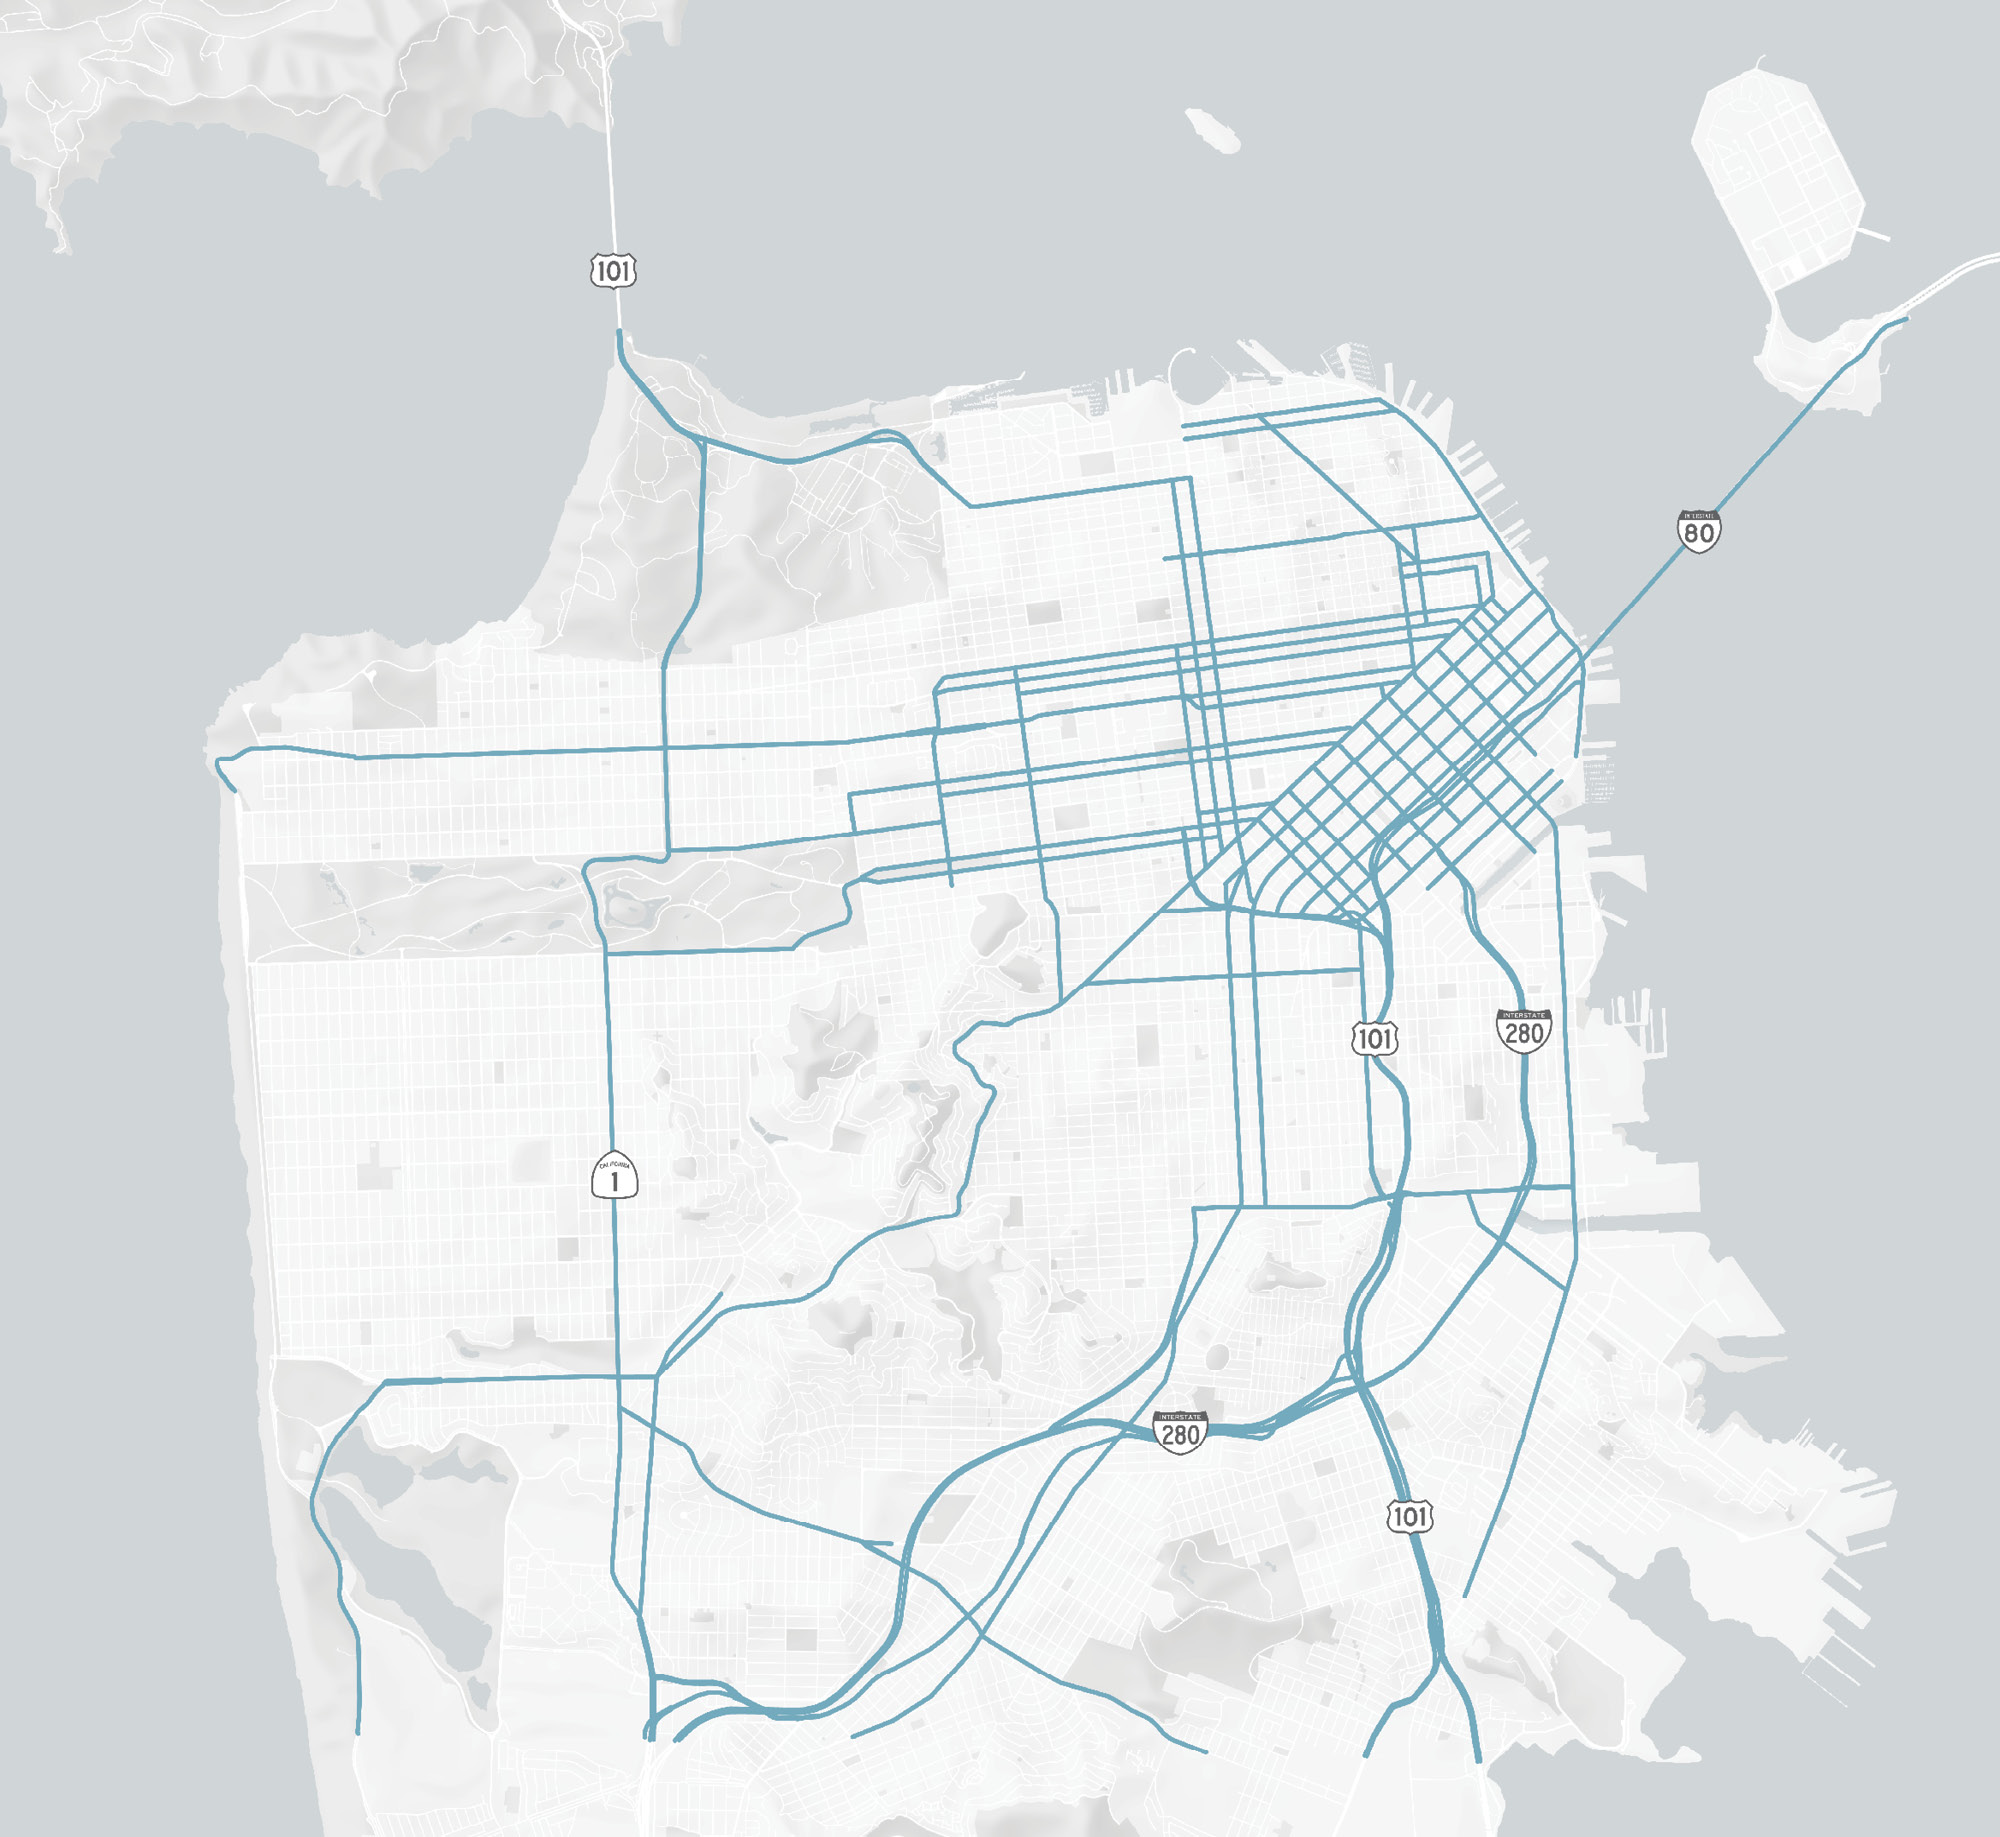
California Government Code Section 65089(b)(1)(A) requires that performance standards be established for a system of highways and roadways designated by the agency, and that this designated Congestion Management Network include at least all state highways and principal arterials. No highway or roadway designated as part of the system may be removed from the system. The statutes do not define ‘principal arterial.’
The statutes also refer to regional transportation systems as part of the required land use impacts analysis program, California Government Code Section 65089(b)(4). In 1991, the Bay Area’s Congestion Management Agencies (CMAs) developed Congestion Management Program (CMP) networks in coordination with MTC’s Metropolitan Transportation System (MTS). The MTS network, which includes both highways and transit services, was subsequently designated as the Congestion Management System, as required by the federal Intermodal Surface Transportation Efficiency Act (ISTEA) of 1991. The MTC contracted with the congestion management agencies in the Bay Area to help develop the MTS and to use the CMPs to link land use decisions to the MTS.
CMP legislation requires that all state highways (including freeways) and principal arterials are included in the CMP network. The network must be useful to track the transportation impacts of land development decisions, as well as to assess the congestion management implications of proposed transportation projects. San Francisco’s network therefore includes numerous local thoroughfares since most urban traffic occurs on city arterials (rather than on the freeways). The next sections document the network selection criteria and process used in the initial San Francisco CMP in 1991 and describe the current network.
Consistent with State requirements, the San Francisco CMP roadway network includes all freeways and state highways, as well as principal arterials. San Francisco has defined principal arterials as the Major Arterials designated in the Transportation Element of the City’s General Plan, defined as follows:
“cross-town thoroughfares whose primary function is to link districts within the city and to distribute traffic from and to the freeways; these are routes generally of citywide significance; of varying capacity depending on the travel demand for the specific direction and adjacent land uses.”
Several additional arterials — Market Street, Mission Street, Sutter Street, and West Portal — are also included in the CMP roadway network. These streets experience significant conflicts between auto traffic and transit service.
The 1993 CMP documented the criteria used in 1991 to segment the CMP roadway network in San Francisco, including freeway facilities (see the CMP Roadway Network Segmentation and Changes document on the Transportation Authority’s CMP reports & documents page). The following five criteria determined segment limits for the city arterials in the CMP: predominant development patterns (e.g., number of driveways, institutional uses); changes in speed limits; major cross streets; significant changes in traffic volumes; and freeway ramps. These criteria are generally recognized as significant in explaining the operating profile of a roadway.
For freeway facilities the segmentation criteria are simpler. They include major interchange on and off ramps, and points where two freeway facilities merge or bifurcate.
The complete CMP roadway network for San Francisco consists of 233 directional miles on both arterials and freeways.
|
ROADWAY TYPE |
TOTAL DIRECTIONAL MILES |
|---|---|
|
Arterial |
198.4 |
|
Freeway |
34.9 |
|
Total |
233.3 |
Performance monitoring was conducted in the current CMP cycle for the entire CMP network.
A complete list and description of all arterial and freeway segments in the CMP network can be found in the CMP Roadway Network Segmentation and Changes document on the Transportation Authority’s CMP reports & documents page.
State law prohibits the removal of roadway facilities from the initially designated CMP network (unless facilities are physically removed from the transportation system, such as the Embarcadero Freeway). New facilities may be added to the CMP network without restrictions, subject to the established criteria for inclusion. No network segmentation changes were made in the current CMP cycle. The CMP Roadway Network Segmentation and Changes document on the Transportation Authority’s CMP reports & documents page lists all CMP arterials where segmentation changes have been made since 1991, including a technical justification.
From time to time the Transportation Authority may also monitor additional segments that are not part of the official CMP network. These do not constitute official changes to the CMP network but may be included to support current planning and system management efforts. The Transportation Authority has not monitored any additional segments in the current CMP cycle.
Download map data (GeoPackage)
KEY TOPICS
This chapter presents the Congestion Management Program (CMP) multimodal performance results, including analyses of traffic congestion, transit, and non-motorized performance measures. It combines the traffic Level of Service (LOS) and multimodal performance elements required under state CMP legislation, reflecting the legislation’s requirement that LOS be included as one of several multimodal performance measures. This approach is also consistent with San Francisco’s urban multimodal environment. Vehicular traffic congestion remains an important metric of transportation performance in San Francisco, but the City and County’s Transit First policy and emphasis on accessibility place higher priority on the performance of alternative modes including transit, biking, and walking than on private vehicle speeds.
The California Government Code requires that San Francisco use automobile LOS standards to measure the performance of the CMP roadway network, but permits Congestion Management Agencies (CMAs) a choice among the following methodologies for measuring LOS:
The CMA is required to biennially determine the City’s conformance with the CMP, including attainment of LOS standards.
In accordance with Congestion Management legislation, county and city governments are required to show that CMP route segments within their jurisdiction are operating at or above the CMP traffic LOS standard for all segments outside of any designated Infill Opportunity Zone (IOZ). CMP route segments located within an IOZ are exempt from the minimum LOS standards and deficiency plan requirements mandated elsewhere by the CMP legislation. (California Government Code, Section 65089(b)(1)(B)) See Chapter 6 for a more detailed description and a map of San Francisco’s IOZ.
The CMP legislation also requires a multimodal performance element. AB 1963 in 1994 requires that the CMP shall include “[a] performance element that includes performance measures to evaluate current and future multimodal system performance for the movement of people and goods,” and identifies performance measure requirements.
The original CMP legislation defined performance narrowly as roadway LOS. The amendments to the CMP legislation acknowledged the need for diversified solutions to complex transportation problems in urban areas, and the inadvisability of tackling them with just one mode. Current performance element requirements recognize that the transportation system performance monitoring should be multimodal: automobile, transit, bicycling, walking, and emerging modes such as micromobility, or ride share.
According to the CMP legislation, deficiencies are identified only on the roadway system. The LOS scale focuses only on automobile travel. It does not take into account the person throughput capacity of a roadway, nor does it account for other vital performance measures of roadways such as safety. A city arterial may carry the maximum number of automobiles at an acceptable speed, but if each vehicle carries only the driver, then the throughput of the facility is suboptimal. San Francisco therefore includes performance standards and measurements that evaluate more aspects of the City’s multimodal transportation network. San Francisco’s high transit, walking, and biking mode shares and extensive non-auto mode networks mean that the city benefits from a multimodal approach to system performance monitoring.
Consistent with State law, this report distinguishes between two categories of performance measures. Legislatively required measures include roadway LOS plus three transit service performance measures: routing, frequency, and inter-operator service coordination. These are the elements of congestion and multimodal performance measurement that are explicitly required by State congestion management statutes. San Francisco’s CMP includes one additional roadway performance measure called the Buffer Time Index (BTI), which indicates roadway speed reliability. Section 4.4 provides details on all these metrics.
Local performance measures include multimodal metrics that are not used for determination of CMP conformance under State legislation but reflect performance goals for non-automobile modes in San Francisco. The local measures are used for planning purposes and to track trends over time. Transit measures included in this CMP include transit speeds, transit-to-auto speed ratios, transit speed reliability (variability), and transit accessibility, which tracks the proportion of population and jobs that are within a five-minute walk to a given frequency of transit service. Non-motorized metrics include multimodal volumes, bicycle network completeness, and injury or fatal collisions involving people walking or biking. These measures are discussed in further detail in Section 4.5.
State law requires that link (roadway) LOS be used for determining CMP conformance and conducting deficiency planning, except within a designated Infill Opportunity Zone. Multimodal performance measures will be used for the following purposes:
The CMP legislation defines roadway performance primarily by using the LOS traffic engineering concept to evaluate operating conditions on a roadway. LOS describes operating conditions on a scale of A to F, with “A” describing free flow, and “F” describing bumper-to-bumper conditions. The CMP-mandated traffic LOS standard for San Francisco was established at E in the initial (1991) CMP network. Facilities that were already operating at LOS F at the time of baseline monitoring, conducted to develop the first CMP in 1991, are legislatively exempt from the LOS standard. In addition, because much of San Francisco is in an Infill Opportunity Zone, most CMP segments in San Francisco are exempt from minimum LOS standards. However, continued monitoring of automobile LOS is useful for a variety of reasons. As the most extensive historical dataset available, LOS allows for the monitoring of traffic conditions over a long period of time. In addition to LOS, travel time reliability is an important measure of roadway congestion. With travelers experiencing a broad range of conditions from day to day, it is not sufficient to understand congestion just in terms of “average” or “typical” conditions (as measured by LOS). The Buffer Time Index (BTI), calculated as the percent of average additional travel time that the travelers need to budget so that they have a 95% chance of arriving on time, was introduced in the CMP 2021 to measure roadway reliability. In other words, it is the extra time needed if one does not want to be late more than once a month.
Congestion is also an important factor affecting the performance of surface-running transit service, especially for transit operating in mixed traffic. Finally, ongoing monitoring of both automobile and transit speeds within the same corridor facilitates the assessment of relative modal performance.
The Transportation Authority uses commercial data from INRIX, which combines several real-time GPS monitoring sources with data from highway performance monitoring systems, as the primary source for speed and LOS calculations. INRIX data is supplemented with floating car data where INRIX data is not available. The INRIX and floating car data were collected in April and May 2025, which is the typical CMP monitoring period for San Francisco. The Buffer Time Index (BTI) for travel time reliability was calculated for CMP segments for which INRIX data were available (244 out of 245 segments). This is because BTI calculation involves deriving the distribution of speeds and travel times during the monitoring period and determining the 95th percentile values. This distribution cannot be calculated for the limited subset of segments for which only floating car run data were available. The methodology and results of the LOS Monitoring effort are detailed in Appendix 1.
Traffic speeds vary seasonally, with lower speeds in the spring and fall, and higher speeds in the summer and winter during holidays and school closures. The CMP accounts for this seasonality by monitoring speeds in the same months, April and May, of each year. Speeds during 2020 and 2021 followed unique patterns due to the Covid 19 pandemic, but typical seasonality was evident again in 2022. From 2022 to 2025 so far, each year has exhibited normal seasonal trends. However, in August and September of 2023, when speeds typically decline from summer highs, INRIX data showed speeds continuing to increase. Staff could not identify any events that would explain a significant two-month long deviation in typical seasonal speed trends and believe there is an error in the underlying data or change in data processing methods, although INRIX has not confirmed this. After this unexplained increase in speeds data resumed typical seasonal patterns, although at elevated speeds. This resulted in higher peak period traffic speeds in 2025 than in 2023, which is an unintuitive trend that is not supported by contemporaneous arterial traffic counts in 2023 and 2025. As a result, the following analysis compares 2025 data to 2024 rather than data from the previous 2023 cycle, as would be typical.

Download chart data (CSV)
Table 4-1 and Table 4-2 presents the change in CMP network averageAverages are weighted by the length of each CMP segment. travel speeds (calculated as time-mean speed) and travel time reliability, between 2024 and 2025 for the AM Peak (7:00 – 9:00 a.m.) and PM Peak (4:30 – 6:30 p.m.) periods.
|
CATEGORY |
Peak Period |
Buffer Time Index |
||
|---|---|---|---|---|
|
2024 |
2025 |
Difference |
||
|
Arterial |
AM |
22% |
22% |
−0% |
|
PM |
21% |
20% |
−1% |
|
|
Freeway |
AM |
44% |
57% |
12% |
|
PM |
37% |
61% |
24% |
|
In general, roadway speeds are lower during the PM Peak than in the AM Peak, conforming to long-time historical trends. Average speeds on the CMP network arterials have decreased since 2024 for both the AM Peak (−4%) and PM Peak (−6%). Average speeds on CMP network freeways also decreased in both the AM Peak and PM Peak (−4%).
Overall roadway speeds had been decreasing since 2011 until the COVID pandemic. Roadway speeds increased in 2021 during the COVID pandemic, then decreased between 2021 and 2023 as people began to return to pre-COVID pandemic activity levels. Speeds in both peak period on freeways and arterials declined from 2024 to 2025. (Figure 4-2).
A significant portion of San Francisco’s arterial CMP network overlaps with its Vision Zero High Injury Network. In 2025, the Board of Supervisors adopted the San Francisco Street Safety Act, directing a multiagency coordinated approach to ending severe and fatal traffic crashes. The act directs agencies to pursue strategies to identify and implement infrastructure improvements, improve traffic enforcement, pursue electronic enforcement technologies like red light and speed cameras, establish procedures to implement solutions more efficiently, and prioritize solutions where they are needed most. San Francisco has also introduced lower speed limits on a number of streets that are designated as “safety corridors”, many of which overlap with the CMP network. These changes work to improve the safety for all road users of San Francisco’s transportation system, and may be reflected in a drop in travel speeds on the CMP network.
Note: data collected April – May each year
Download chart data (CSV)
Arterial roadway speeds in the downtown core are historically lower than citywide average arterial speeds. In 2025, arterial speeds in the downtown core declined by −6% in the AM Peak and −7% in the PM Peak, a faster rate of decline than citywide arterial speeds (Figure 4-3), indicating relatively greater increases in congestion downtown as can be expected with economic activities returning after limited growth post-pandemic.
Note: Downtown Core in this figure is defined to include streets east of Franklin/Gough Streets, and north of the Central Freeway and Mission Creek. It also includes the streets immediately surrounding the Octavia Boulevard entrance/exit of the Central Freeway
Download chart data (CSV)
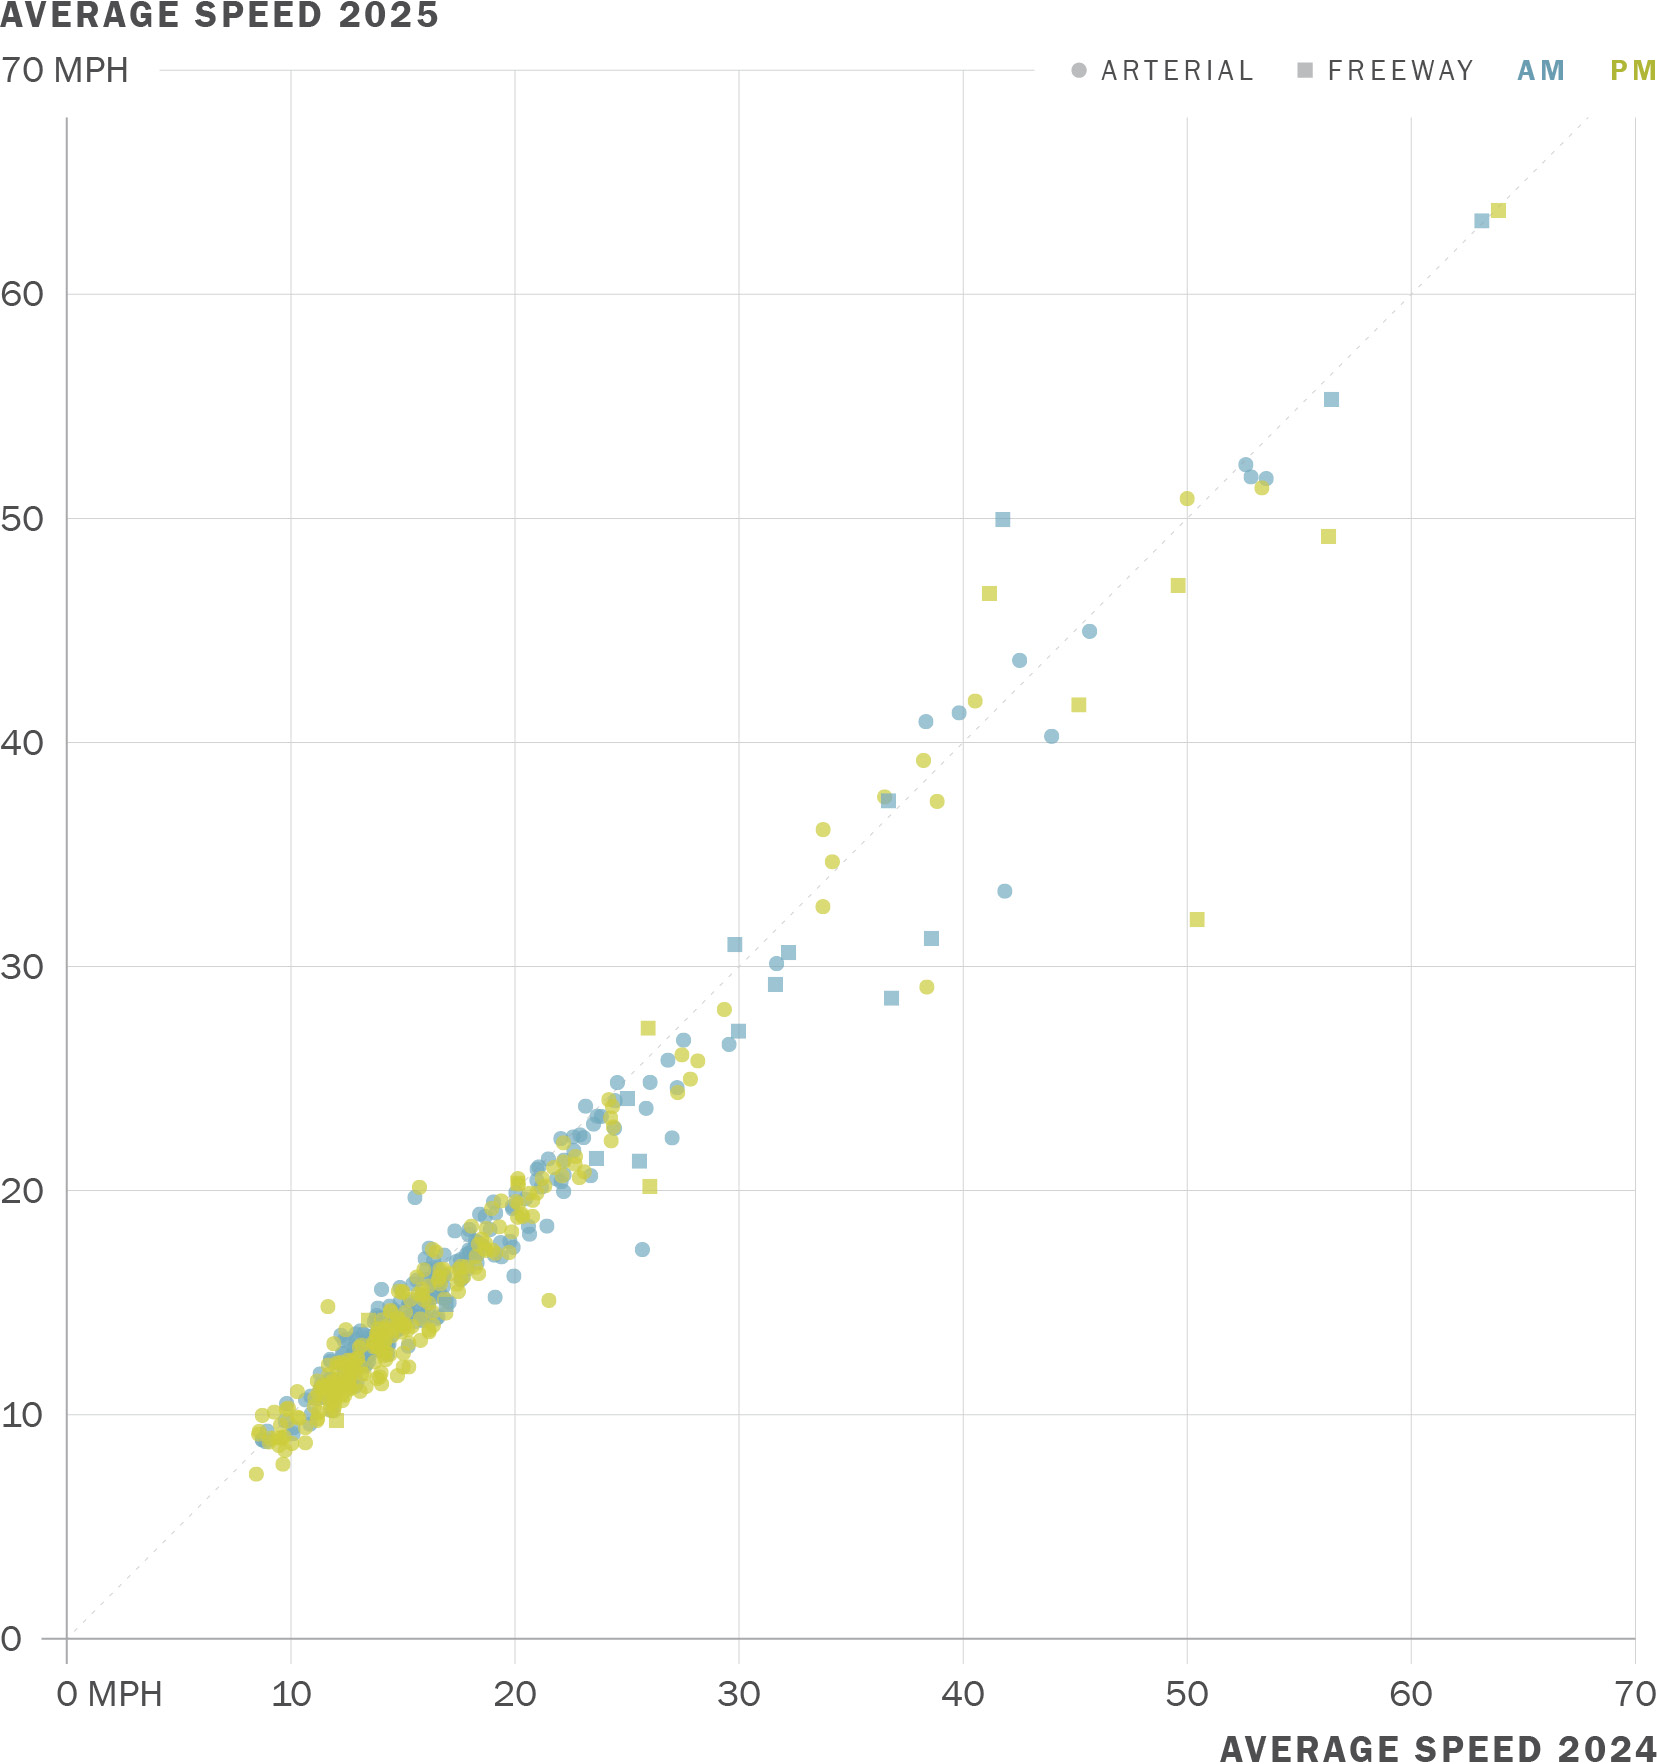
Figure 4-4 presents the change in CMP average speeds for each road segment between 2024 and 2025. The diagonal line from the lower left to the upper right means no change in speed has been observed, with points above (to the upper-left) / below (to the bottom-right) of the diagonal indicating speed increases/decreases respectively. Points clustered below and to the right of the diagonal line indicate that speeds have generally decreased from 2024 to 2025.
Download chart data (CSV)
Table 4-3 and Table 4-4 identify the segments that experienced the largest percentage decrease in speed since the previous CMP cycle.
In addition to speed and LOS, the Buffer Time Index (BTI) travel time reliability metric was derived for all CMP segments for which INRIX data were available, where a lower value of BTI indicates higher reliability. Between 2024 and 2025 reliability remained flat on arterials, with the BTI remaining at 22% in the AM Peak and decreasing from 21% to 20% in the PM Peak (a slight improvement in reliability). In contrast, freeway travel time reliability worsened significantly over the same period from 44% to 57% in the AM Peak and from 37% to 61% in the PM Peak (Table 4-2 and Figure 4-5), indicating a rising need to manage freeway demand (see San Francisco Freeway Management Study, underway).
Note: data collected April – May each year
Download chart data (CSV)
Figure 4-6 and Figure 4-7 show the LOS by roadway segment for the AM Peak and PM Peak, respectively. Full LOS monitoring results can be found in Appendix 1. Figure 4-8 and Figure 4-9 show the BTI by segment for AM Peak and PM Peak periods respectively. Interactive versions of these maps can be found at cmp.sfcta.org.

The Transportation Authority maintains the San Francisco Congestion Dashboard (congestion.sfcta.org), shown in Figure 4-10. This tool reports many of the same roadway performance metrics as reported in the CMP congestion visualization, but with a much greater frequency (monthly instead of biennially) for a larger set of roadway segments, and at an hourly level as well as for the AM Peak and PM Peak periods starting in January 2020.
There are no non-exempt LOS F CMP segments in this cycle for the AM Peak or PM Peaks. A section describing the exempt statuses of segments measured at LOS F in the current CMP cycle can be found in Appendix 1. For a detailed discussion regarding the CMP deficiency planning process, see the Deficiency Plans document on the Transportation Authority’s CMP reports & documents page.
San Francisco has the most extensive transit coverage in the Bay Area. Refer to the websites of transit operators serving San FranciscoThe main transit operators in San Francisco include Muni, BART, Caltrain, AC Transit (Transbay service), SamTrans, and Golden Gate Transit (bus and ferry). for information on their service frequency and routing, which are still undergoing changes in the current post-COVID pandemic context.
Transit frequency refers to the number of transit vehicles (buses, trains, or ferries) per unit of time (e.g., 4 buses per hour). The inverse of the frequency is called “headway,” which is the time between transit vehicles (e.g., 15 minutes between buses).
Muni transit coverage by walk access at different levels of headways has been reported since the 2021 CMP cycle (and calculated for the April – May monitoring period biennially starting from 2017). This transit coverage metric reports the percent of San Francisco’s total population and total jobs that are within a five-minute walk of Muni transit service, using Muni’s General Transit Feed Specification (GTFS), and population and employment data derived from the US Census’ American Community Survey and San Francisco Planning Department.
Since 2023, more than 95% of San Francisco residents live within a five-minute walk of Muni service. Moreover, the share of the population within a five-minute walk of a Muni route with a five-minute headway increased from 27% in 2023 to 29% in 2025 for the AM Peak and from 20% in 2023 to 27% in 2025 for the PM Peak, though this is still lower than the pre-COVID population share within a five-minute walk of a Muni route with a five-minute headway (Figure 4-11 and Figure 4-12).
Download chart data (CSV)
Download chart data (CSV)
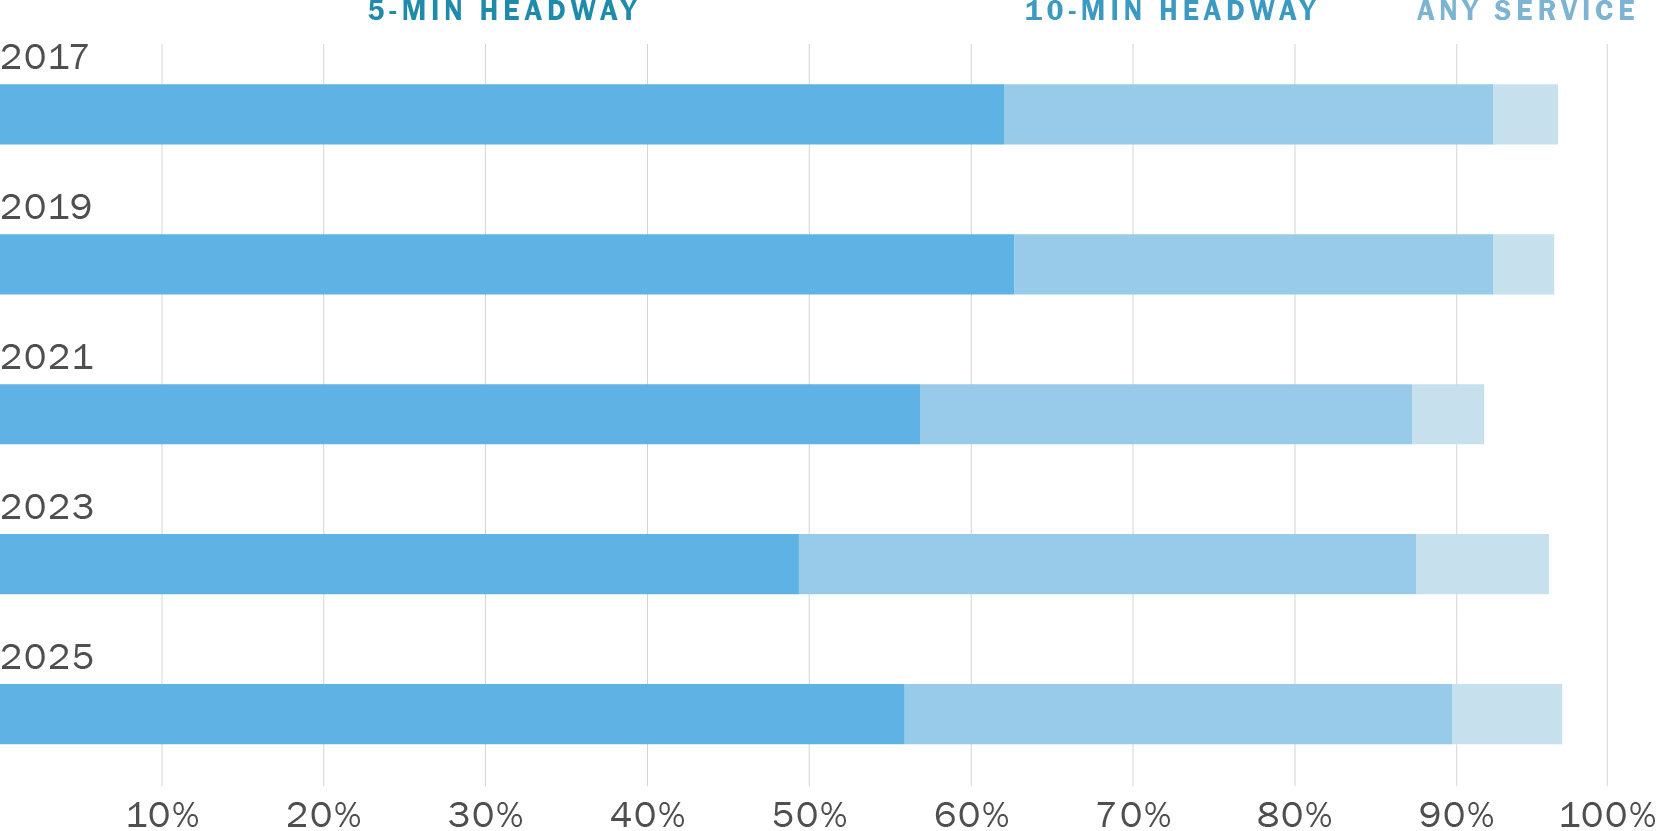
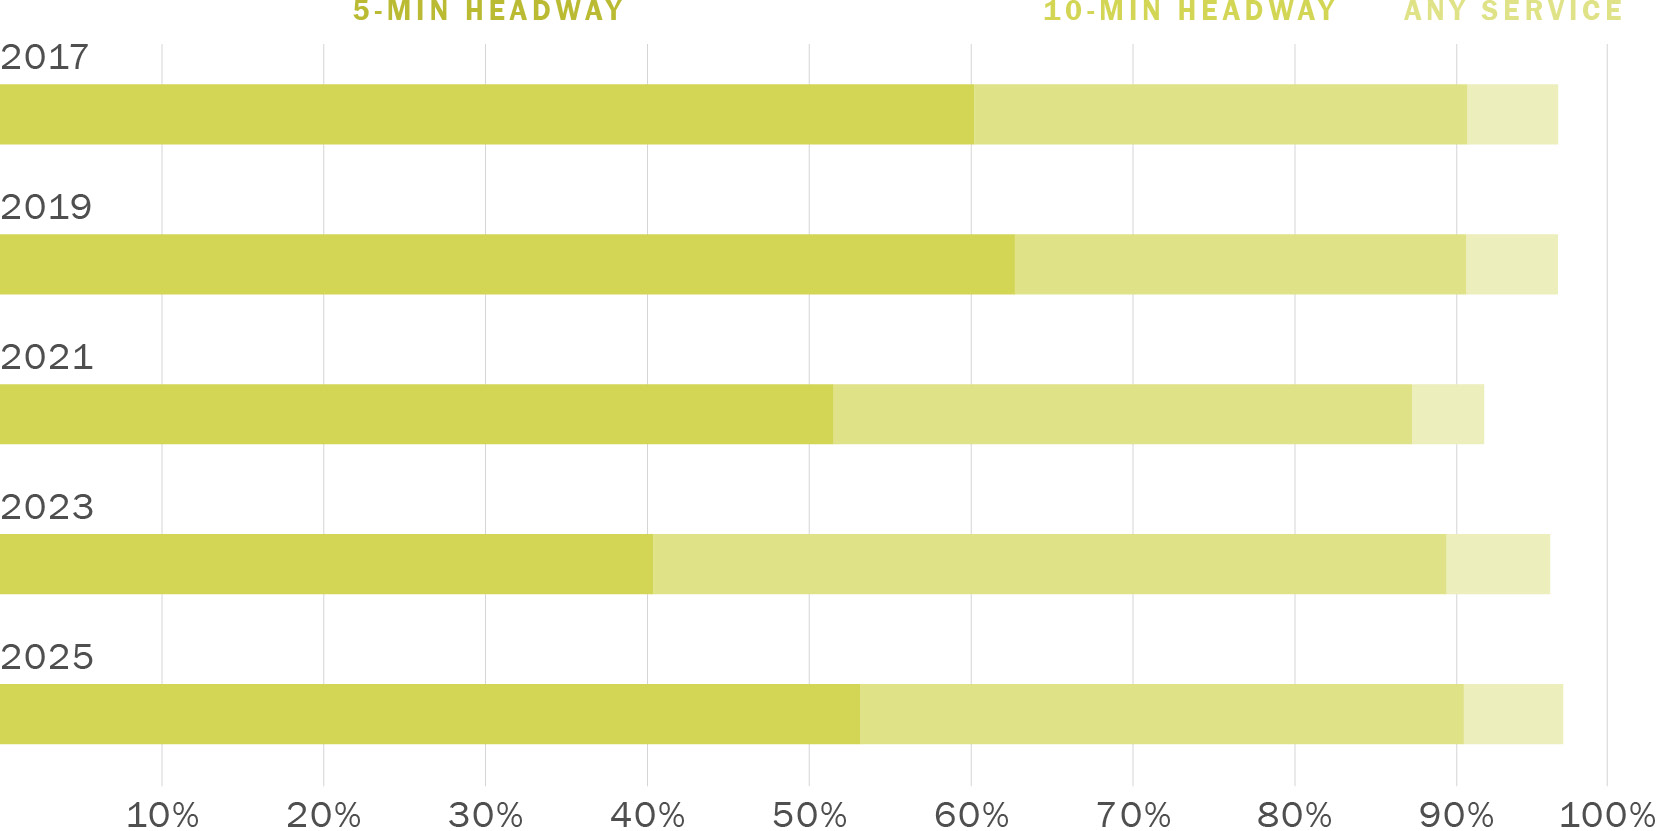
Muni transit coverage in terms of jobs for both the AM Peak and PM Peak periods show trends similar to those observed in population Muni transit coverage, with a larger increase between 2023 and 2025 in the share of jobs within a five-minute walk of a Muni route with a five-minute headway, from 50% to 56% (AM Peak) and from 41% to 56% (PM Peak) (Figure 4-13 and Figure 4-14).
Download chart data (CSV)
Download chart data (CSV)
Figure 4-15 and Figure 4-16 show maps of Muni transit coverage in Spring 2025 by service frequency for the AM Peak and PM Peak periods respectively.
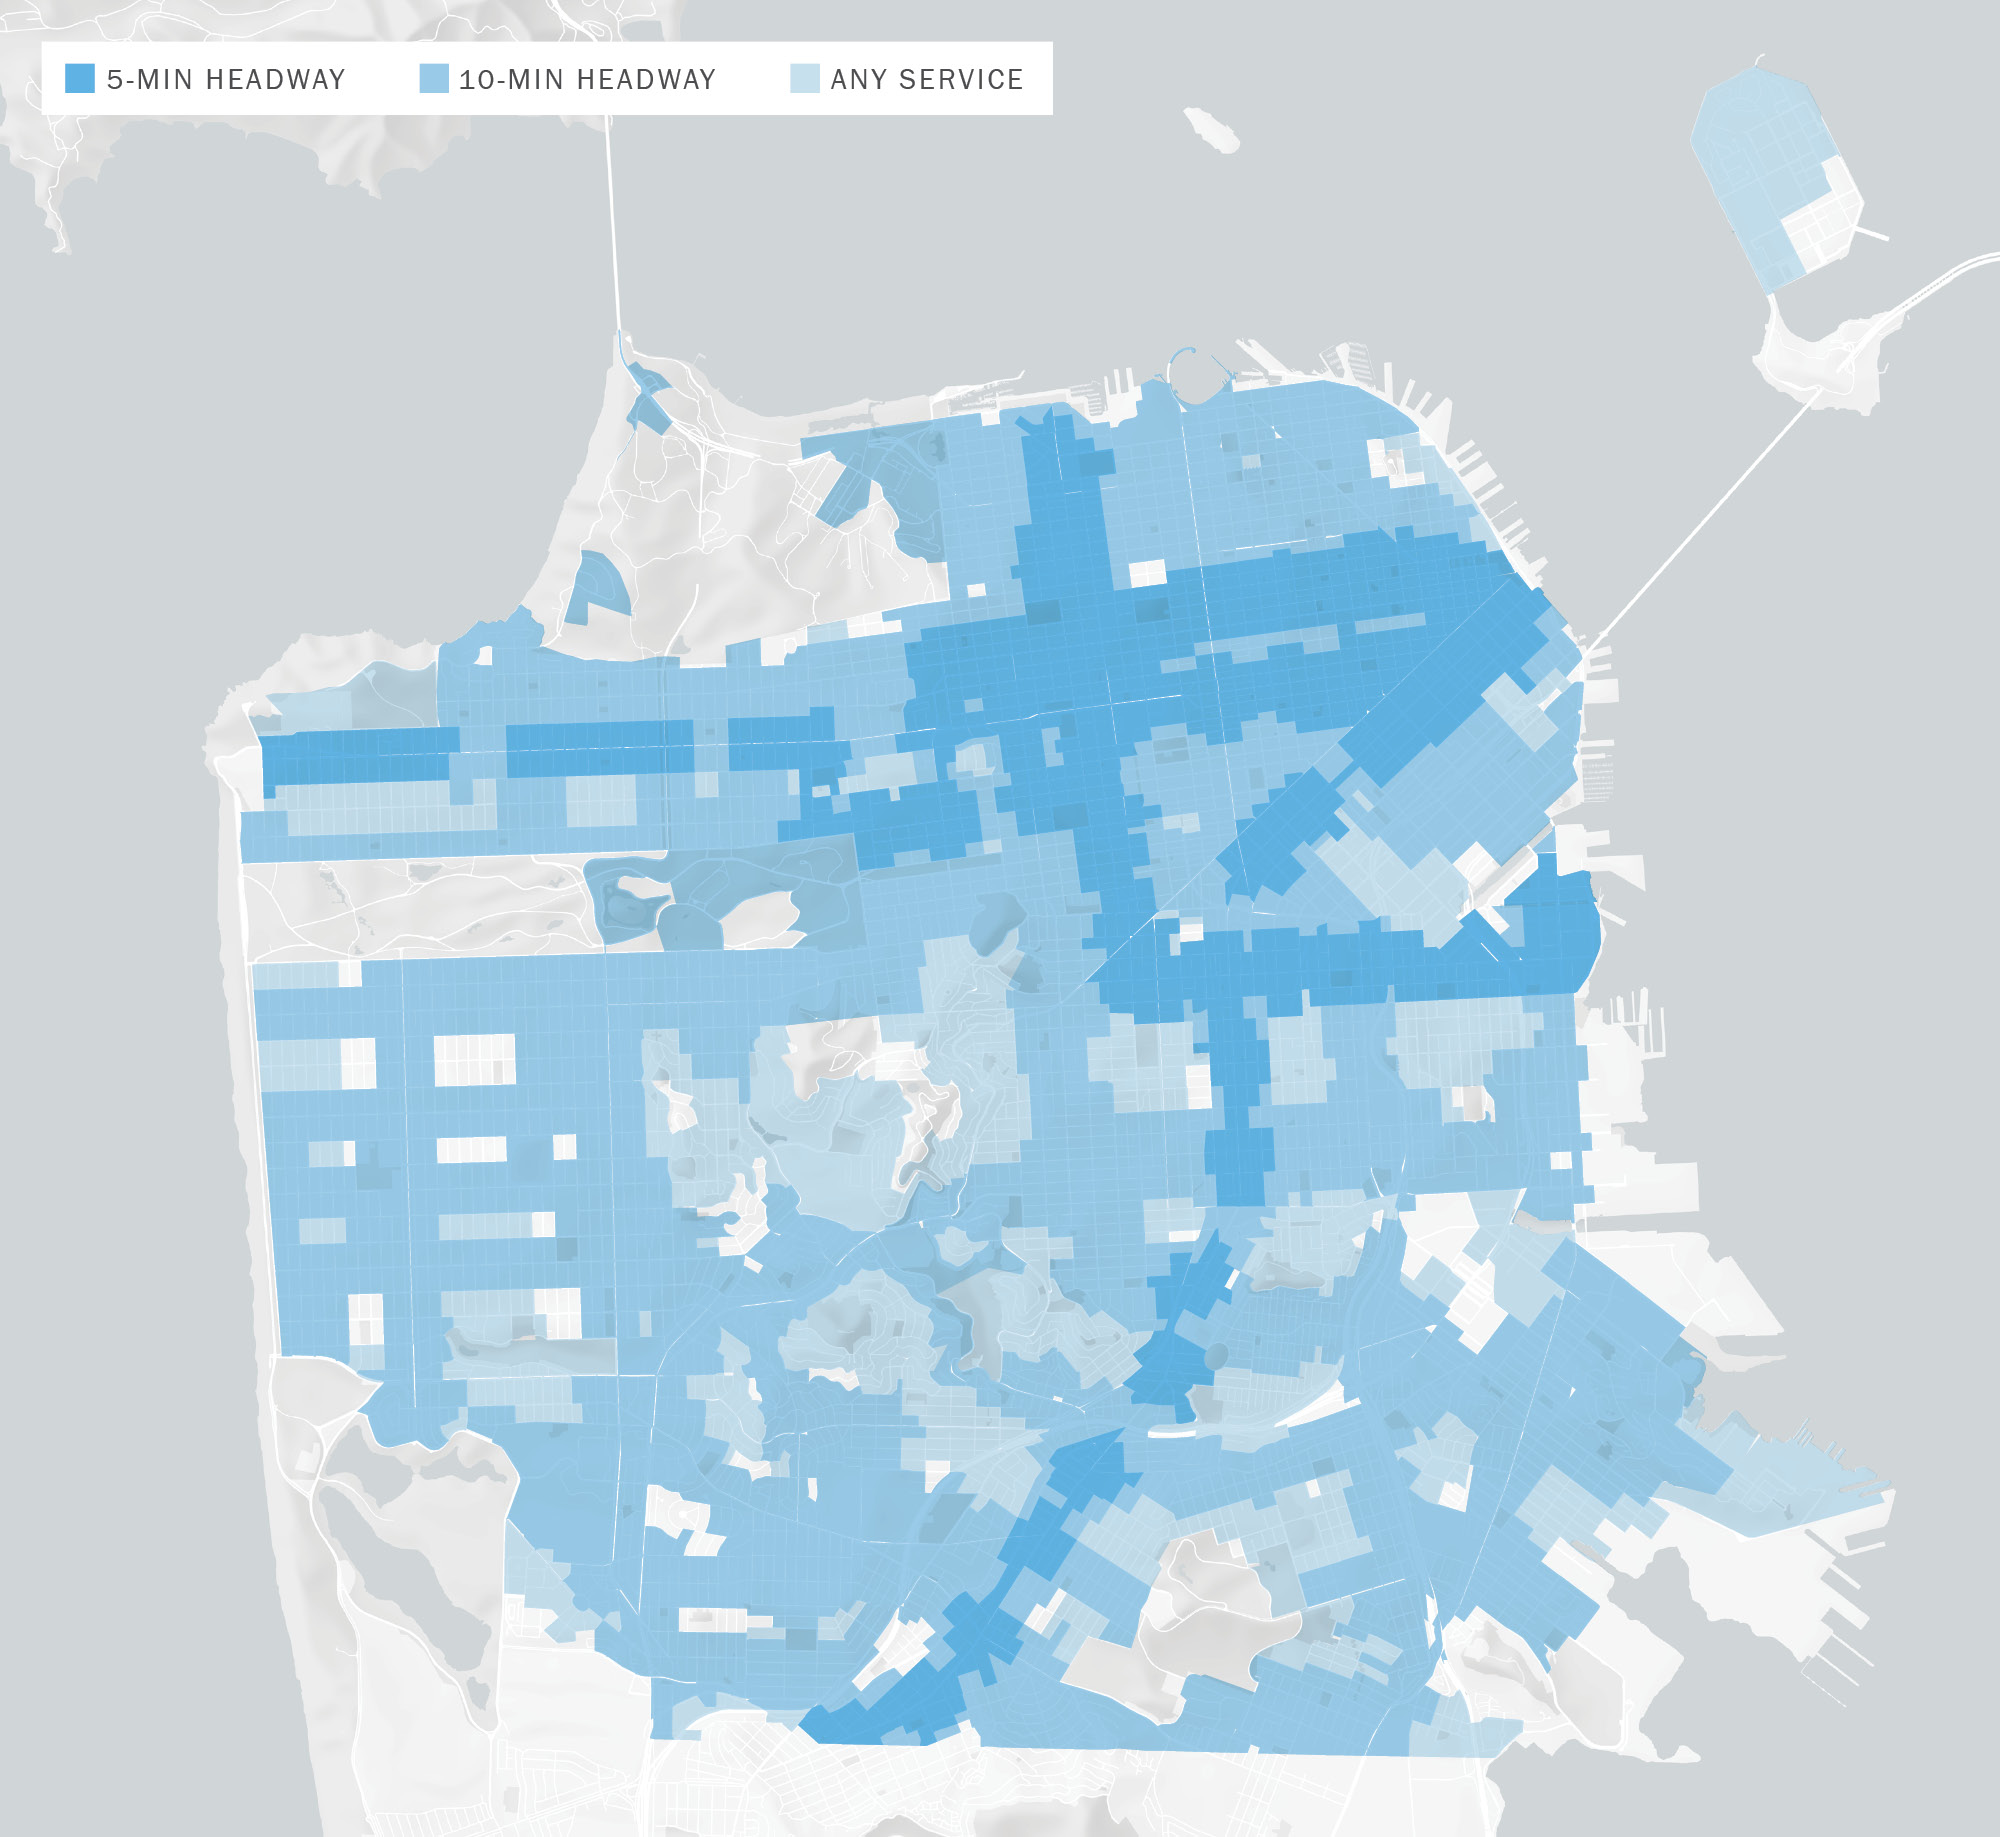
Note: data are from April – May of the monitoring year
Download map data (GeoPackage)
Note: data are from April – May of the monitoring year
Download map data (GeoPackage)
Linkages between transit services are provided by different operators (e.g., timed transfers at transit centers, joint fare cards, etc.) to facilitate the use of transit. Senate Bill 602 required that MTC, in coordination with the Bay Area’s Regional Transit Coordinating Committee (RTCC), develop rules and regulations for fare and schedule coordination in MTC’s nine-county Bay region. To that end, MTC has set up the Fare Integration Task Force in 2020 to further fare coordination and integration in the region. SB 1474, passed in 1996, set coordination objectives for the region’s transit services, and MTC has adopted Resolution 3055, Transit Coordination Implementation Plan, to comply with SB 1474. This MTC-led process is considered sufficient to meet the intent of CMP law regarding transit service coordination in the region. Compliance with MTC’s process by Muni and all other operators serving San Francisco will therefore constitute sufficient grounds for a finding of conformance with CMP transit coordination requirements.
In measuring performance, we are measuring the ability of the system to satisfy the transportation needs of all San Franciscans, and we must therefore measure performance with reference to all types of transportation system users, including people riding transit, biking, and walking. Other than the outdated LOS standard as a performance measure for autos, there are few established standards for measuring system performance for people riding transit, biking, and walking. Multimodal performance data is increasingly needed for system performance measurement pursuant to updates of the San Francisco Transportation Plan and congestion management planning as well as for project planning, transportation impact analysis, and project prioritization. It is necessary to provide better information to the traveling public, as well as to inform policy decisions about funding of transportation projects and services.
The CMP includes nine types of local multimodal performance measures:
Transit speeds are based on the San Francisco Municipal Transportation Agency’s (SFMTA) automatic passenger counter (APC) systems, which collect robust, real-time data on transit vehicle performance and ridership. For the current CMP cycle, APC data collected on Muni’s bus (diesel and trolley coach) fleet in the entire months of April and May 2025 were analyzed. The raw APC transit data utilized corresponded to the same AM Peak (7 – 9 a.m.) and PM Peak (4:30 – 6:30 p.m.) periods as the automobile LOS monitoring.
A detailed description of the APC data collection and analysis methodology can be found in Appendix 2.
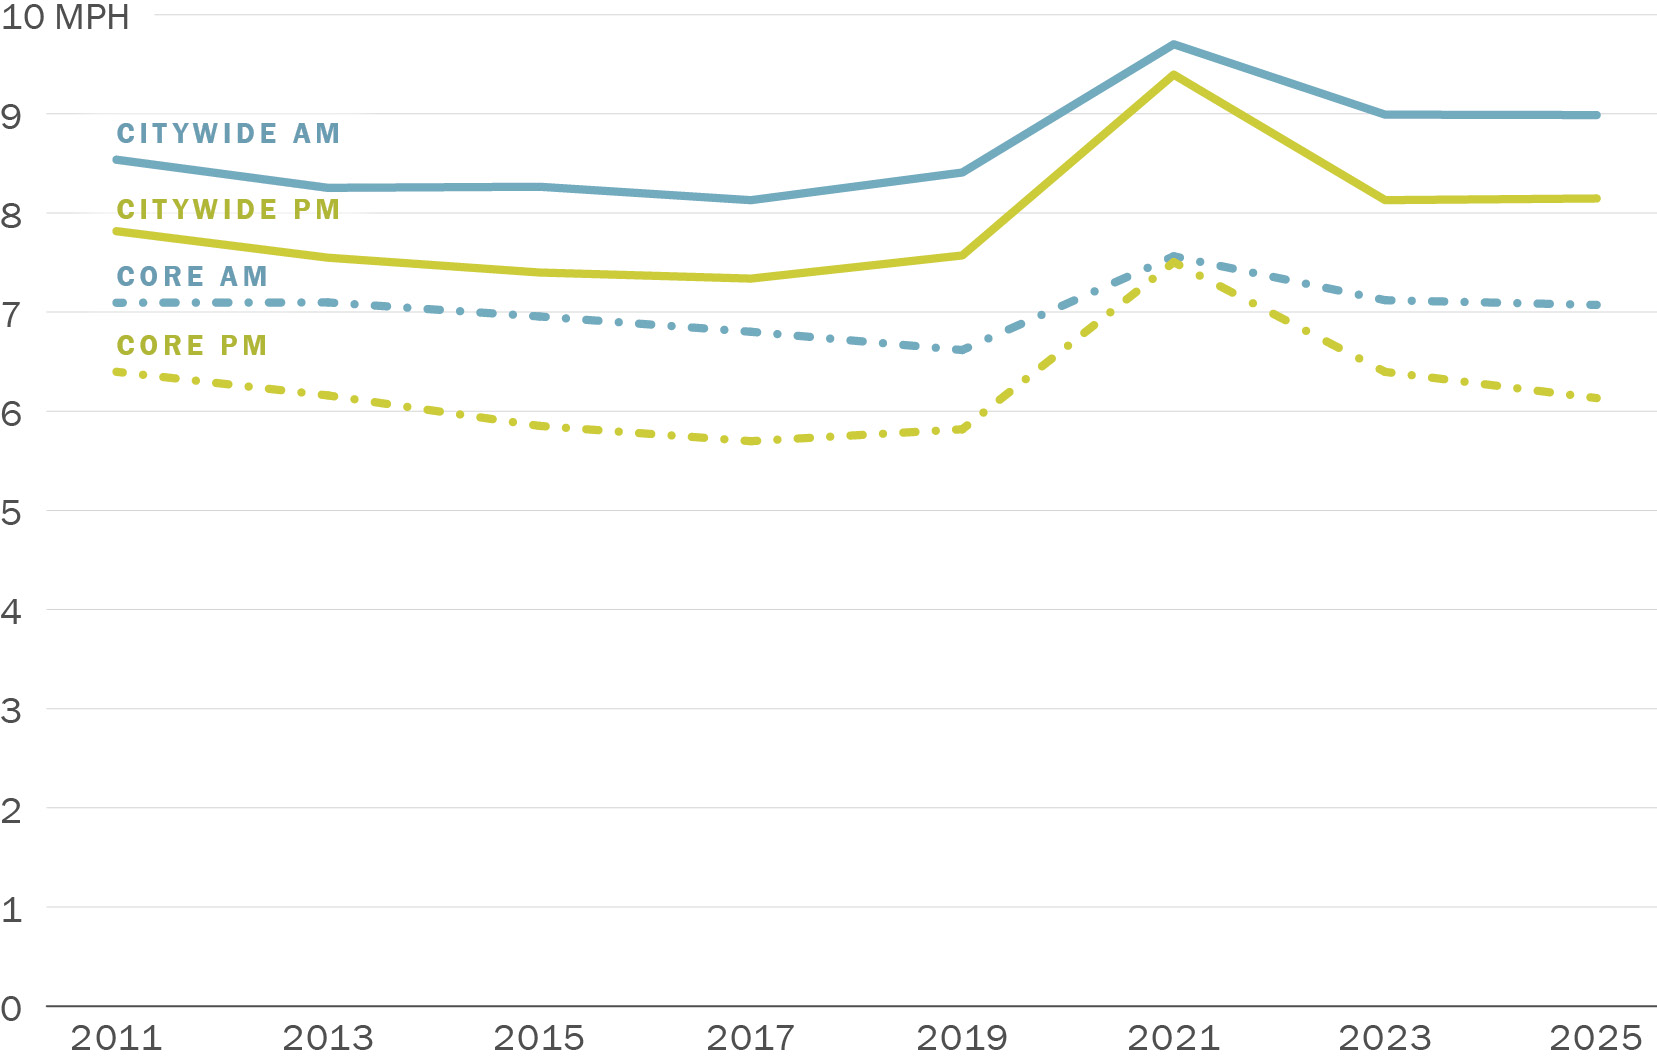
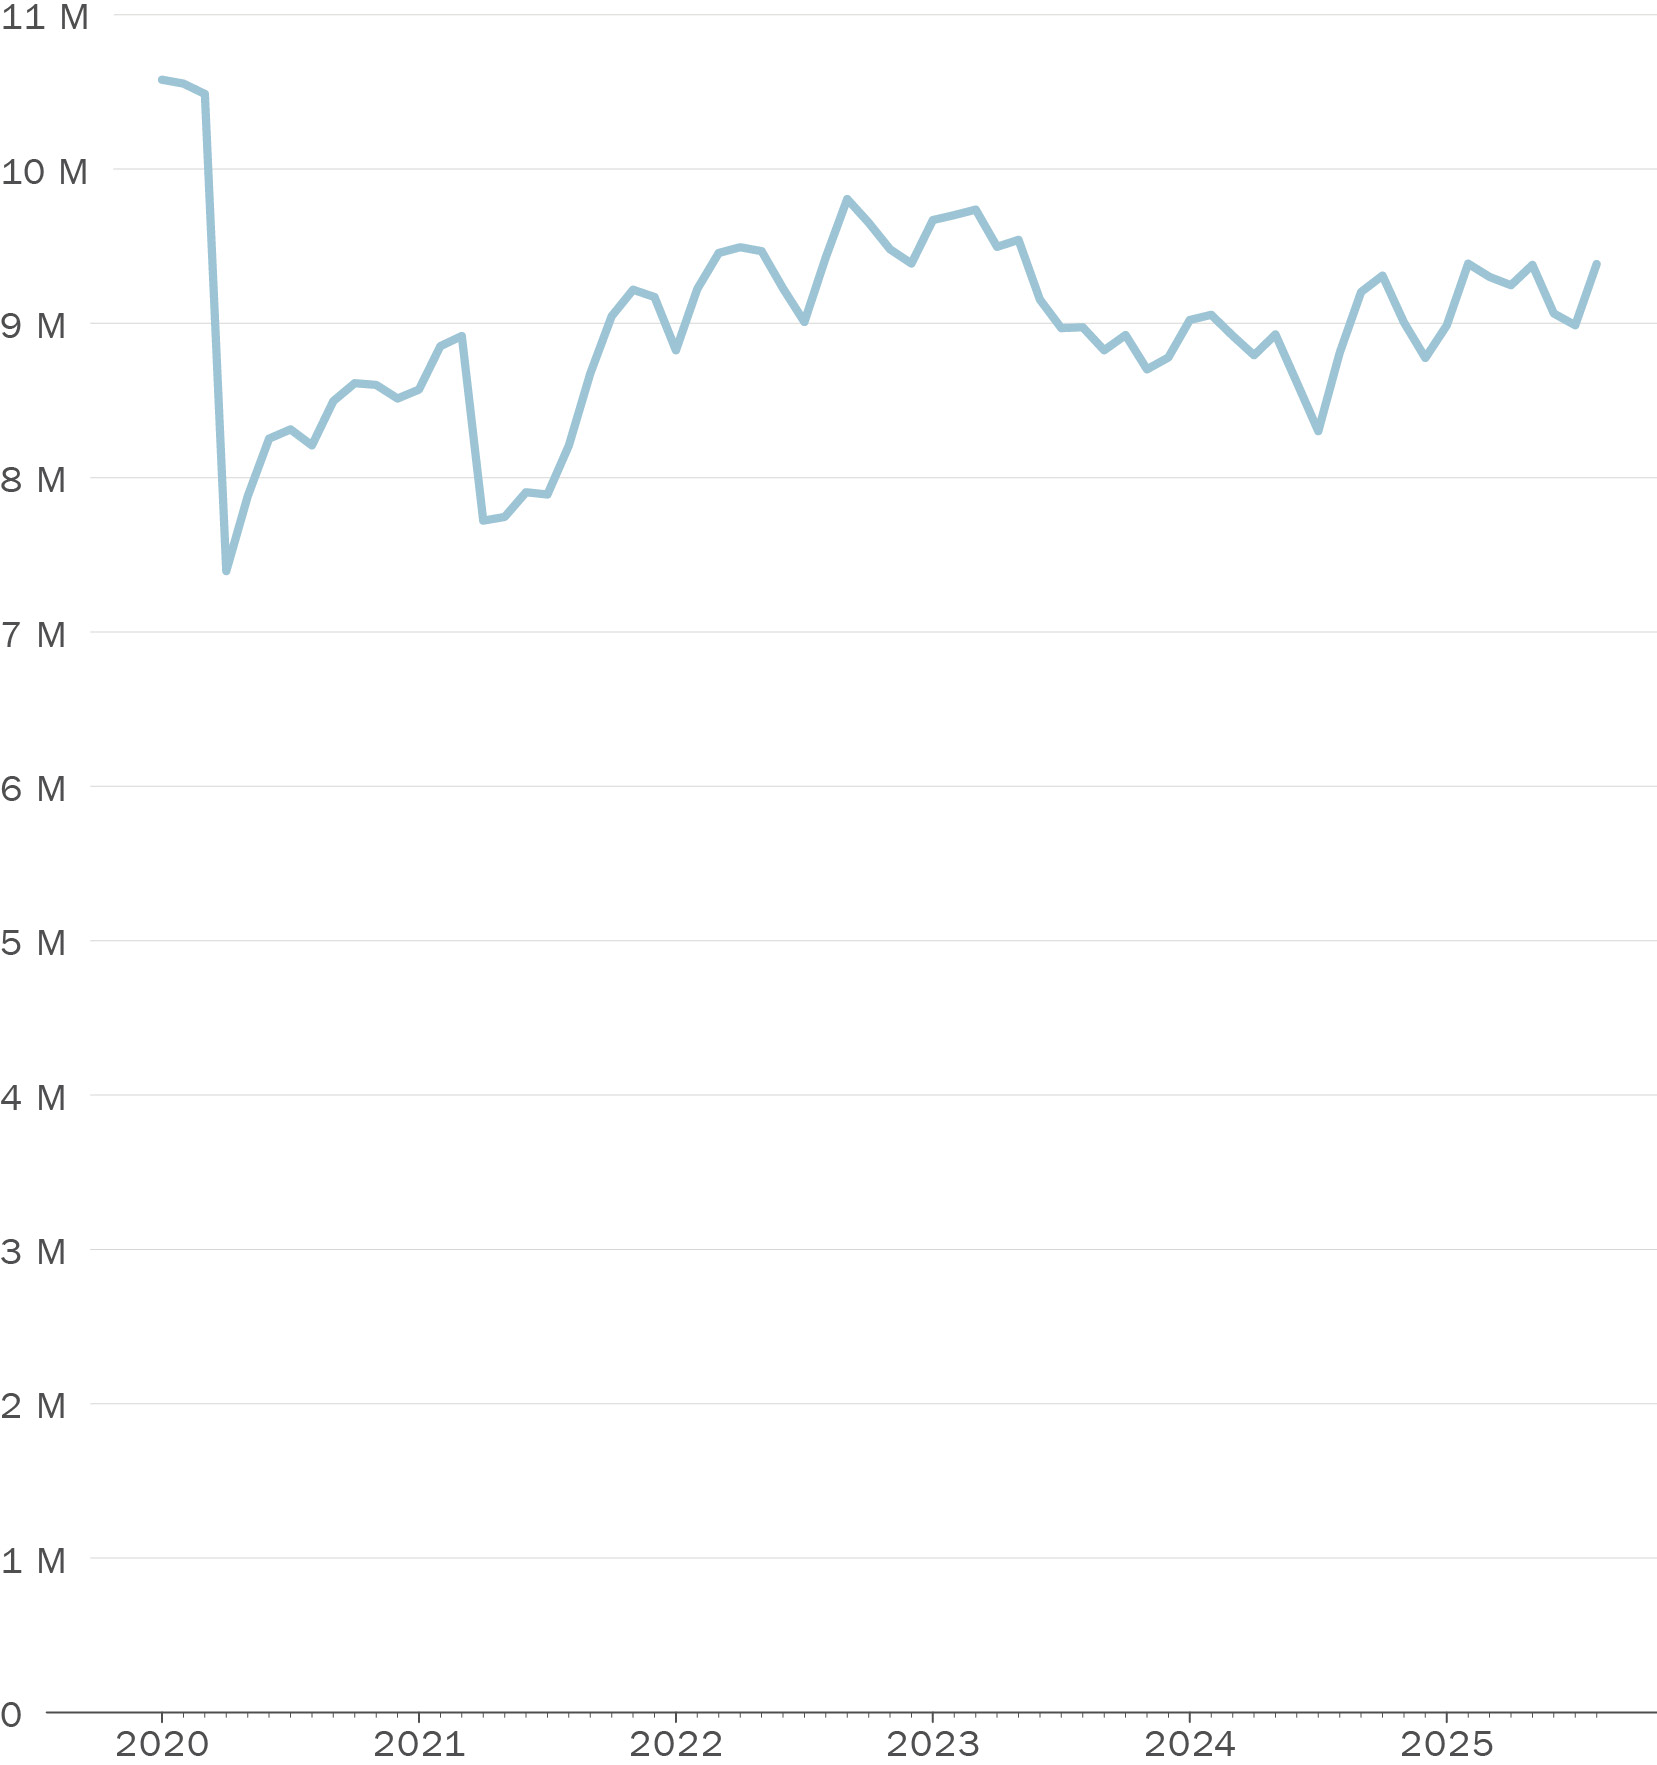
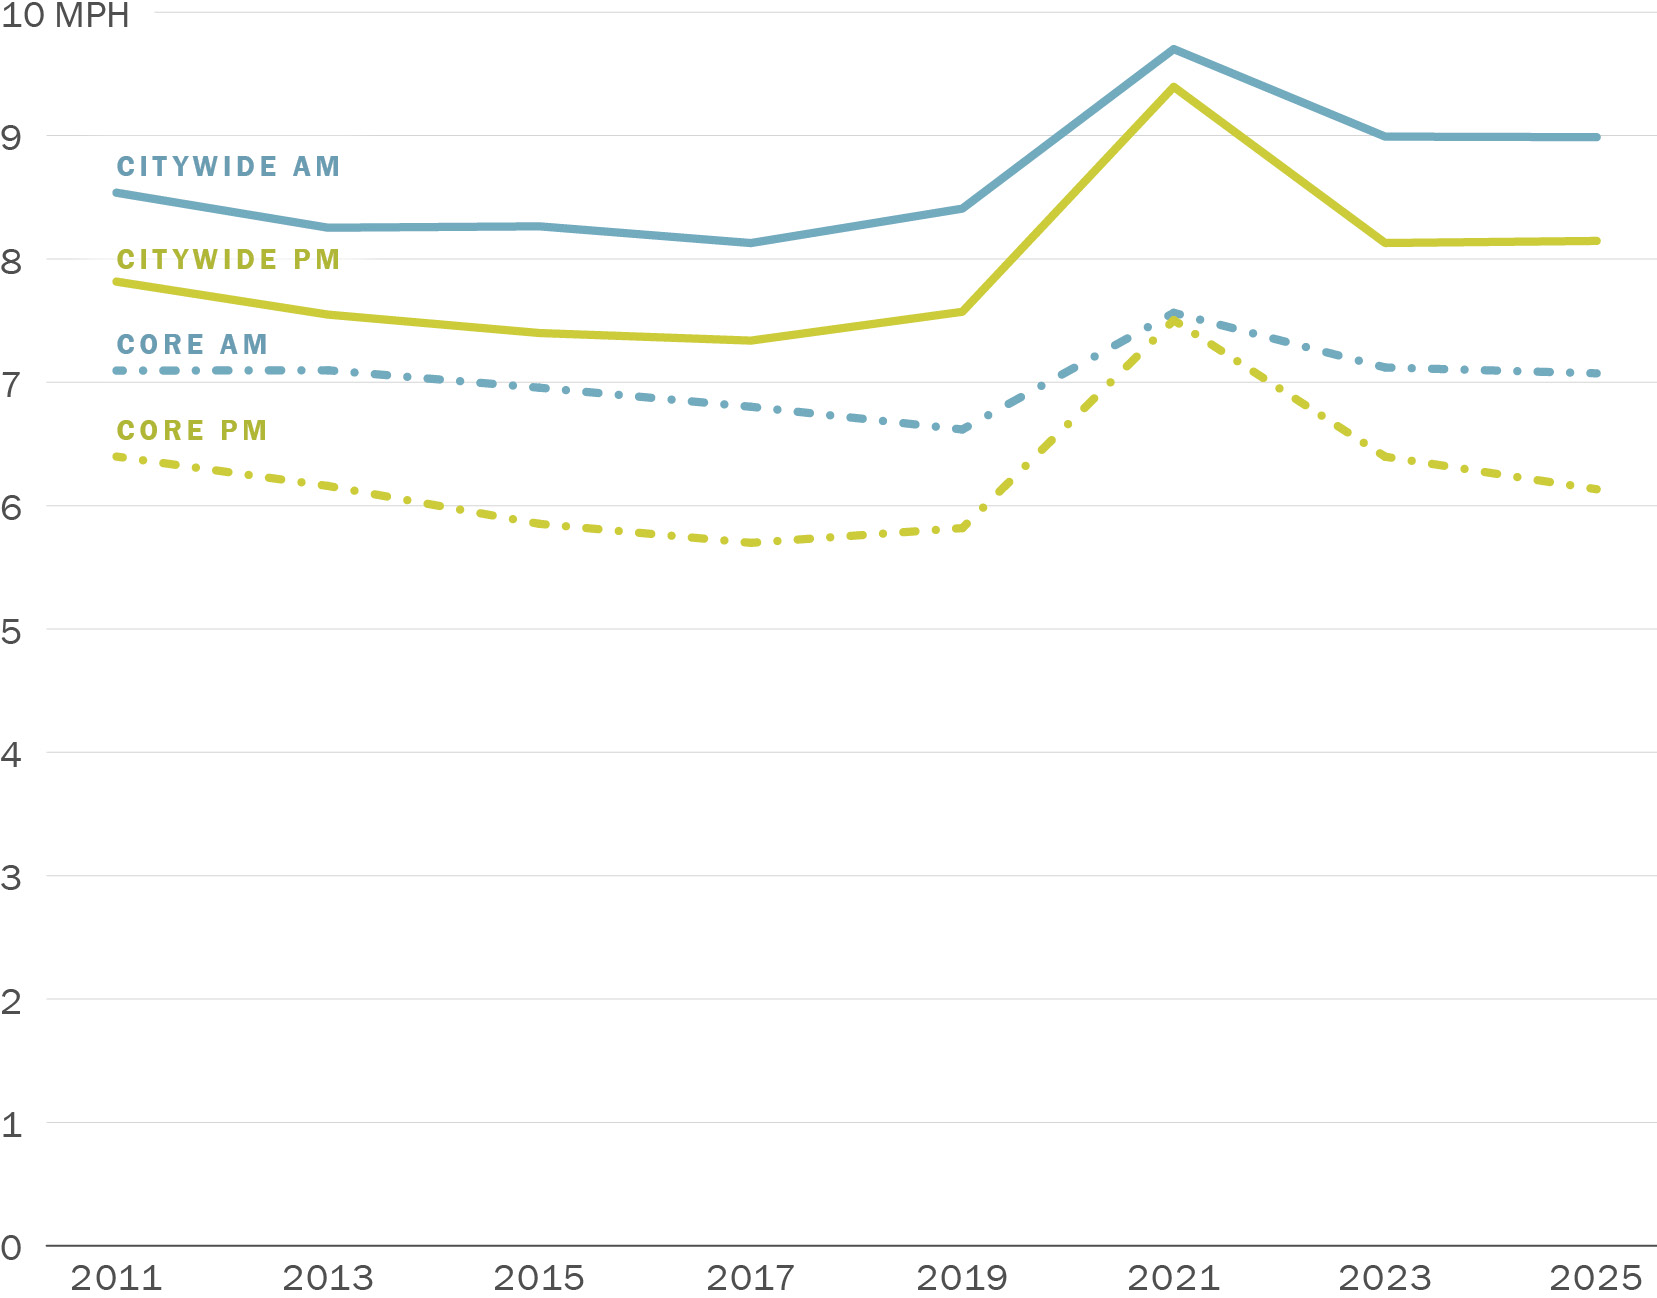
Between 2023 and 2025, average transit travel speeds on the CMP network for both the AM Peak and PM Peak stayed constant at 9.0 MPH and 8.1 MPH, respectively. This is a positive outcome, given the rise in vehicle traffic and multimodal activity over this period. Transit speeds in 2025 are still higher than that during pre-COVID. Table 4-5 shows the change in average transit speeds. Figure 4-17 illustrates average bus speeds on CMP segments in the AM Peak and PM Peak periods since 2011. Appendix 2 contains the full results from all transit segments.
|
CATEGORY |
Peak PERIOD |
TIME-MEAN TRAVEL SPEED |
||
|---|---|---|---|---|
|
2023 |
2025 |
% CHANGE |
||
|
Arterial |
AM |
9.0 |
9.0 |
−0% |
|
PM |
8.1 |
8.1 |
+0% |
|
Note: Downtown Core in this figure is defined to include streets east of Franklin/Gough Streets, and north of the Central Freeway and Mission Creek. It also includes the streets immediately surrounding the Octavia Boulevard entrance/exit of the Central Freeway
Download chart data (CSV)
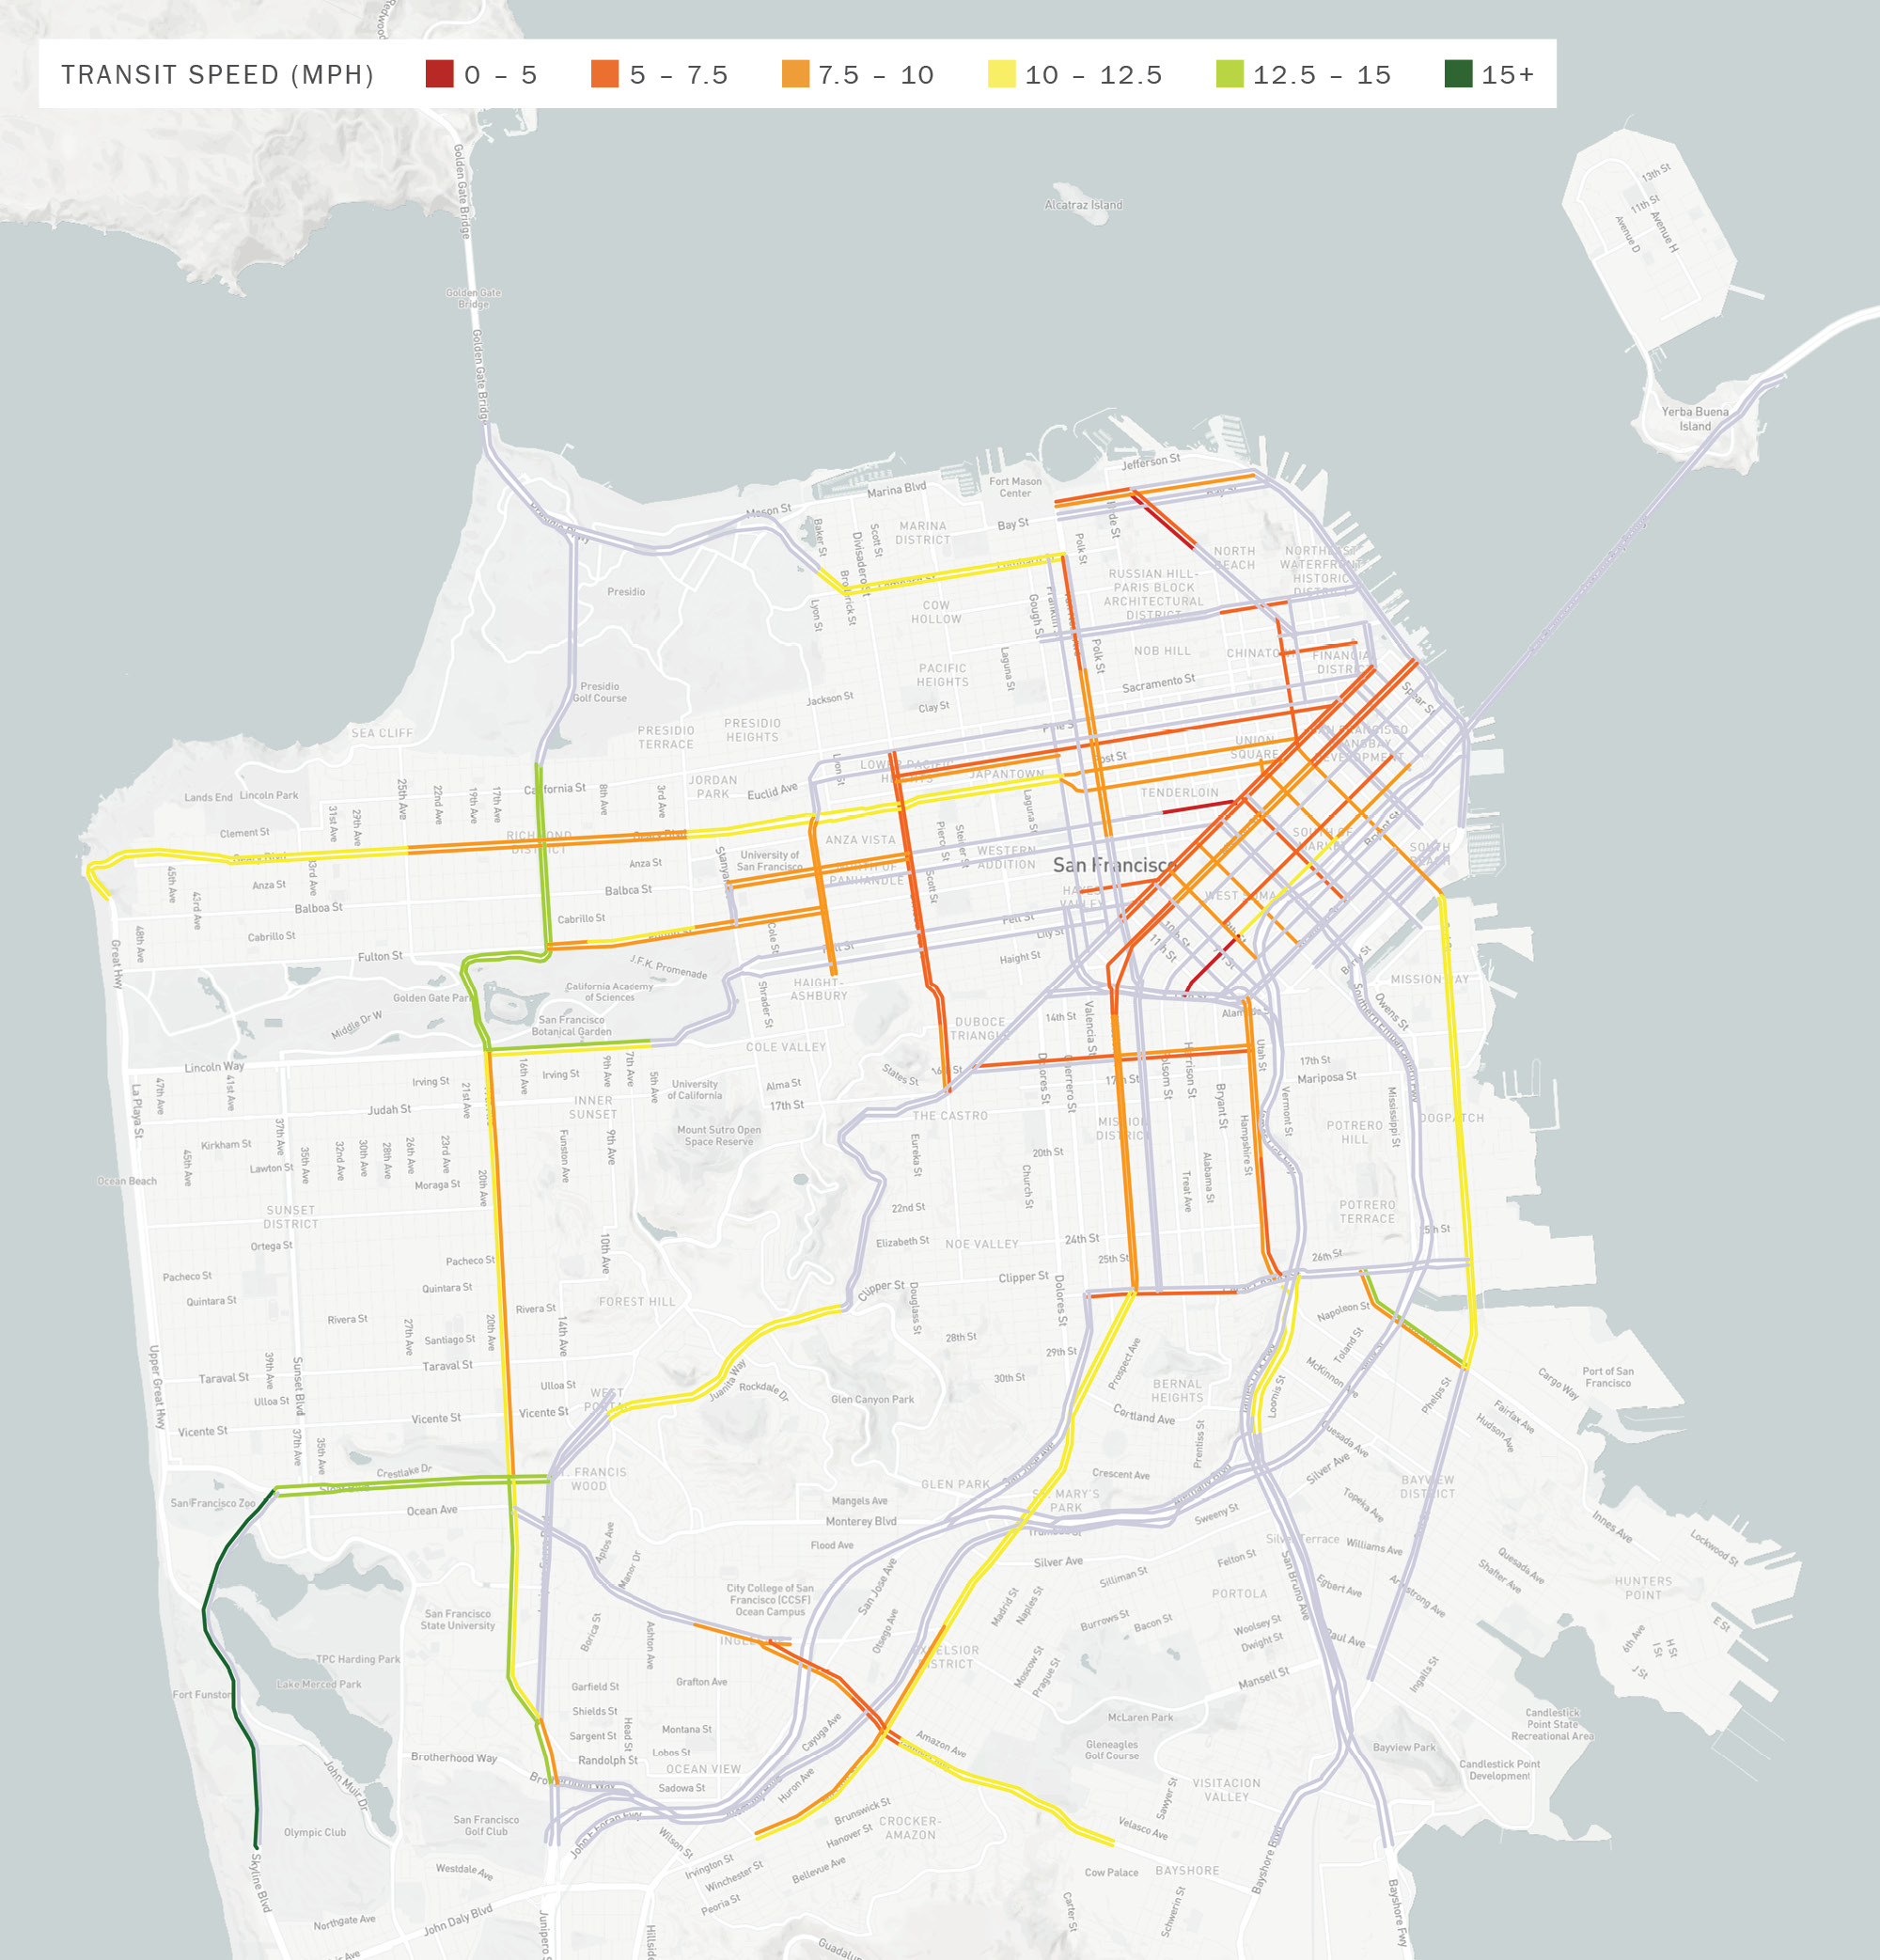
Table 4-6 and Table 4-7 shows CMP segments with the slowest transit speeds in the current CMP cycle. The slowest transit speed during the AM Peak period was 4.4 MPH on Turk from Market to Hyde. During the PM Peak period, the slowest transit speed was 3.7 MPH, also on Turk from Market to Hyde. 3% of the monitored CMP segments have a speed under 5 MPH in the AM Peak period, whereas 8% of the monitored CMP segments have a speed under 5 MPH in the PM Peak period.
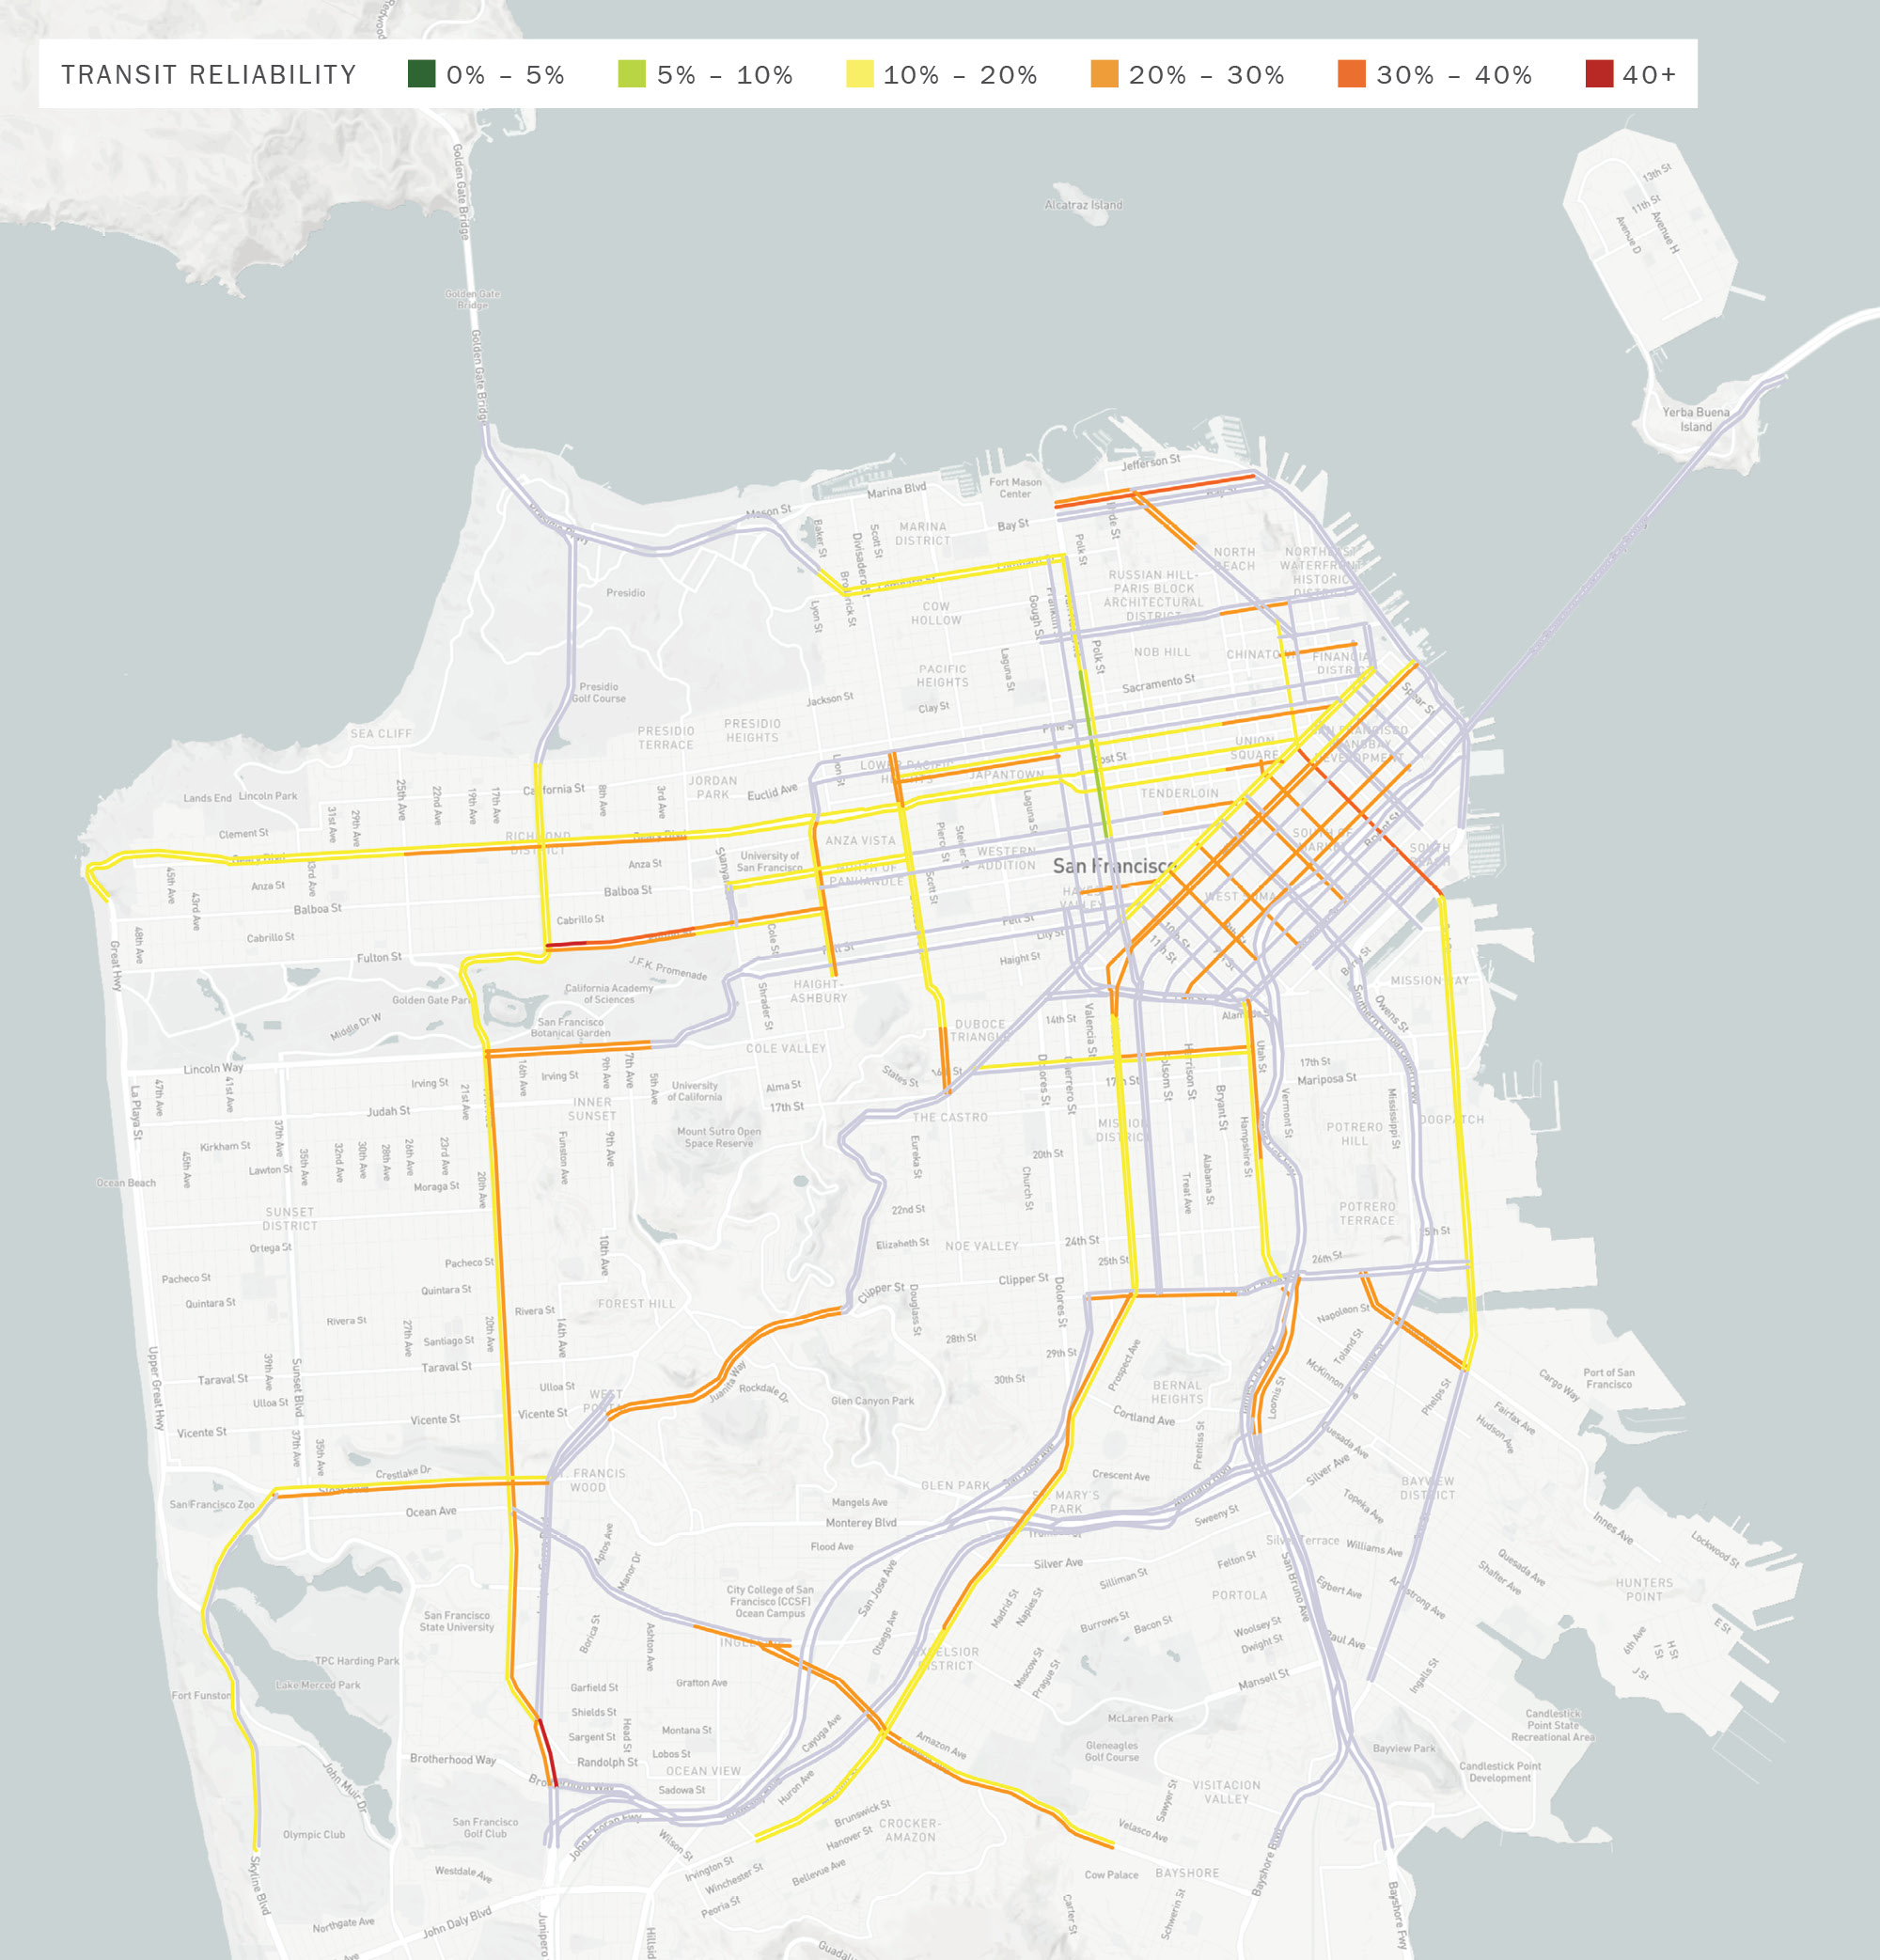
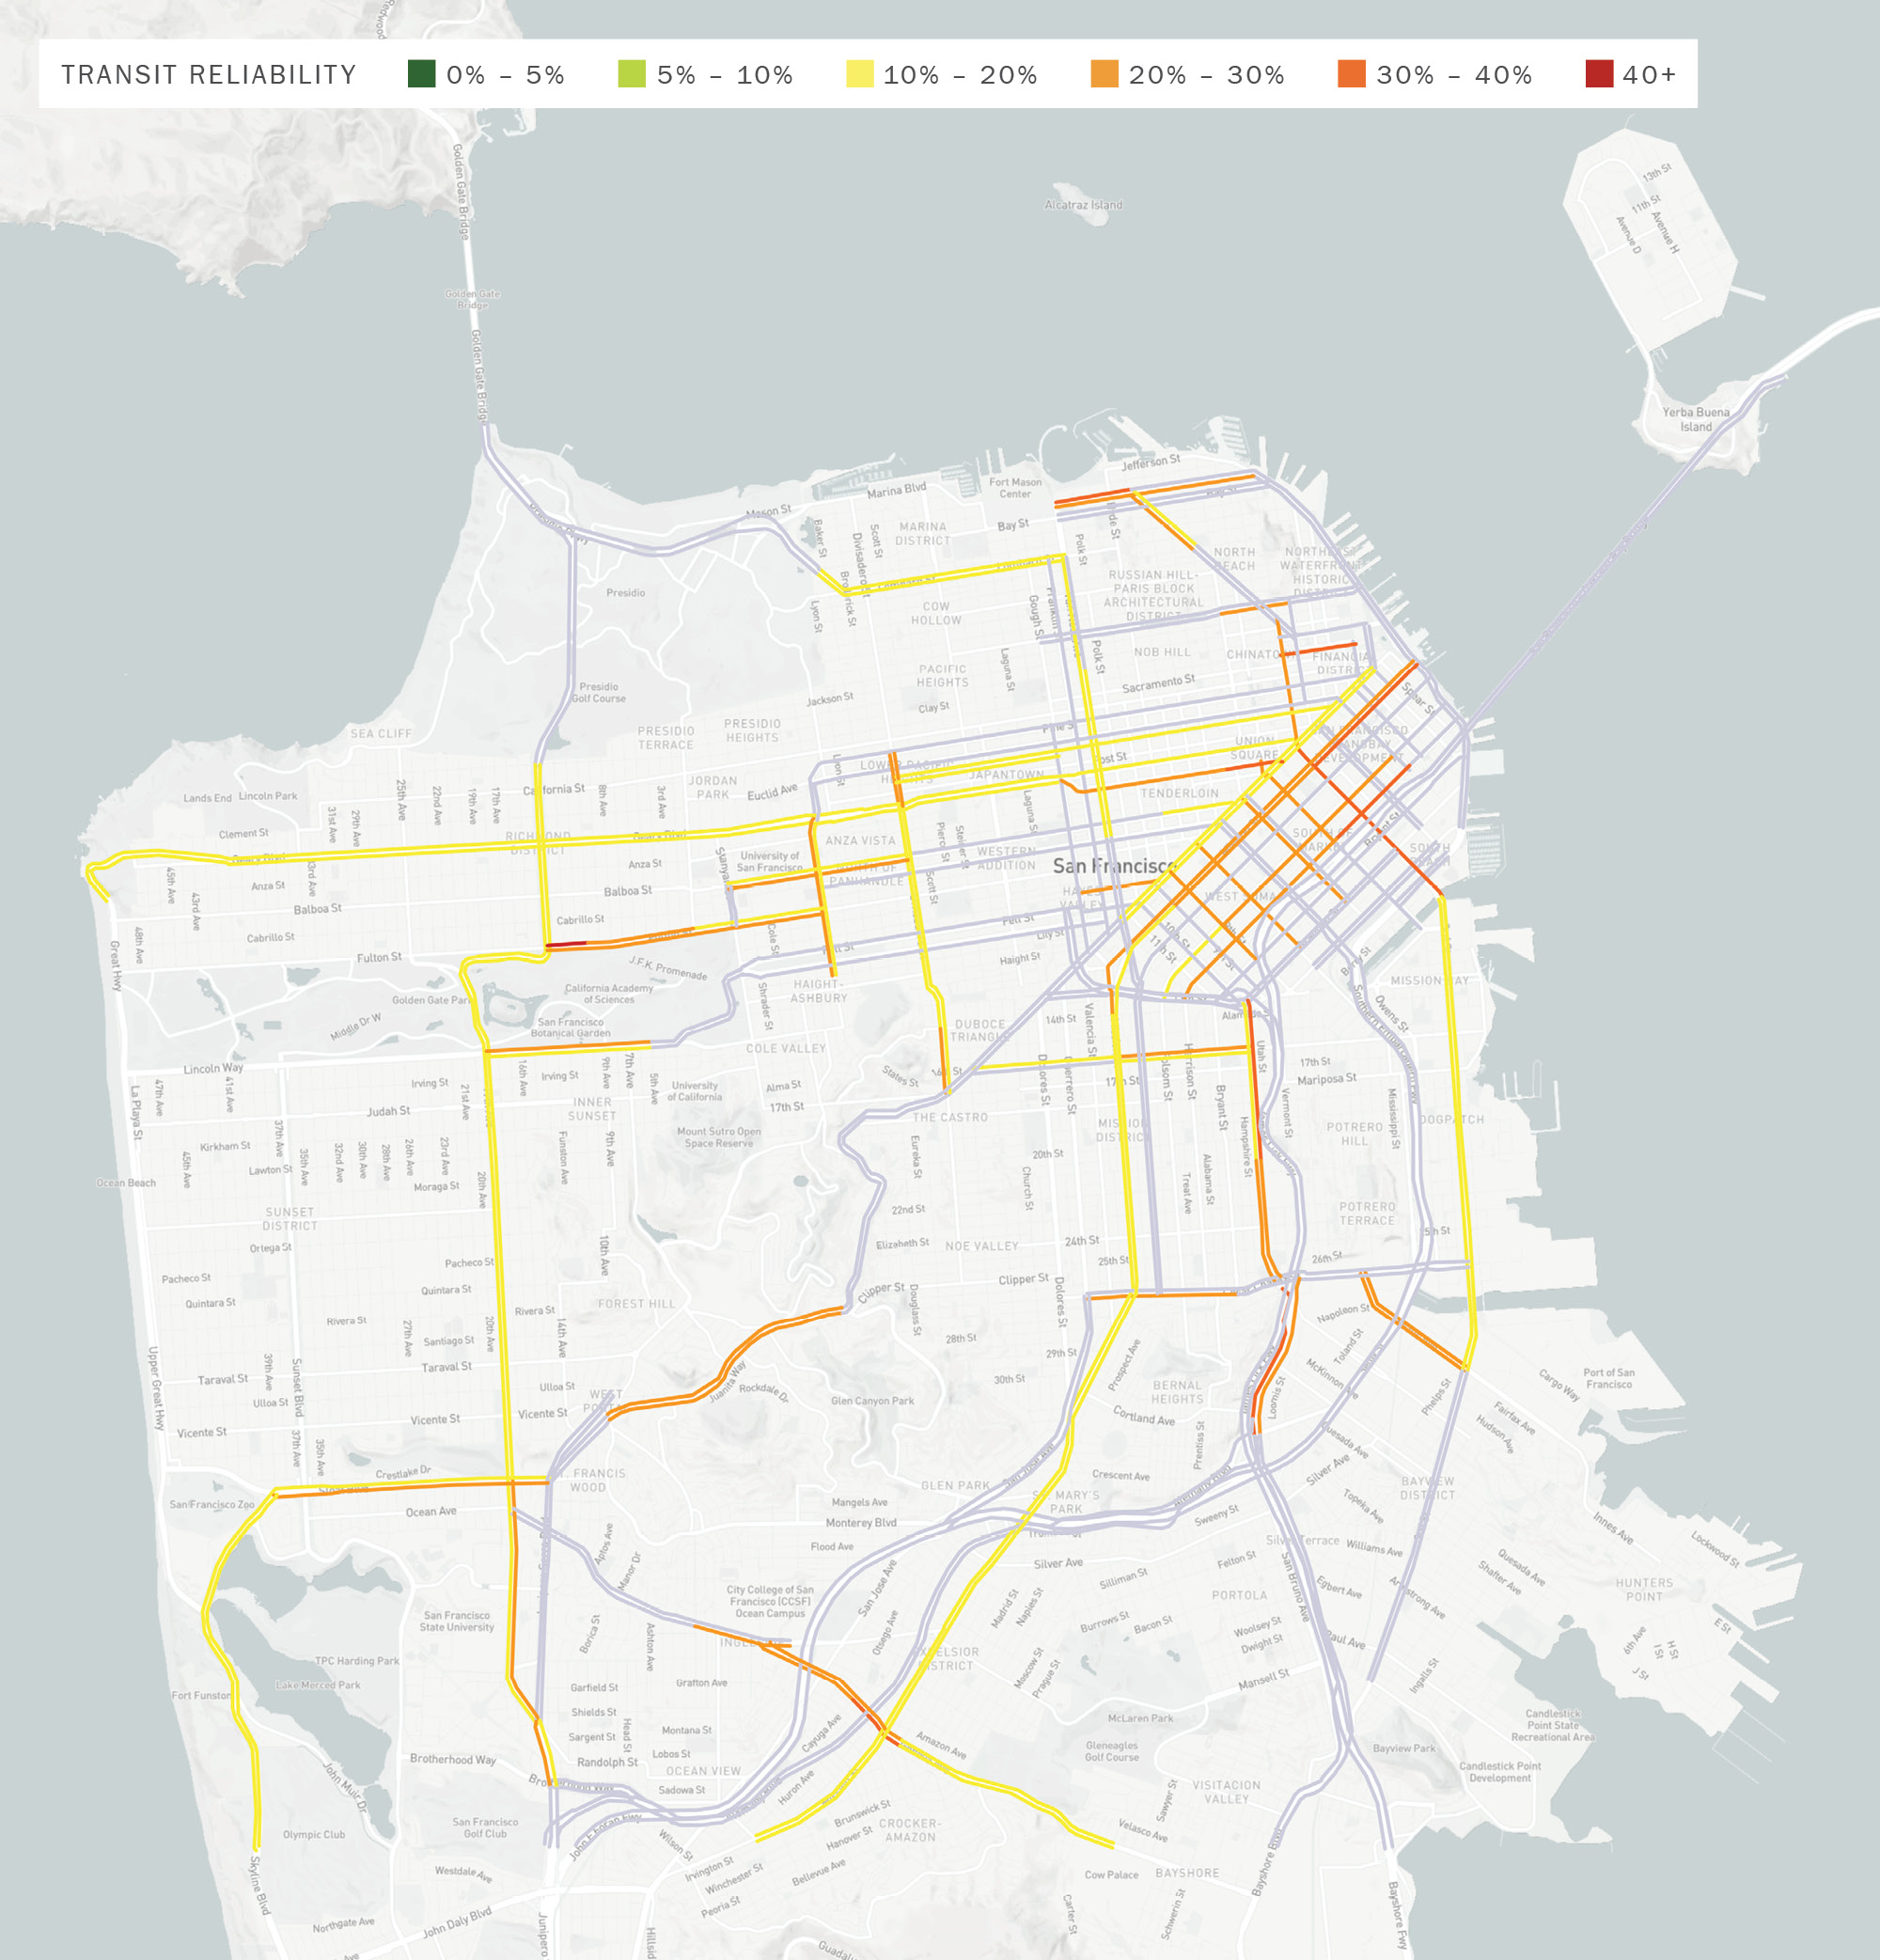
Table 4-8 and Table 4-9 shows the CMP segments with the greatest relative changes in average bus speeds since the last CMP cycle. Between 2023 and 2025, the largest percentage decrease in transit speeds was −43% for the AM Peak, whereas for the PM Peak it was −28%. Figure 4-18 and Figure 4-19 show maps of monitored transit speeds by segment for the AM Peak and PM Peak.

Beyond the average transit speed, San Francisco Municipal Transportation Agency’s (SFMTA) automatic passenger counter (APC) data were also used to calculate transit speed reliability (variability). A detailed description of the APC data collection and analysis methodology can be found in Appendix 2. The standard deviation and coefficient of variation of travel time provide indicators of how reliable transit vehicle travel times are for a given segment. The standard deviation provides an absolute measure of variability, and indicates in minutes how far from the mean speeds typically range. The coefficient of variation (CV) is calculated by dividing the standard deviation by the average speed, thereby normalizing the results to compare relative variability between faster and slower segments. The CV is expressed as a percentage of the mean speed. A lower percentage indicates more reliable transit speeds. As with transit travel times, this is a positive trend and may reflect benefits from a variety of transit priority investments and traffic management strategies that were implemented during this time.
Transit reliability has stabilized (i.e. variability stayed the same) since 2023, staying at the same levels (21%) observed in 2019 and 2023 for both the AM Peak and PM Peak (Table 4-10 and Figure 4-20). With the average transit speeds in 2025 at 9.0 MPH (AM Peak) and 8.1 MPH (PM Peak), a CV of 21% means that approximately 70% of the time, a 3 mile transit trip would take between 15.8 and 24.2 minutes for the AM Peak, and between 17.6 and 26.9 minutes for the PM Peak.
Segments with less reliable transit speeds (CV > 30%) are shown in Table 4-11 and Table 4-12. Figure 4-21 and Figure 4-22 show maps of transit reliability by segment for the AM Peak and PM Peak. Appendix 2 contains the full results from all transit segments.
|
2013 |
2015 |
2017 |
2019 |
2021 |
2023 |
2025 |
|
|---|---|---|---|---|---|---|---|
|
AM |
16% |
16% |
16% |
21% |
23% |
21% |
21% |
|
PM |
16% |
18% |
18% |
21% |
25% |
21% |
21% |
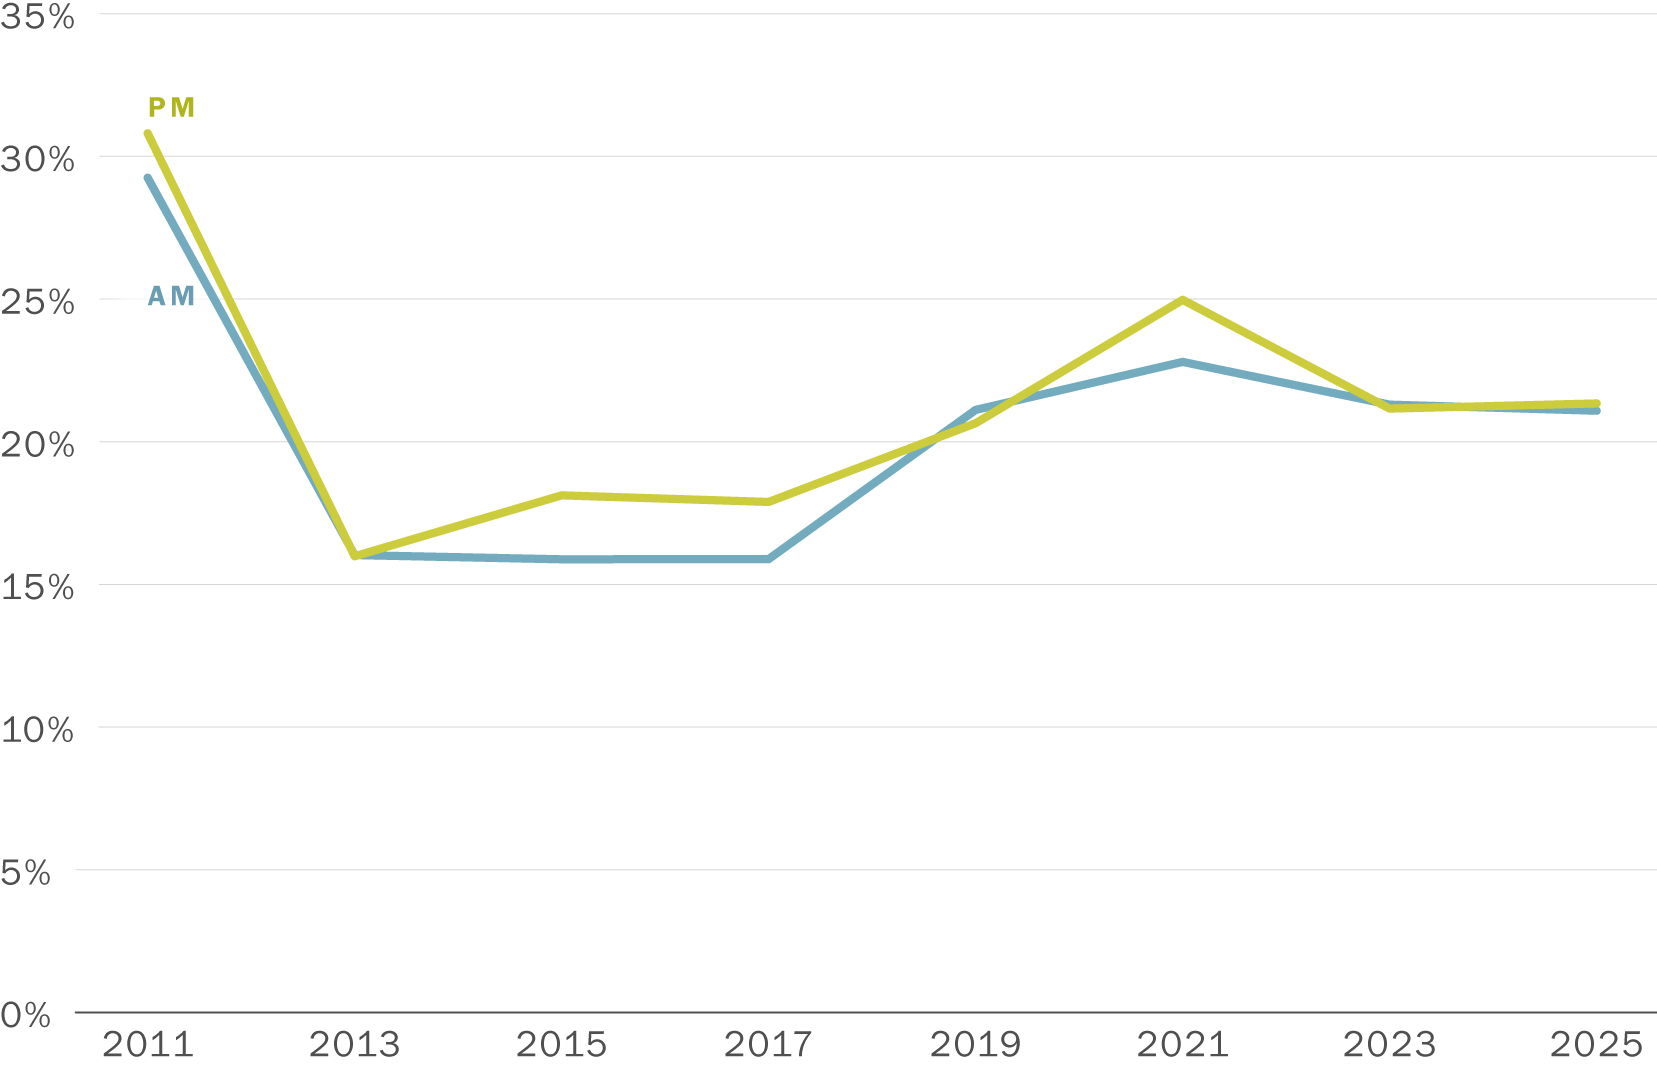
Download chart data (CSV)
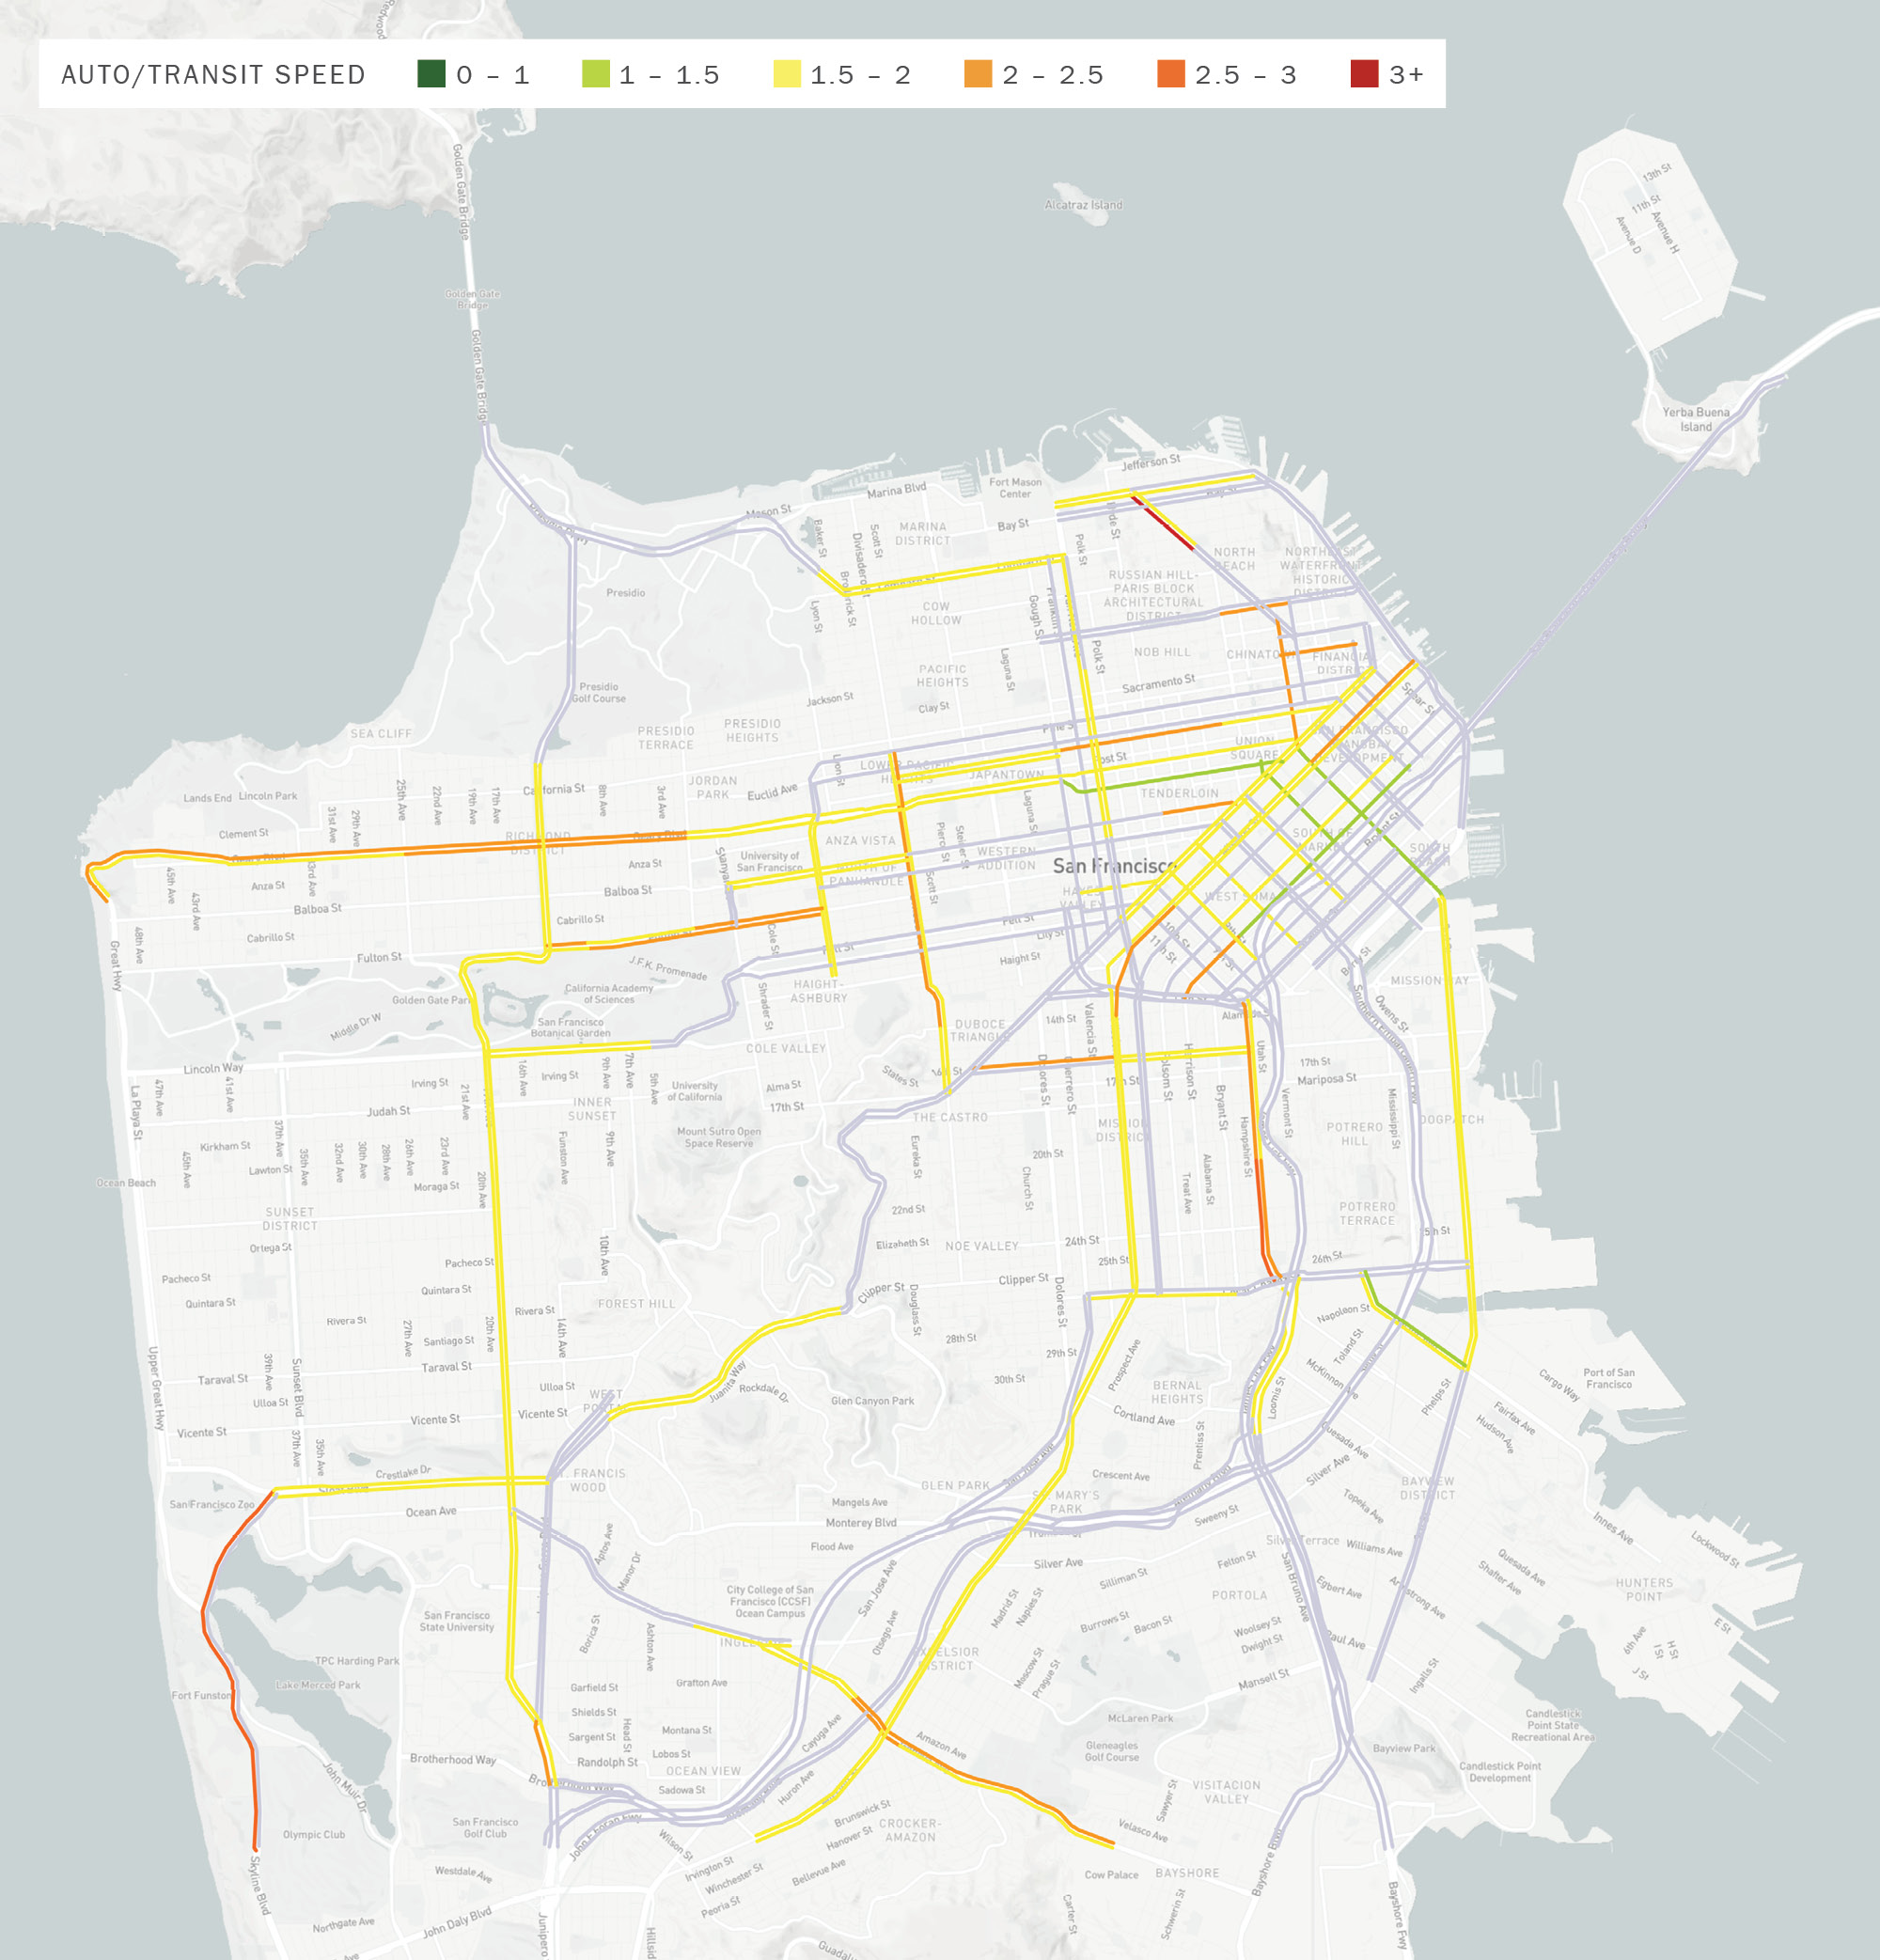
In order to assess the competitiveness of transit with driving, the ratio of auto to transit speeds is calculated by comparing auto to transit speeds on the portions of the CMP network for which Muni data was available. Roadway speeds are derived from the INRIX data used for LOS monitoring and transit speeds are derived from APC data. The APC dataset is from April and May of 2025, the same period as the roadway LOS monitoring effort. For each segment, the ratio of auto-to-transit speed was calculated. A ratio of 2 would indicate that, for a particular segment, auto speeds are twice as fast as transit speeds. The ratio had been improving between 2013 and 2019. However, the ratio worsened since the start of the COVID pandemic and has been hovering around 1.7 – 1.8 since 2021 (Table 4-13 and Figure 4-23). Due to the Fall 2023 data anomaly described in section 4.4.1, the auto-to-transit speed ratio for 2025 cannot be directly compared to 2023.
CMP Segments with auto to transit speed ratios above 2.4 are shown in Table 4-14 and Table 4-15. No monitored segment in the current cycle has an auto to transit speed ratio under or equal to 1 (which would mean that transit is at least as fast as autos).
Appendix 2 contains the full auto-to-transit speed results from all transit segments. Figure 4-24 and Figure 4-25 show maps of auto-to-transit ratios by segment for the AM Peak and PM Peak, respectively.
|
Time Period |
2013 |
2015 |
2017 |
2019 |
2021 |
2023 |
2025* |
|---|---|---|---|---|---|---|---|
|
AM |
2.07 |
1.77 |
1.67 |
1.59 |
1.82 |
1.73 |
1.79 |
|
PM |
2.12 |
1.72 |
1.66 |
1.61 |
1.77 |
1.72 |
1.80 |
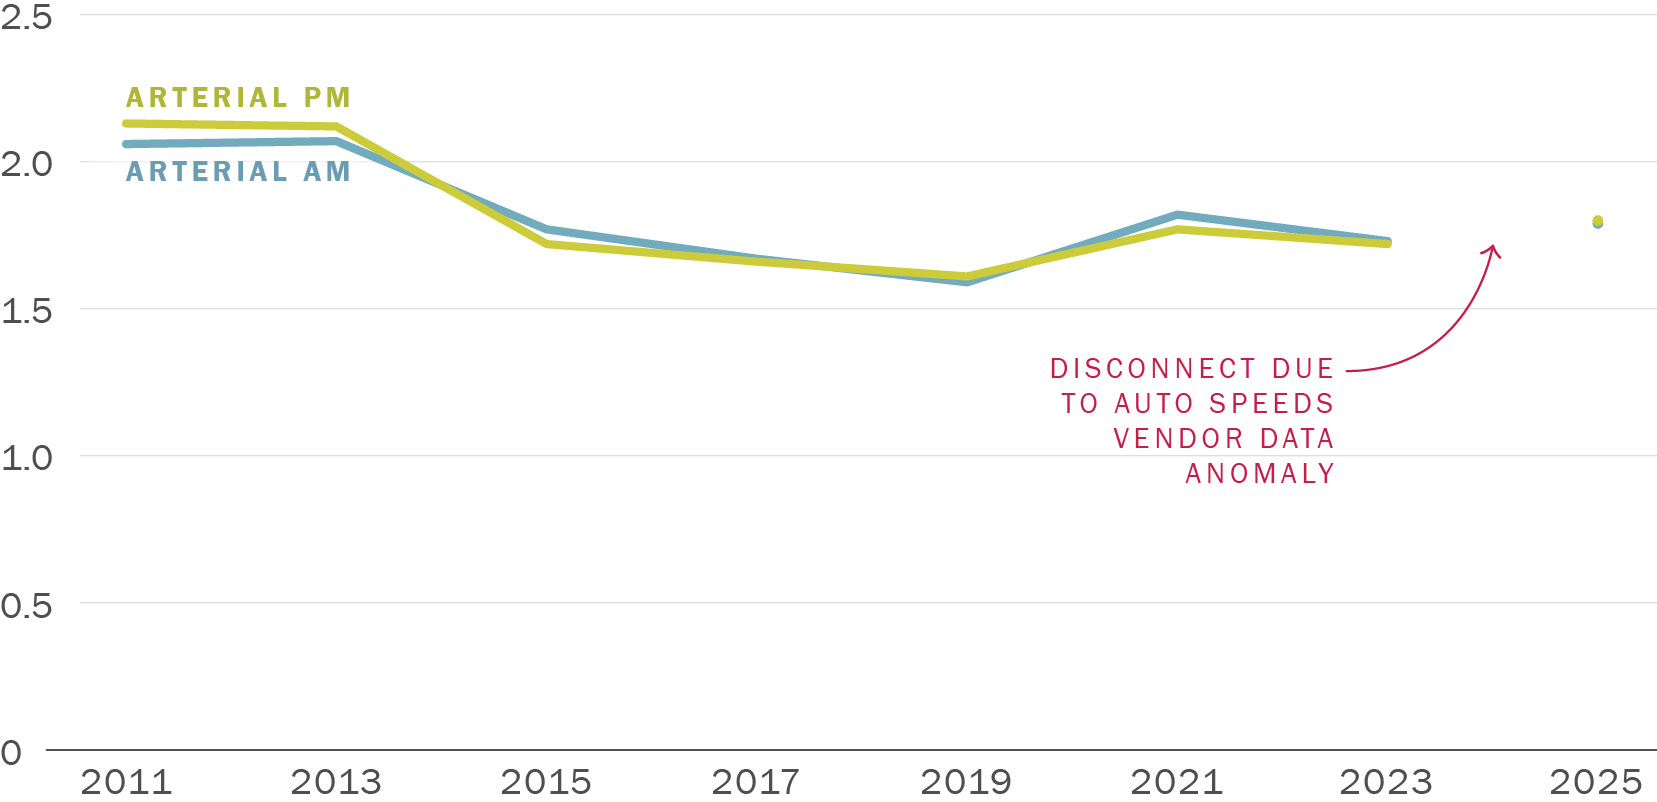
Download chart data (CSV)
Congestion on city streets is the outcome of several factors including the number of cars driving; the roadway capacity available; construction, lane blockages, and other special events; allocation of signal green-time to various competing modes and movements. Similarly, crowding on transit is also a result of several factors including the number of riders; vehicle size, frequency of service, origin-destination demand patterns. These factors can be roughly classified into supply-side and demand-side. In order to understand demand-side factors affecting San Francisco’s transportation system, and create a set of data that can be analyzed longitudinally by various modes, the Transportation Authority supported a multimodal volume monitoring program beginning with the 2015 CMP.
The City and County of San Francisco has placed a high priority on supporting walking and cycling/rolling modes (including bicycling, bike share and shuttles) to facilitate active and affordable means of travel. Unlike automobile and transit volumes, increasing volumes of pedestrian and bicycle traffic are a direct indicator of system performance because increased use of these modes alleviates, rather than causes, traffic congestion and transit crowding. Walking and bicycling are space-efficient, healthy, and environmentally beneficial ways to travel, and have minimal negative impact on surrounding communities. Little data has historically been available to measure the numbers of trips made by walking and bicycling, but City and County agencies are now working together to collect volume data for both modes on a more regular basis. Bicycle and pedestrian volumes are reasonable proxies for the “performance” of these non-motorized modes of travel. Auto volumes are also collected for relative comparison and to indicate trends.
Counts are collected at 29 mid-block locations (vehicle only)Of the 29 mid-block locations, 16 are one-ways and 13 are two-ways. and 14 intersections (vehicle, bicycle, and pedestrian) throughout the city (Figure 4-26). Vehicle-only mid-block mainline counts were collected over 3 continuous mid-week days (Tuesday to Thursday).To be consistent through all CMP cycles when multimodal counts have been collected (i.e. 2015 – 2025), we are re-reporting all collected data only for mid-week days (Tuesday to Thursday), so some numbers will be slightly different from what was reported in previous CMP cycles. The Transportation Authority collected weekend counts too (i.e. data collection from Tuesday to Sunday) at three of these mid-block locations during the CMP monitoring period. Intersection counts were conducted on a single day during the AM Peak (7:00 a.m. – 9:00 a.m.) and PM Peak (4:30 p.m. – 6:30 p.m.) periods for vehicles, bicycles, and pedestrians. The biennial collection of multimodal counts at a fixed set of locations is expected to provide information about long term performance trends just like LOS monitoring.
The following three sections detail the results of the multimodal volume monitoring by mode (vehicle, bicycle, and pedestrian). Refer to Appendix 3 for further details.

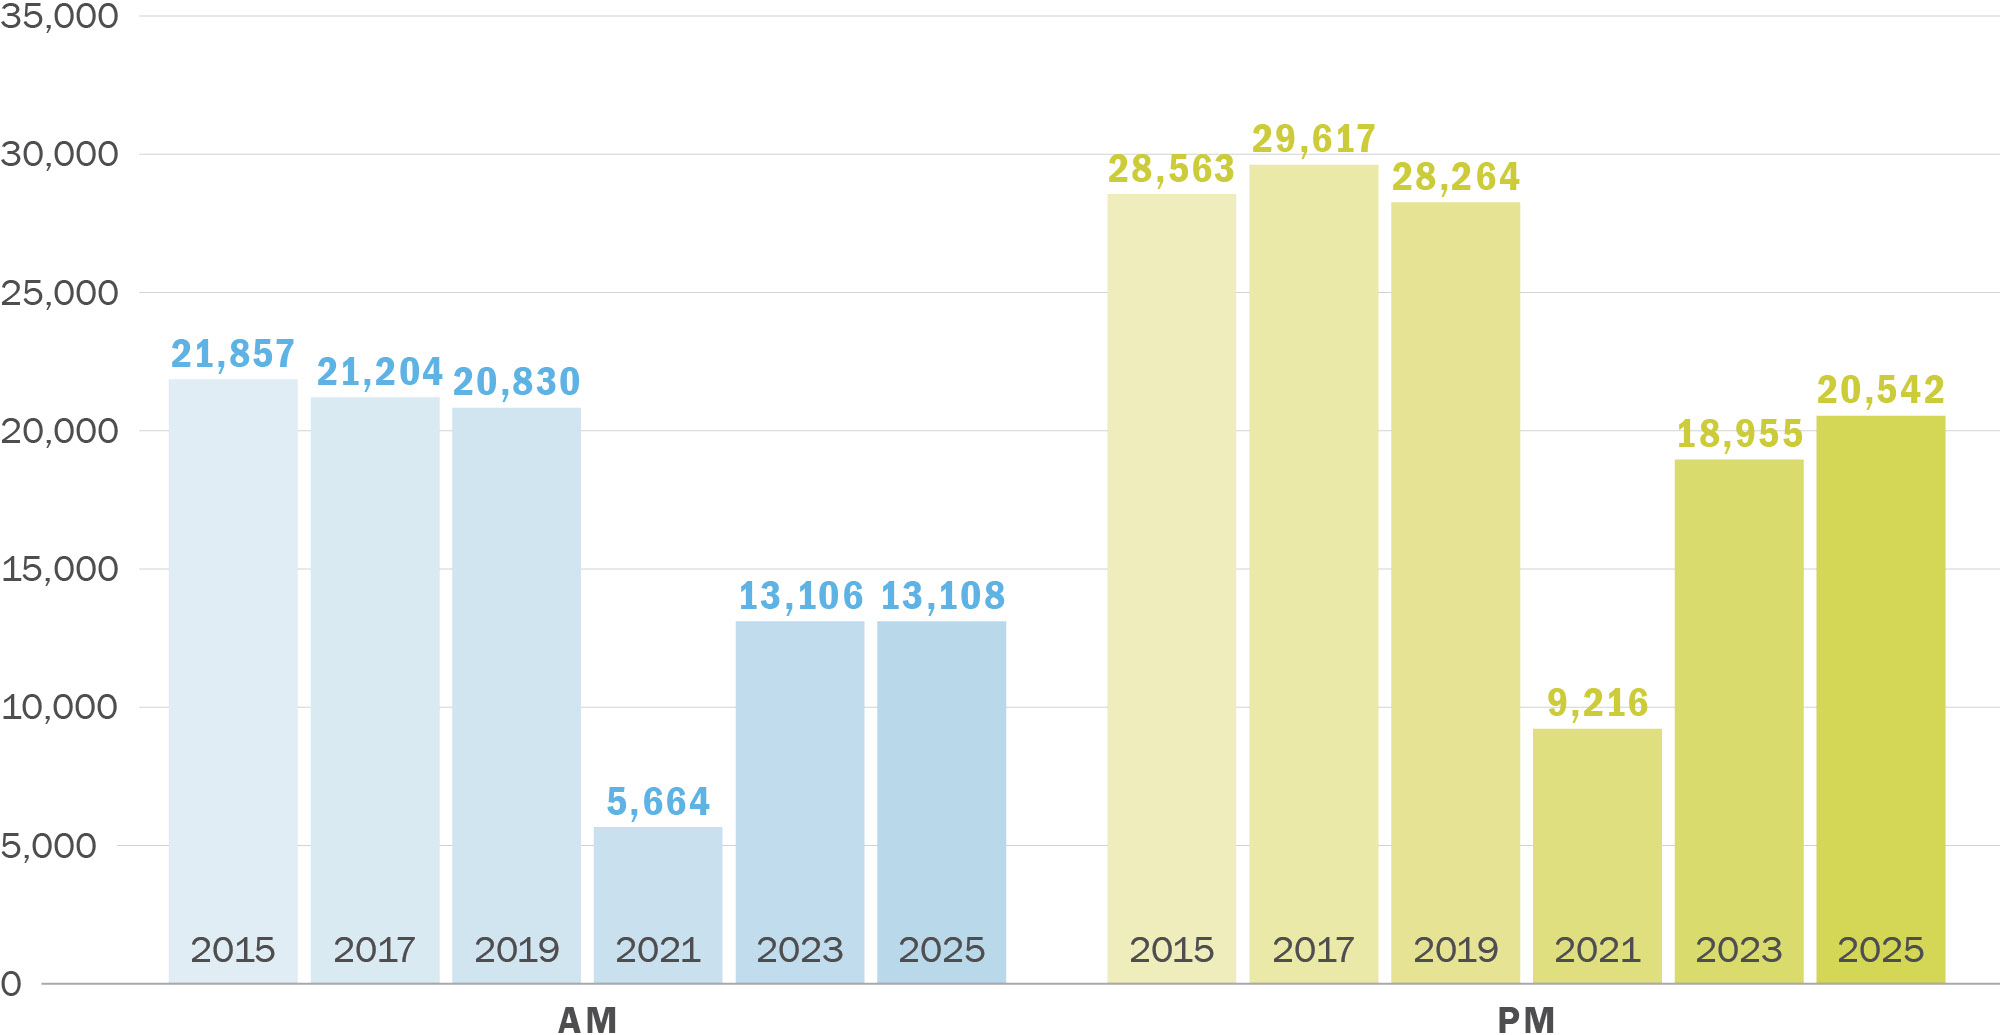
Vehicle counts are collected at both intersections and mid-block locations. The mid-block counts were processed to obtain the typical weekday average peak traffic and average daily traffic (ADT) for each location and direction. These are then summed up for each CMP year (Figure 4-27 and Figure 4-28). Total vehicle counts traversing through all intersection count locations during the AM Peak and PM Peak on the day of collection are shown in Figure 4-29.
Mid-block mid-week average daily traffic continued to increase between 2023 and 2025 (+5%), reaching 92% of pre-COVID pandemic (2019) levels. Mid-block mid-week traffic increases display similar patterns for the AM Peak and PM Peak. For the AM Peak, traffic volumes increased by 12% between 2021 and 2023, and by another +5% between 2023 and 2025, reaching 88% of pre-COVID pandemic (2019) levels. For the PM Peak, traffic volumes increased by +9% between 2021 and 2023; the increase slowed to +3% between 2023 and 2025, reaching 92% of pre-COVID pandemic (2019) levels. At intersections, AM Peak vehicle counts continue to increase (+6%) between 2023 and 2025, whereas PM Peak vehicle counts actually show a decrease (−3%). For both sets of vehicle counts, the gap between AM Peak and PM Peak counts is narrowing. The trendlines may also suggest that the ongoing vehicular traffic decrease observed from 2015 to 2019 is continuing past the COVID pandemic.A data error in 2023 midblock traffic counts was discovered that resulted in lower AM Peak period counts. This error is corrected in the 2025 CMP.
Note: Data collected April – May biennially at the same locations, counts shown for the bars are summed over all 29 locations and directions, whereas the white line within each bar only shows counts summed over 28 locations and directions (excluding counts from Van Ness between California and Pine, where no data were collected in 2017).
Download chart data (CSV)
Note: Data collected April – May biennially at the same locations, counts shown for the columns are summed over all 29 locations and directions, whereas the line within each column only shows counts summed over 28 locations and directions (excluding counts from Van Ness between California and Pine, where no data were collected in 2017).
Download chart data (CSV)
Note: Data collected April – May biennially at the same locations, counts shown are summed over all locations.
Download chart data (CSV)
SFMTA has conducted citywide bicycle counts at key intersections and corridors since 2006, and the SFMTA reports can be found at sfmta.com/bicycle-ridership-data. In addition to SFMTA, SFCTA has continued to collect manual bike counts as part of its multimodal counts effort at intersection locations since 2015 (Figure 4-30). Bicycle counts were recorded for 2 hours each in the AM Peak (7:00 a.m. – 9:00 a.m.) and PM Peak (4:30 p.m. – 6:30 p.m.) periods at 14 intersections around the city in April – May 2023.
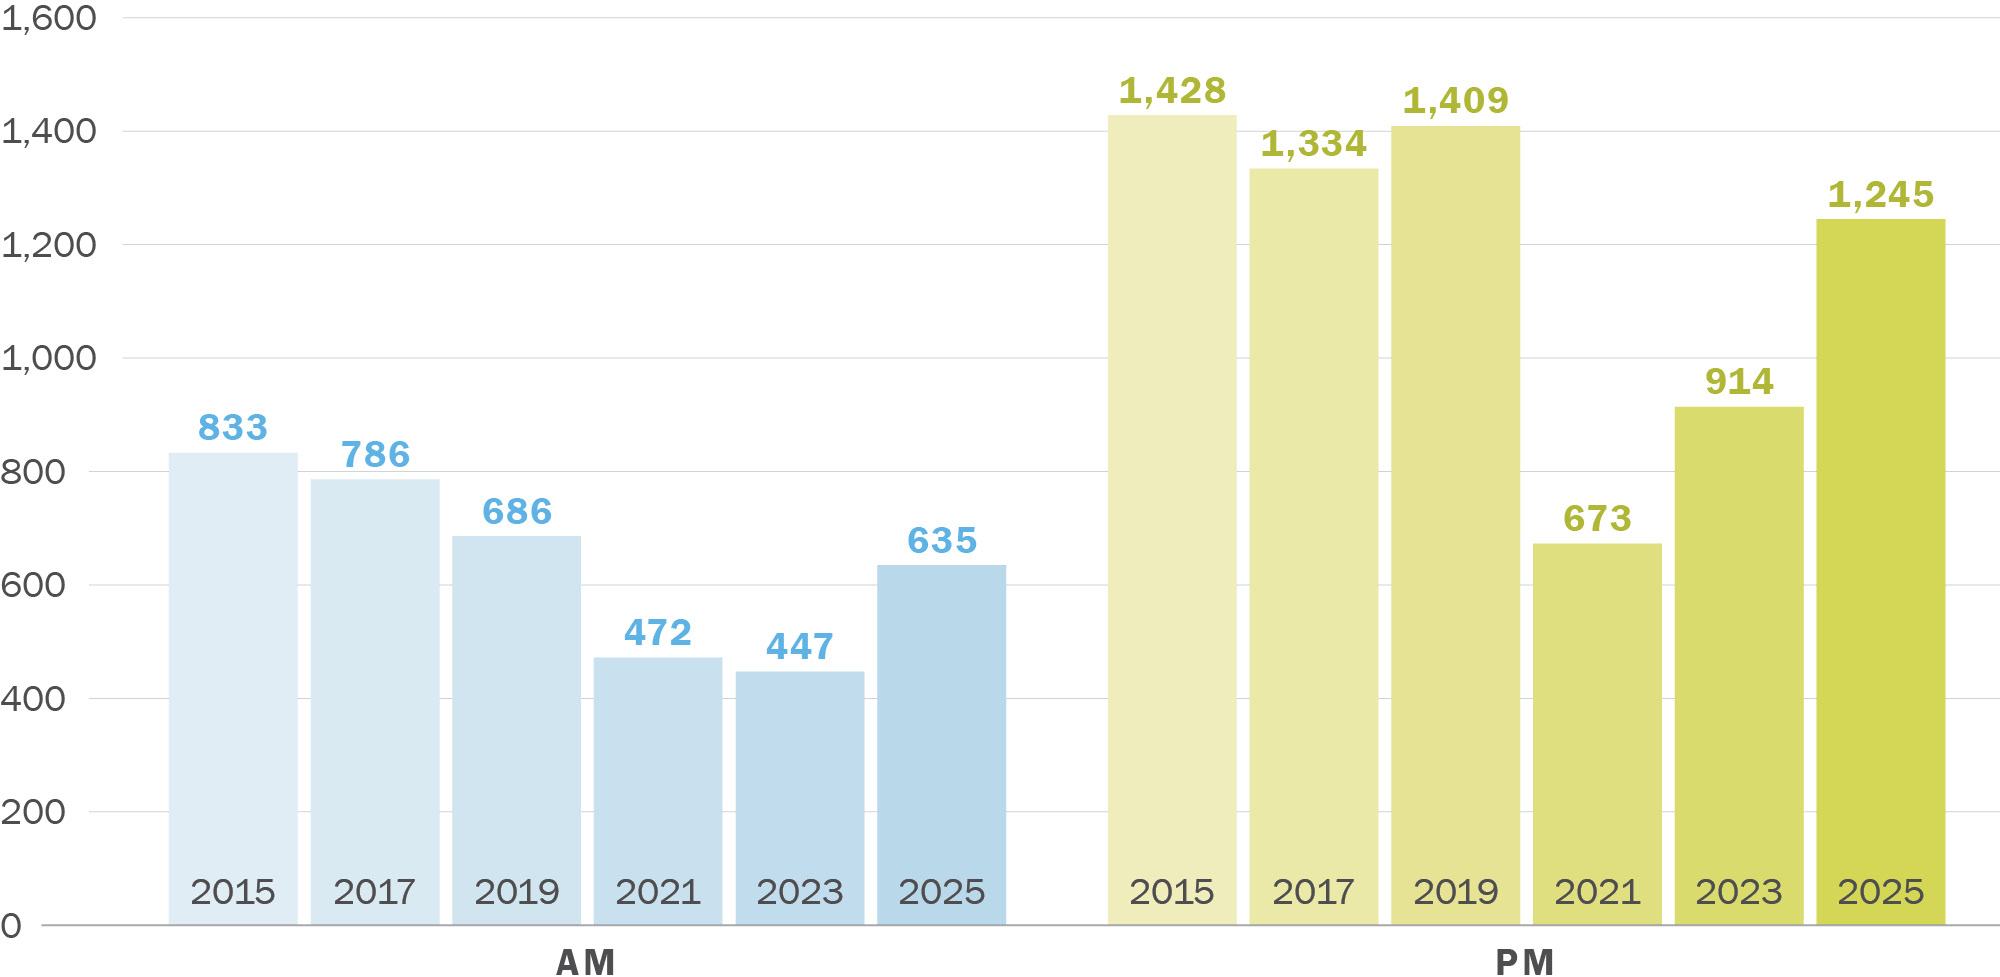
In contrast to vehicle counts, bicycle intersection counts show a stronger recovery in the PM Peak than the AM Peak. Bicycle counts showed a particularly strong increase between 2023 and 2025 of +42% for the AM Peak and +36% for the PM Peak.
Note: Data collected April – May biennially at the same locations, counts shown are summed over all locations.
Download chart data (CSV)
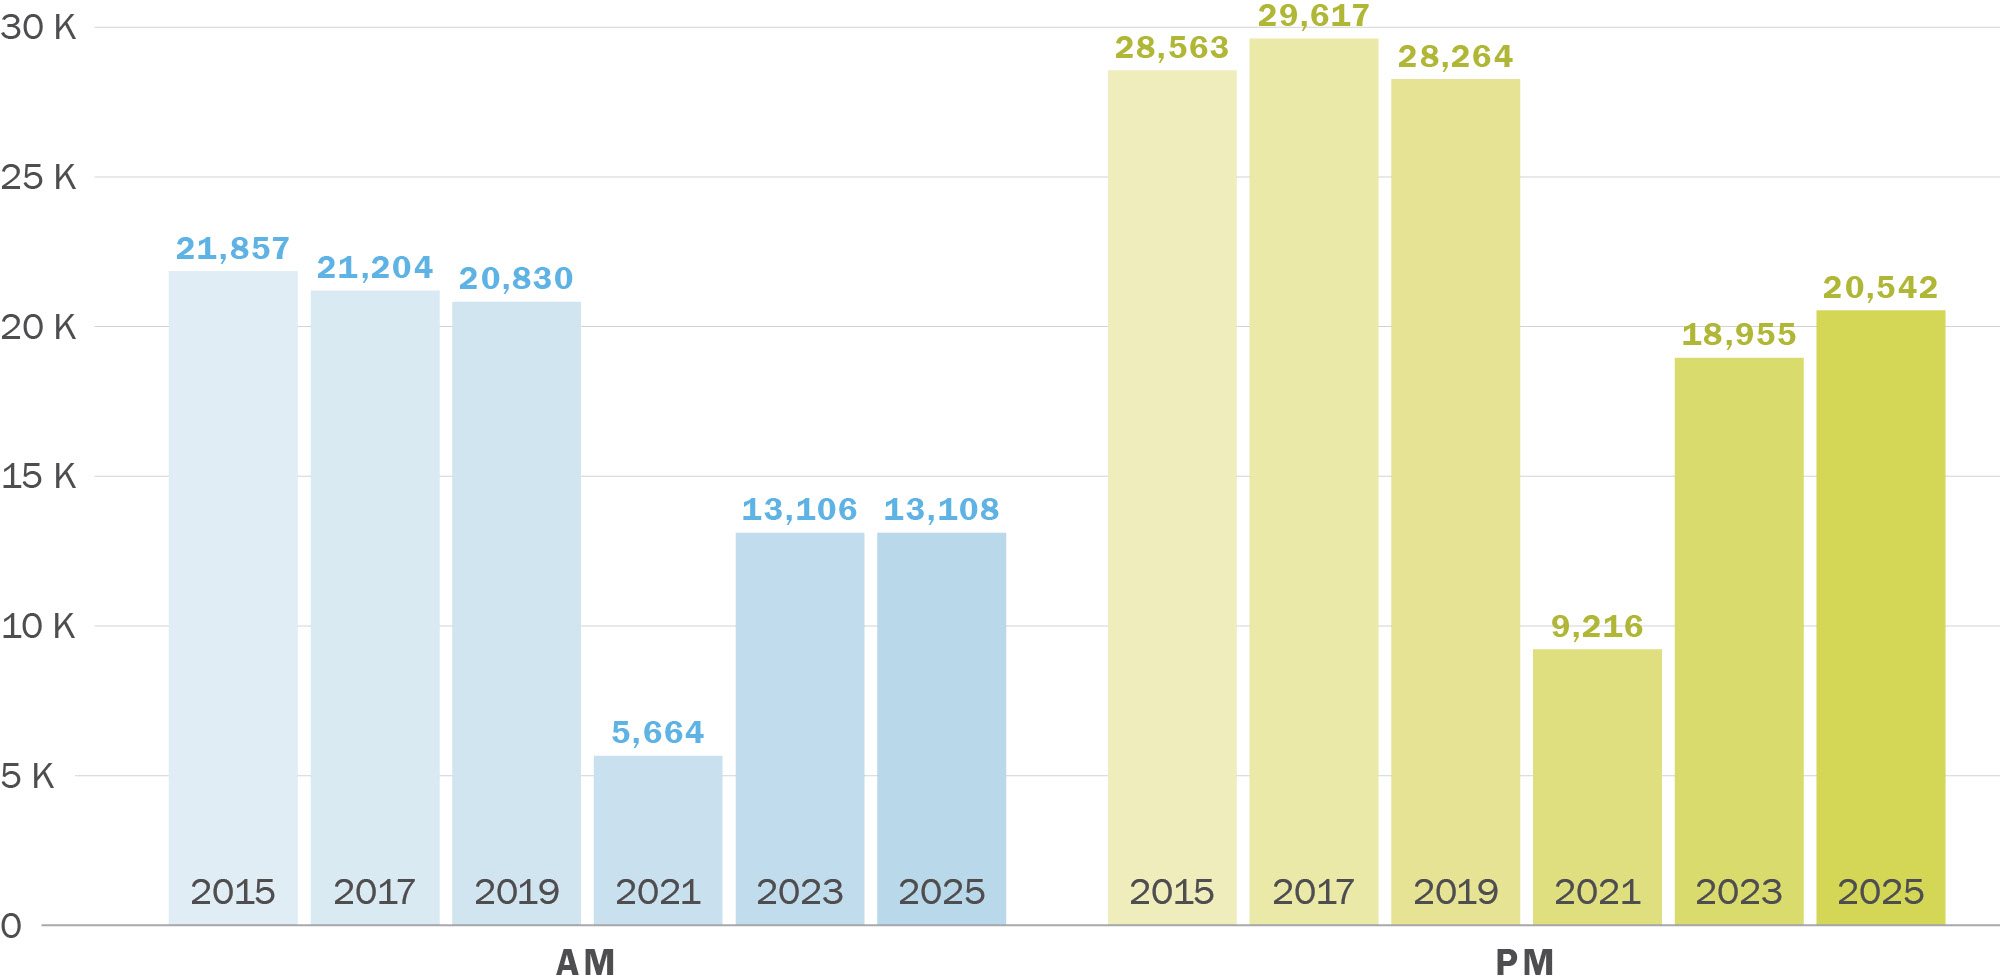
In addition to vehicle and bicycle counts, pedestrian counts have also been collected longitudinally since 2015 at the same intersections for the AM Peak and PM Peak (Figure 4-31). Intersection pedestrian counts stayed constant (+0%) between 2023 and 2025 for the AM Peak, standing at 63% of pre-COVID pandemic (2019) levels. The counts in the PM Peak showed a modest increase (+8%), though still remaining at only 73% of pre-COVID pandemic (2019) levels.
Note: Data collected April – May biennially at the same locations, counts shown are summed over all locations.
Download chart data (CSV)
A screenline is an imaginary line that divides an area into two sections. It is usually defined in such a way that a given roadway crosses it only once. Counts are conducted on roadways at the screenline to understand traffic flow patterns between the two sections. Vehicle volumes at two screenlines are reported during the AM Peak (7:00 to 9:00 a.m.) and PM Peak (4:30 to 6:30 p.m.) periods by processing data from Caltrans Performance Measurement System (PeMS) and Bay Area Toll Authority (BATA). One screenline is across the Bay Bridge and the other is at the San Mateo county line on the US-101 and I-280 freeways. BATA only provides Westbound counts on the Bay Bridge, whereas PeMS provides counts in both directions at the San Mateo county line.
Figure 4-32 shows westbound Bay Bridge vehicle volumes collected by the Bay Bridge Toll Authority (BATA). Before the COVID pandemic, peak period westbound Bay Bridge volumes have been slowly decreasing from 2015 to 2019. These volumes dropped in 2020 due to the pandemic. In 2021, westbound Bay Bridge volumes nearly returned to 2019 levels for both the AM Peak and PM Peak. Since 2021, westbound Bay Bridge volumes have declined from 2021 volumes in the AM Peak and held steady in the PM Peak (at around 12,000 crossings).The numbers may differ slightly from what was reported in the CMP 2023 report because BATA provided revised Bay Bridge crossing volumes, and the numbers reported in the CMP 2023 report were actually averages over the full week (including weekends).
Figure 4-33 shows the total average peak period volumes on US-101 and I-280 freeways at the San Mateo county line. The volumes at this screenline peaked in 2023 and declined slightly between 2023 and 2025.
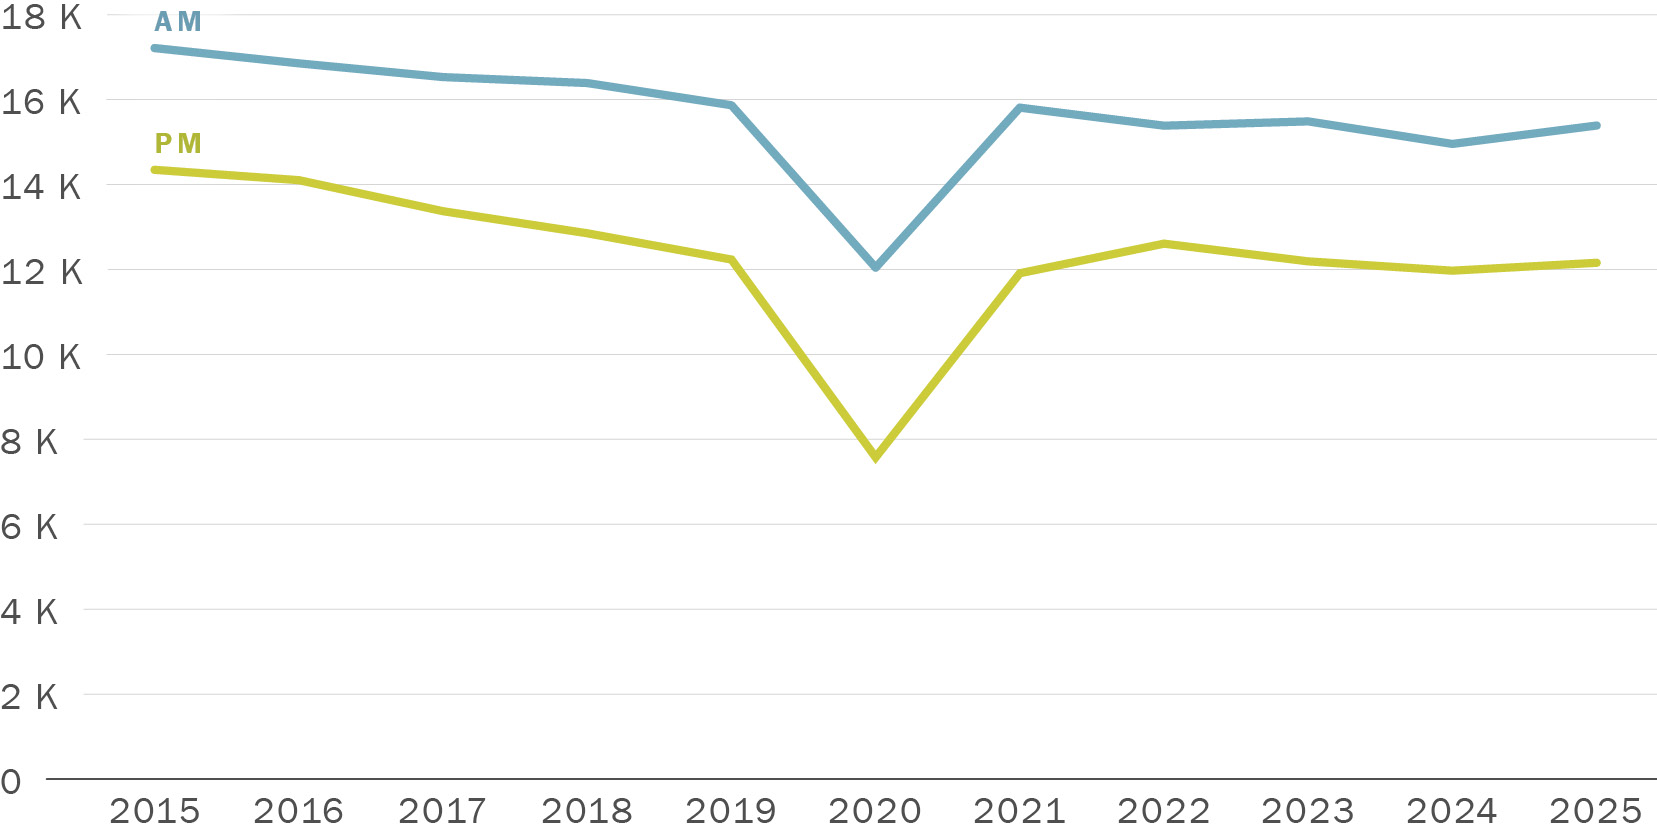
Source: BATA
Download chart data (CSV)
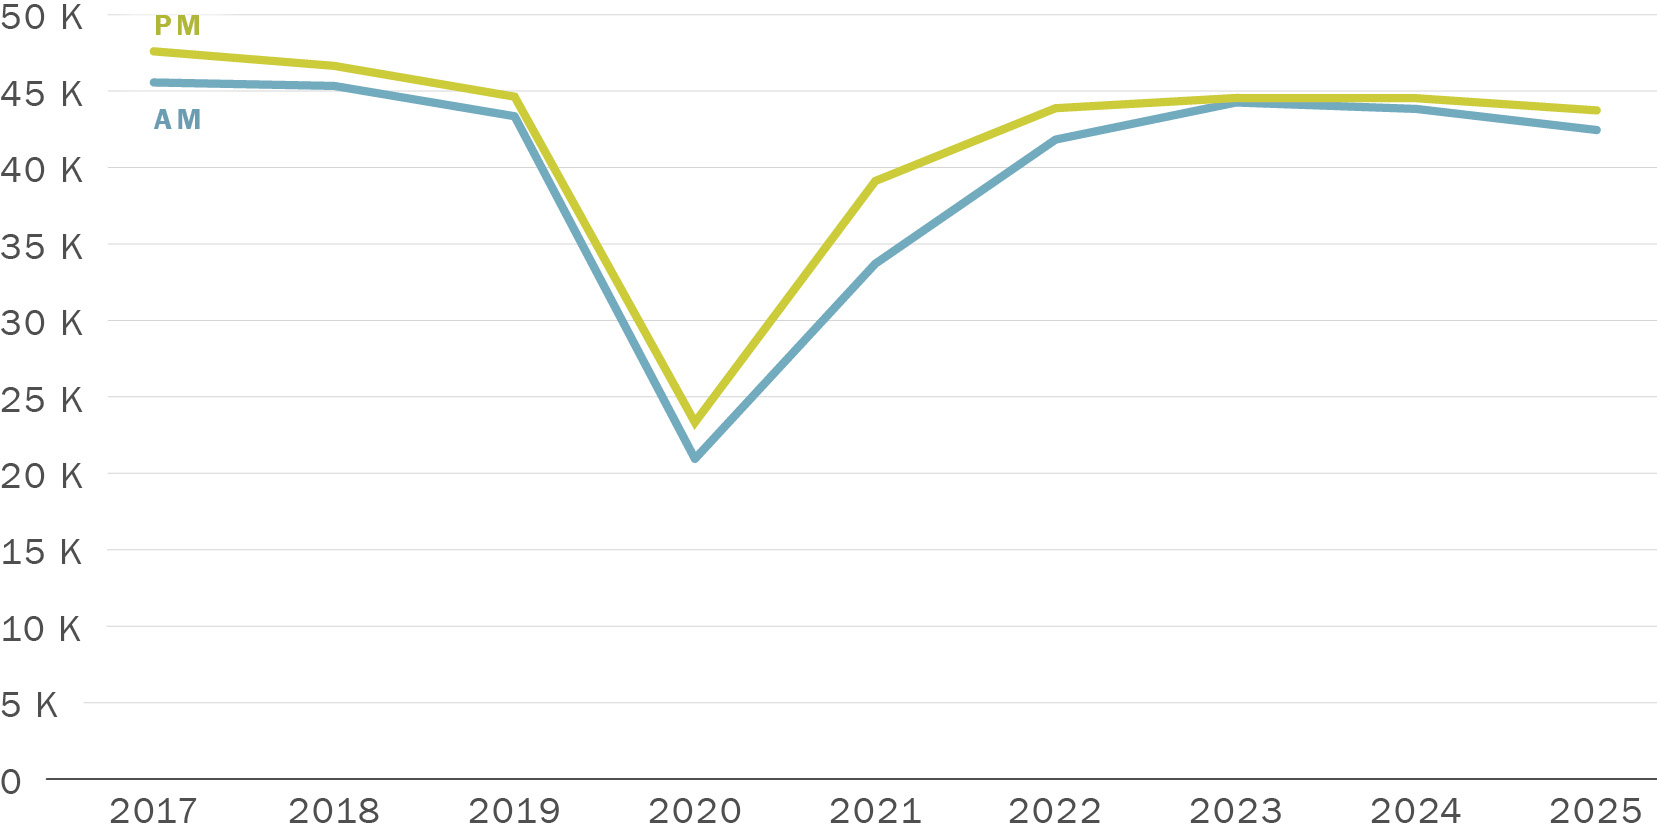
Source: Caltrans PeMS
Note: Sensor data which are not directly observed (i.e. imputed volumes) are excluded
Download chart data (CSV)
The extent and connectivity of the walking and biking networks are important metrics of non-motorized transportation performance. Comprehensive networks that allow people walking and biking to travel easily and safely between destinations are essential to encourage non-motorized travel as an alternative to driving and contributing to traffic congestion.
Table 4-16 summarizes the length of bicycle facilities by class. As of June 2025, the completed network included 467 miles of bike routes, of which 18% were Class I paths and 29% were Class II designated bicycle lanes. About 43% of bikeways are Class III signed routes in shared lanes, many of which have wide shoulders or are marked with sharrows. Recently, SFMTA has been prioritizing the conversion of the existing network to higher-quality facilities rather than expanding the network itself. This mileage is not fully inclusive of Slow Streets (28 miles as of 2025), which overlaps partially with the bike network presented in Table 4-16.
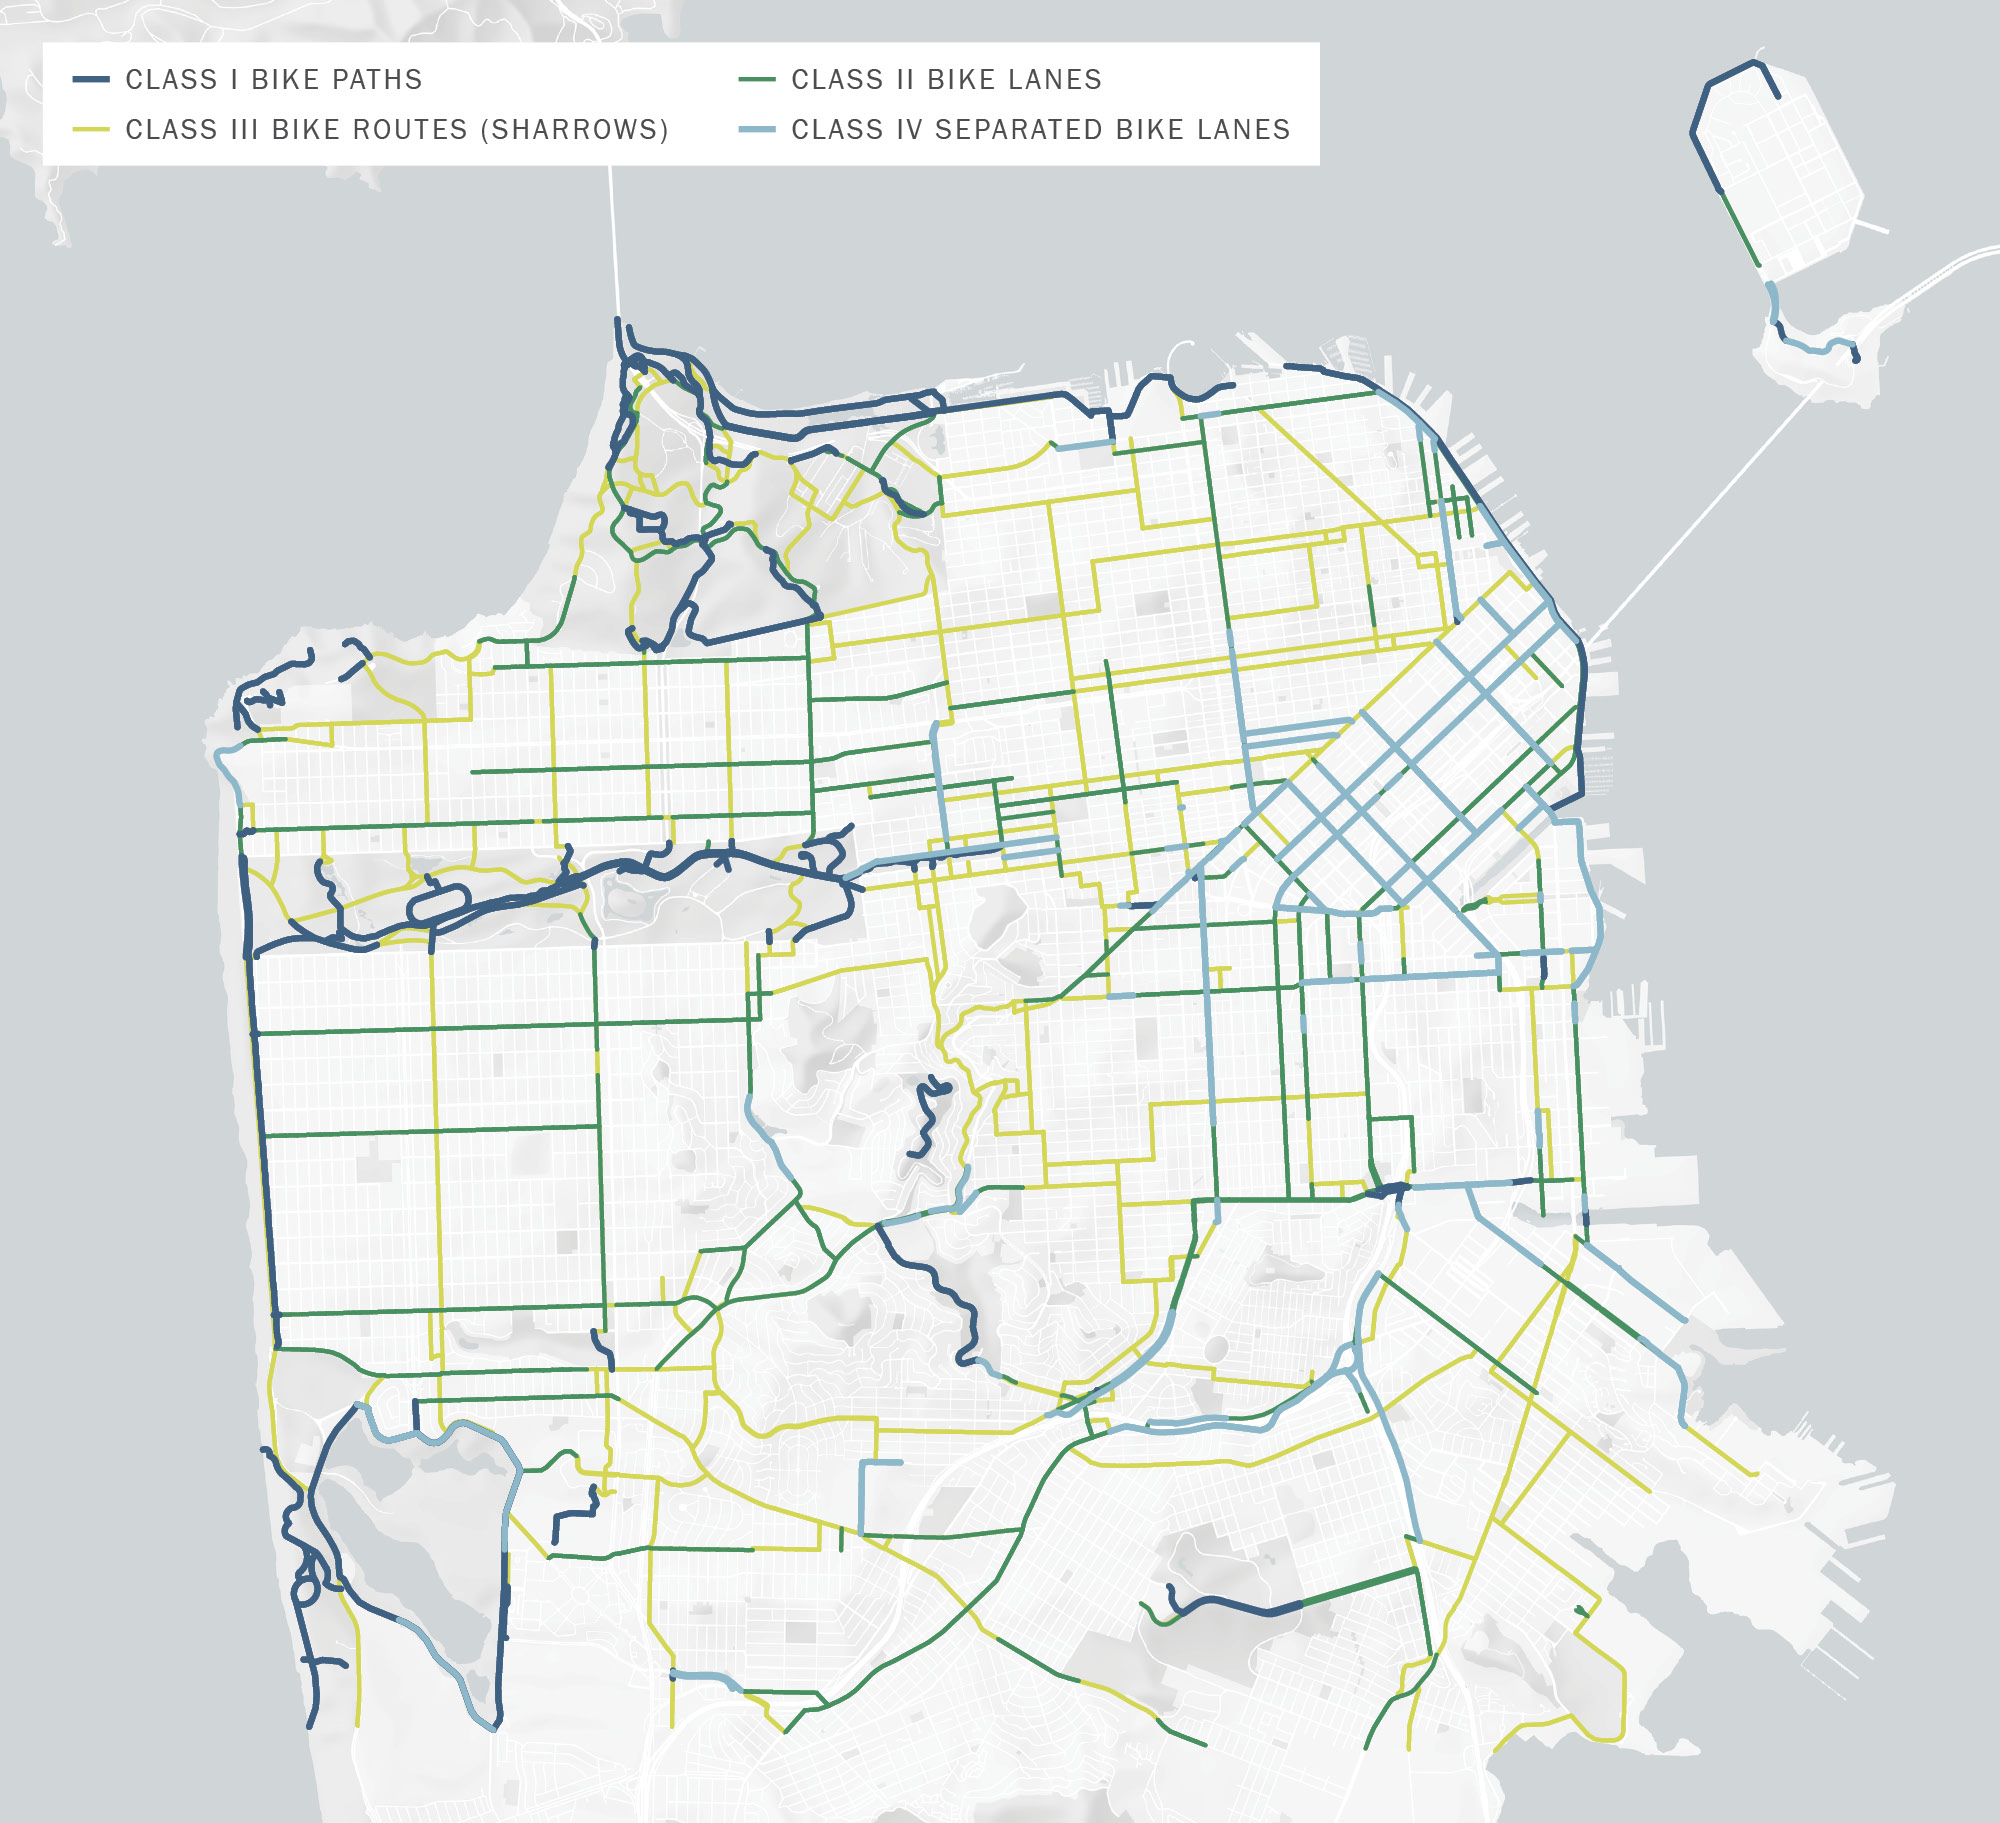
Download map data (GeoPackage)
Safety for road users, particularly those walking or biking, are key measures of transportation performance, and a critical policy priority for the city of San Francisco. The City and County of San Francisco adopted Vision Zero as a policy in 2014, committing to build better and safer streets, educate the public on traffic safety, enforce traffic laws, and adopt policy changes that save lives. The San Francisco Street Safety Act (July 2025) re-affirmed San Francisco’s commitment to traffic safety and identified specific activities across city agencies to advance the city’s goals.
The California Statewide Integrated Traffic Records System (SWITRS) maintained by the California Highway Patrol compiles all local collision reports into a unified database. Fatalities from traffic collisions are tracked, and collisions resulting in injury are classified by severity of injury. SafeTREC at UC Berkeley has developed the Transportation Injury Mapping System (TIMS) to provide easy access to SWITRS data. Table 4-17, Figure 4-35, and Figure 4-36 display traffic collision injury and fatality statistics by involved party for recent years, and includes provisional data for 2024.The traffic collisions data in this report is sourced from the California Statewide Integrated Traffic Records System (SWITRS) maintained by the California Highway Patrol.
The San Francisco Department of Public Health (SFDPH), San Francisco Police Department (SFPD), and the San Francisco Municipal Transit Agency (SFMTA) also independently reconciles traffic deaths using Office of the Medical Examiner’s and SFPD data via the San Francisco Vision Zero Traffic Fatality Protocol. This can be found at: sfgov.org/scorecards/transportation/traffic-fatalities. These numbers do not reflect freeway deaths occurring on grade-separated freeways/roadways under Caltrans jurisdiction in the City and County of San Francisco.
The total number of collisions, and collisions by severity level (property damage only (PDO), non-severe injury, severe injury) dropped in 2020, probably due to the substantial reduction in vehicle and non-motorized volumes in 2020 due to the COVID pandemic. Fatal collisions also dropped in 2020 relative to 2019, but were within the overall range of fatal collisions since 2011. Since 2020, the total number of collisions has increased, but remains below 2019 levels. The number of PDO collisions has steadily increased since 2020, but remains below 2019 levels. Injury collisions increased from 2020 but remain below 2019 levels. (Figure 4-35). The total number of fatal collisions in 2024 at 42 (of which 23 and 3 involved people walking and biking, respectively), however, is the highest observed since 2011 (other than 2022 which has the same number of fatal collisions) (Figure 4-36). Total fatalities also increased to their highest level observed since 2011, reaching 48 (Figure 4-37). These totals are higher than those reported through San Francisco’s Vision Zero program, which exclude fatalities that occur on freeways.
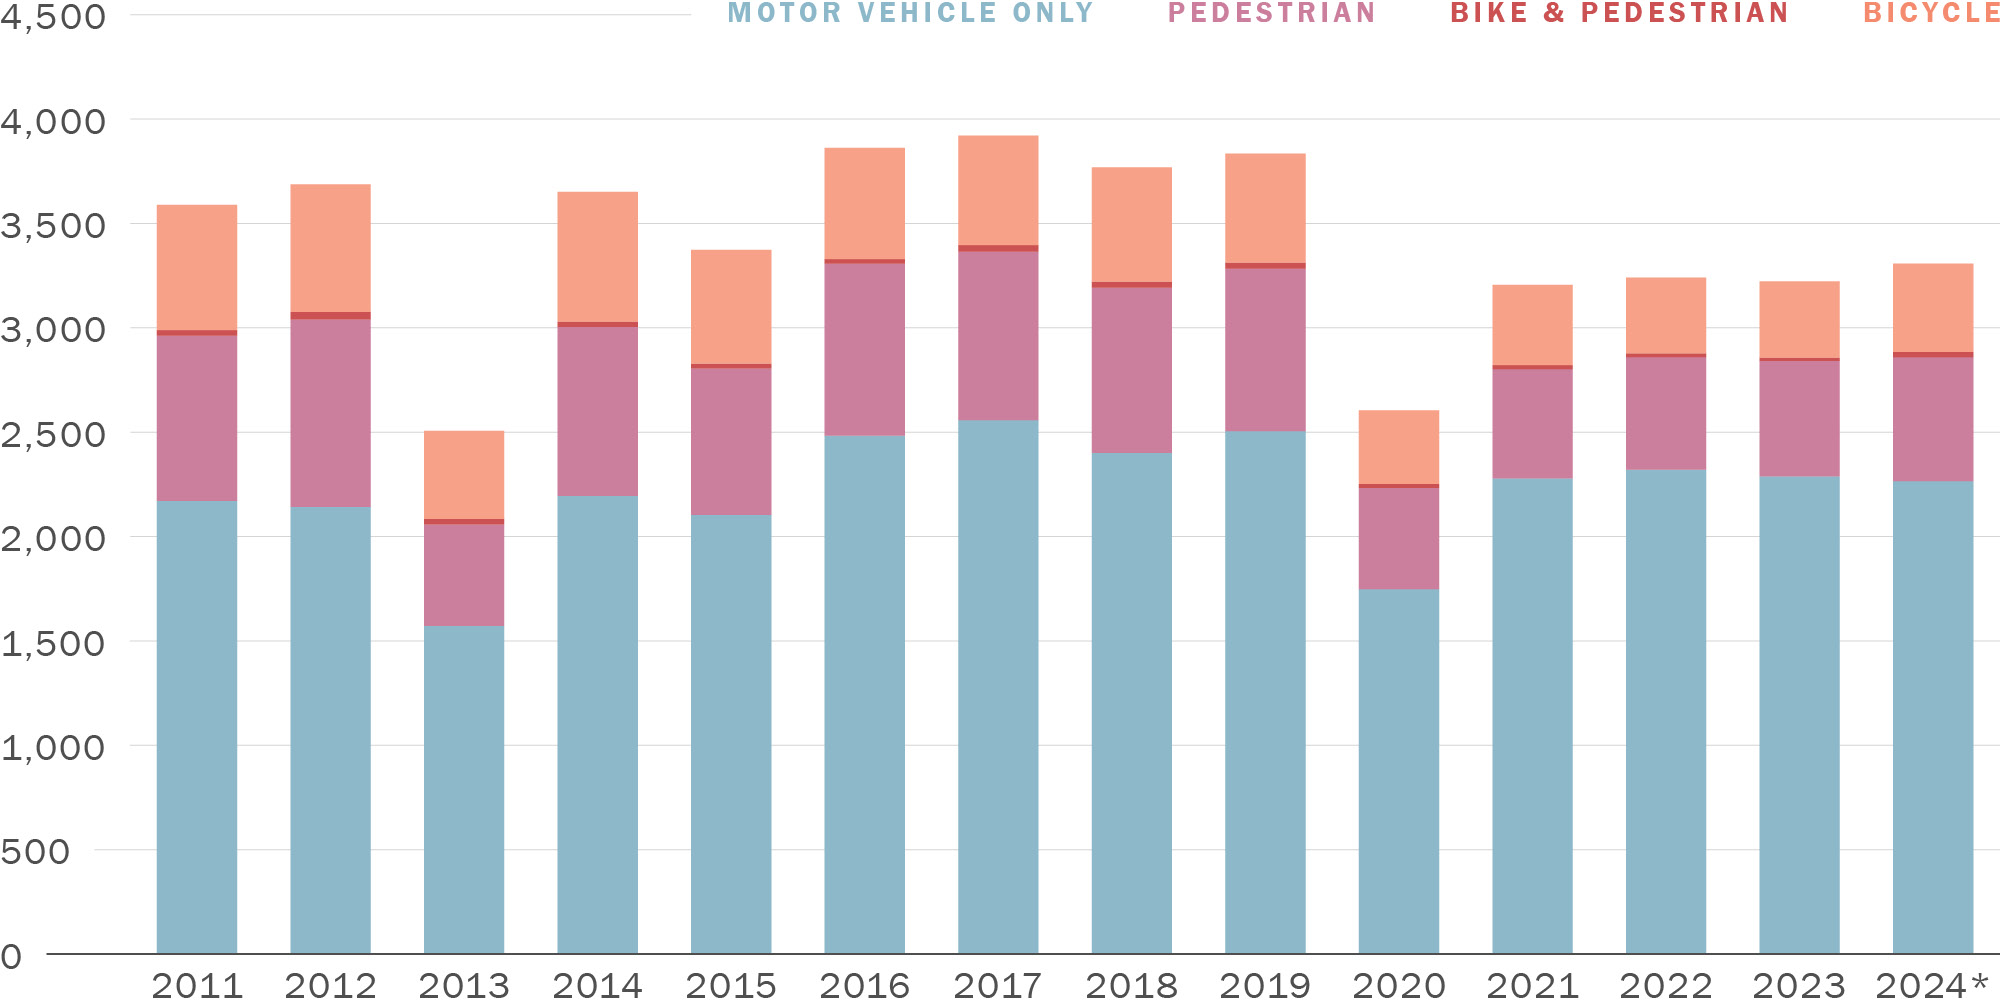
* provisional data.
Source: California Highway Patrol SWITRS / UC Berkeley SafeTREC TIMS
Download chart data (CSV)
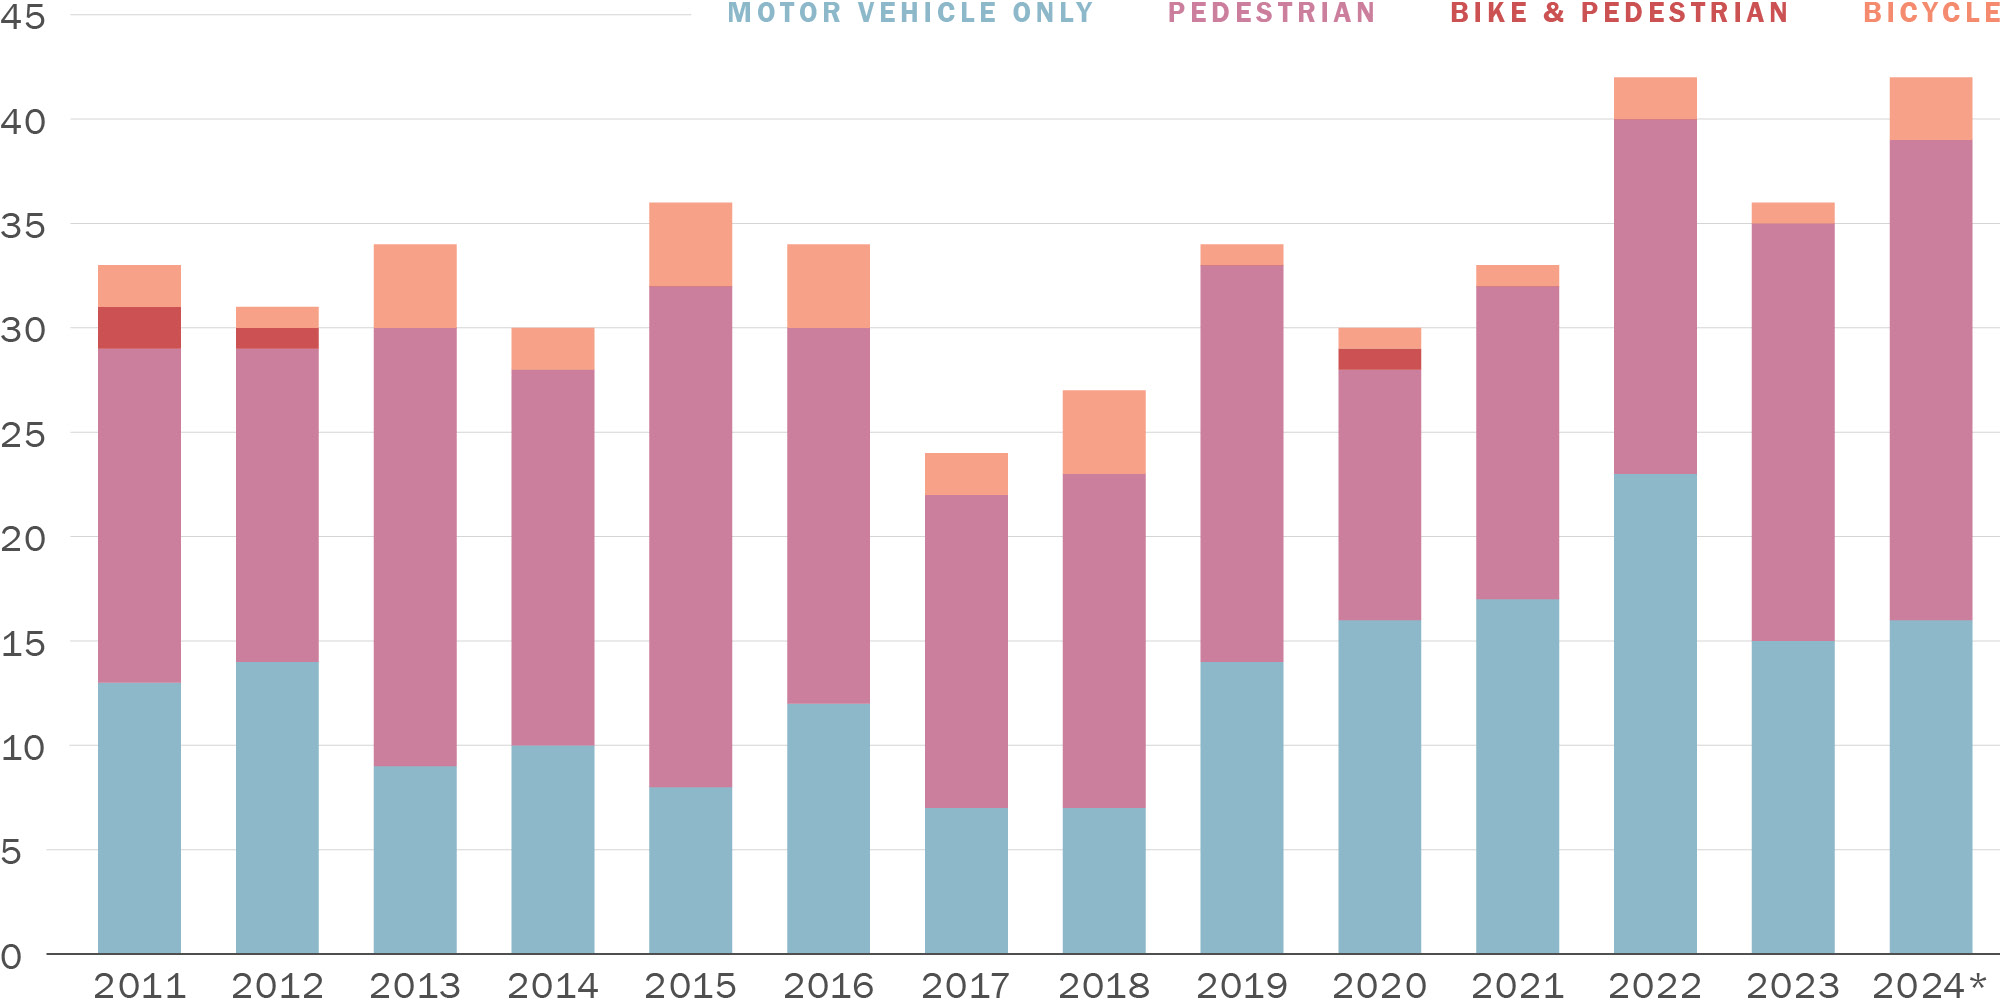
* provisional data.
Source: California Highway Patrol SWITRS / UC Berkeley SafeTREC TIMS
Download chart data (CSV)
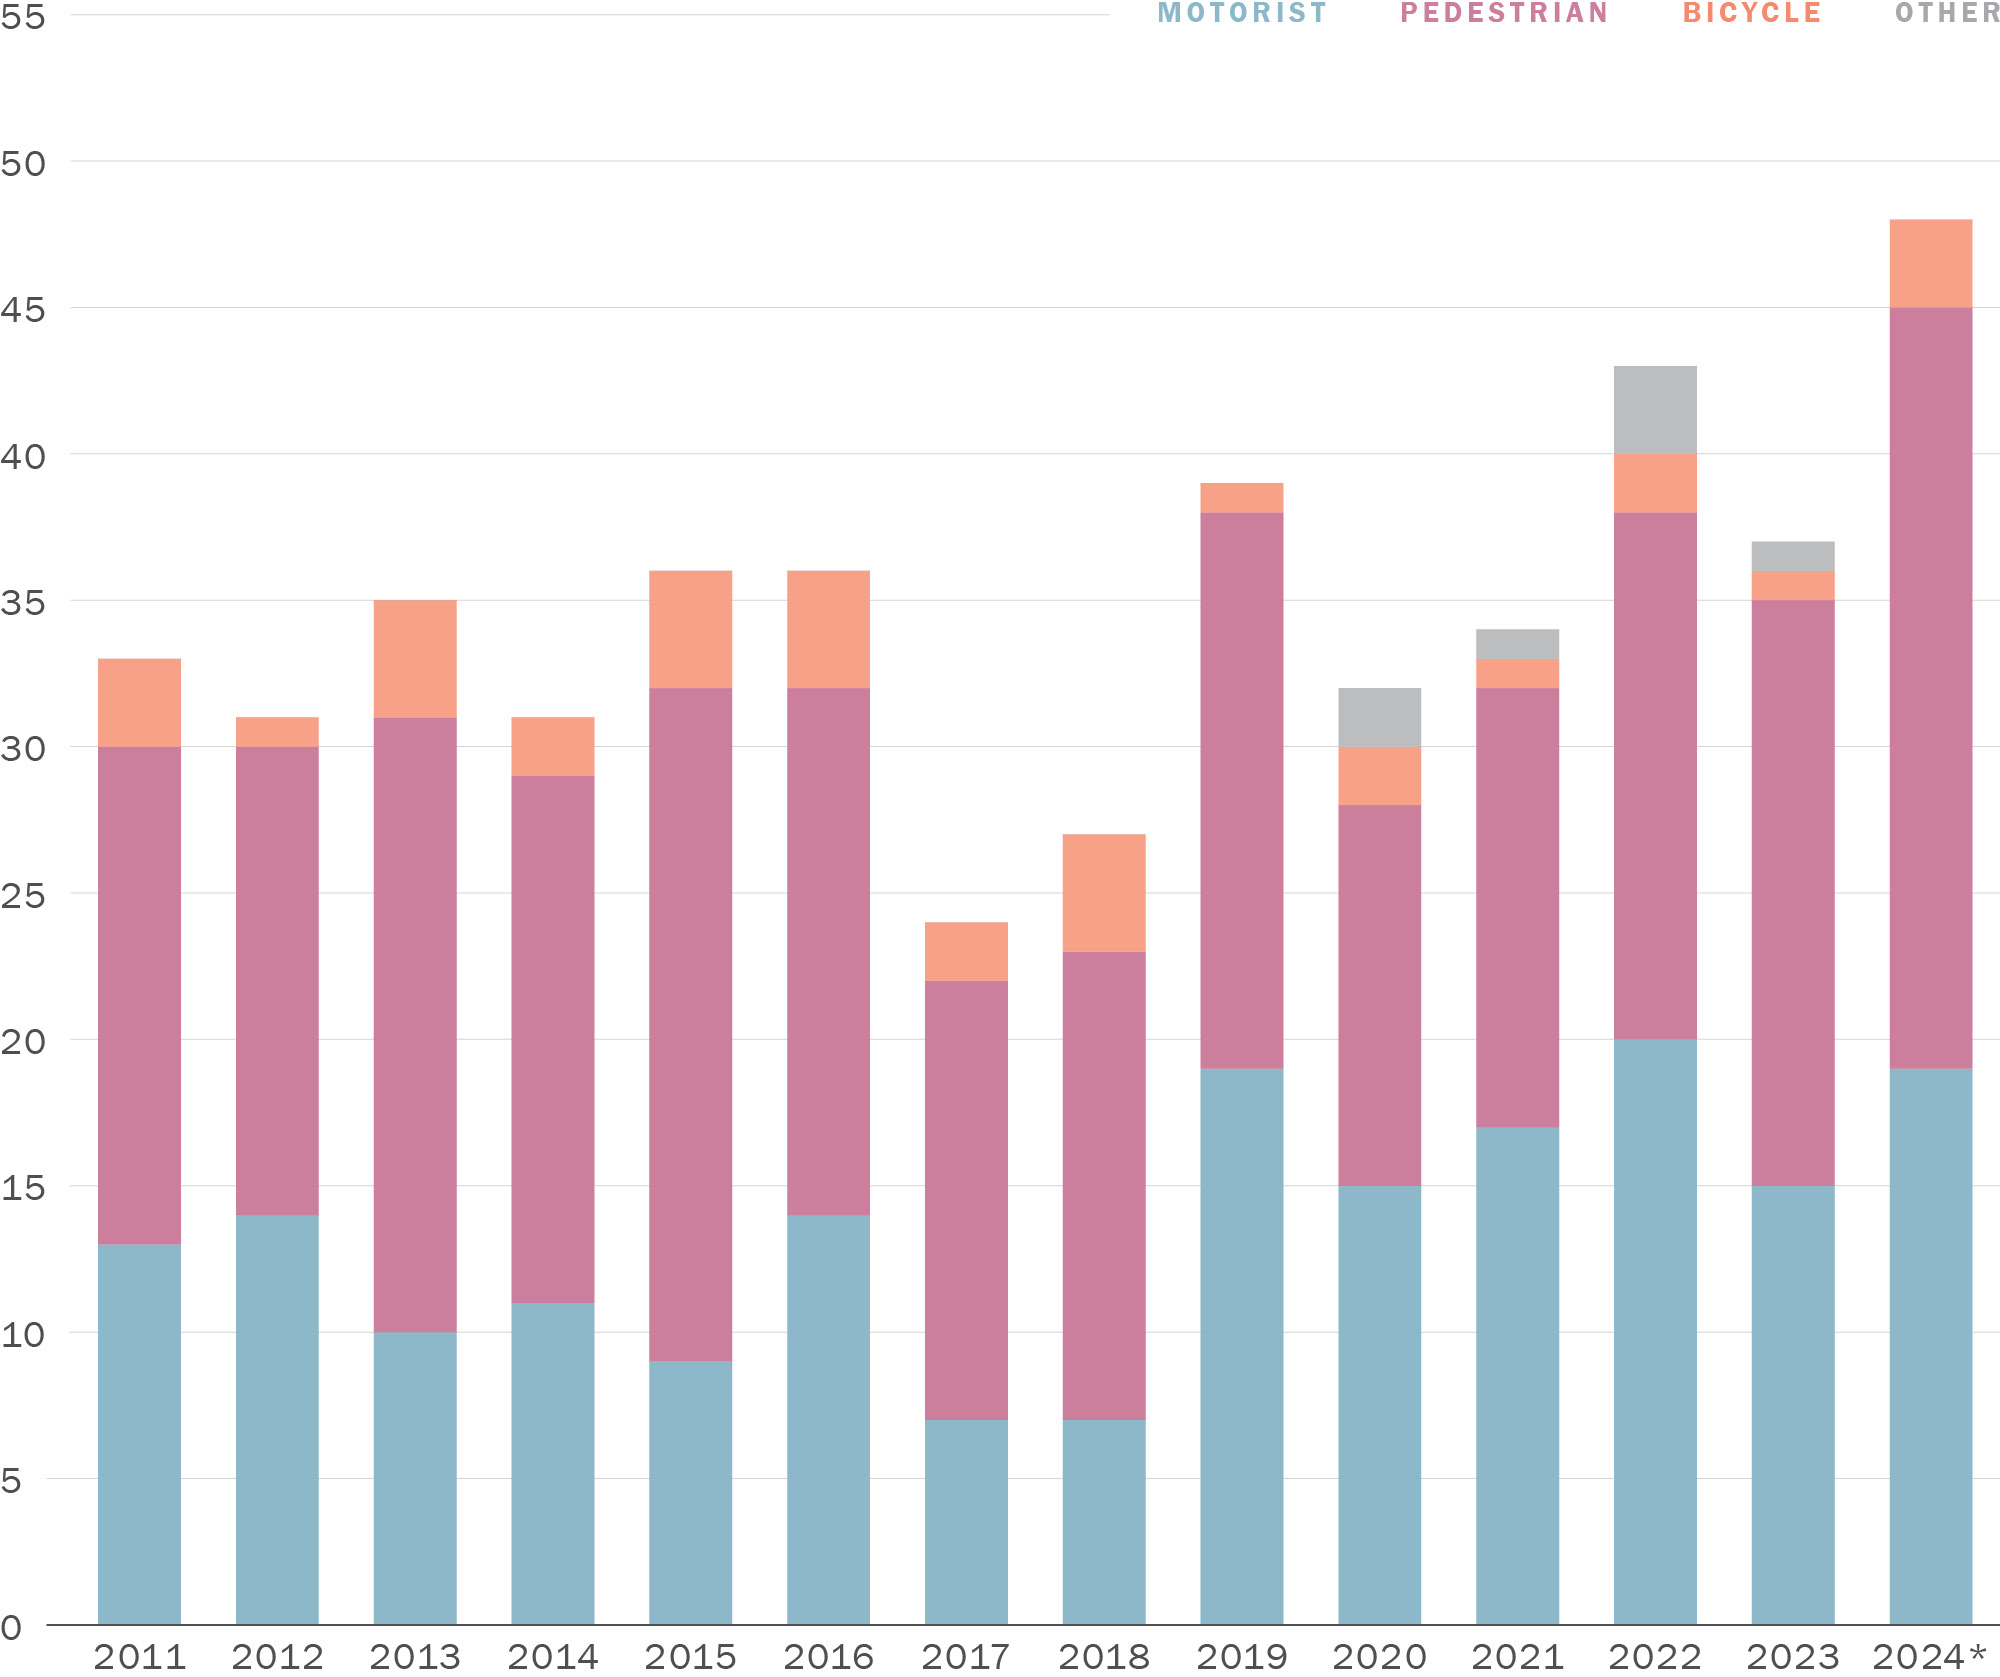
* provisional data.
Source: California Highway Patrol SWITRS / UC Berkeley SafeTREC TIMS
Download chart data (CSV)
In addition to the legislatively required performance measures and the local performance measures, several other metrics provide background and context for the transportation system’s performance.
In 2016, the San Francisco Planning Commission adopted new guidelines for evaluating the transportation impacts of new projects to implement California Senate Bill 743 (Steinberg 2013). Critically, environmental impact determinations locally and statewide are now based on vehicle miles traveled (VMT) rather than additional automobile delay as measured by level-of-service (LOS). VMT decreased by 20 – 30% in the first 1.5 years of the COVID pandemic. As of 2025, VMT is hovering at around 10% below pre-COVID levels (Figure 4-38).
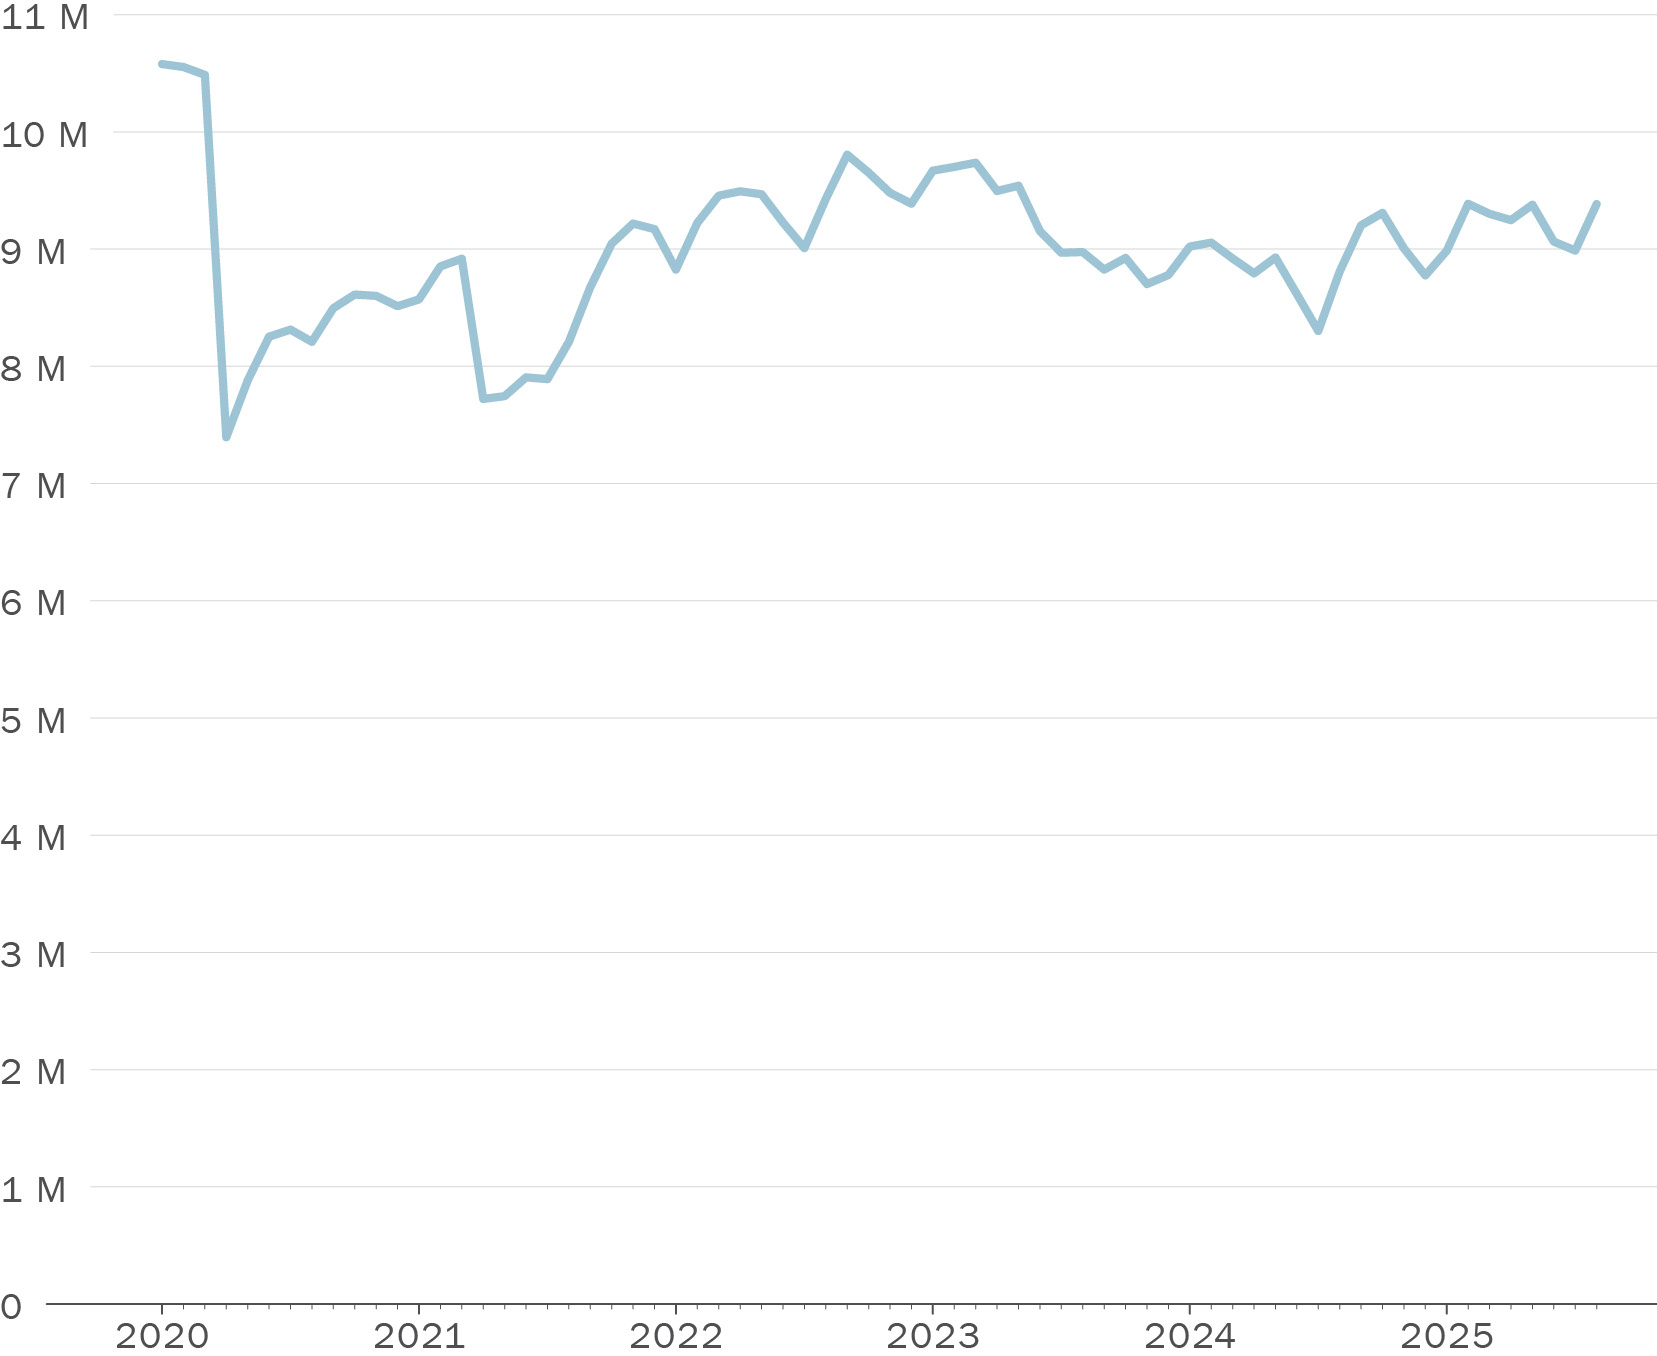
Source: The Transportation Authority, based on INRIX automobile speed data
Download chart data (CSV)
Transit Ridership refers to the total boardings on transit services. Figure 4-36 shows recent ridership trends for the three largest transit systems serving San Francisco. Muni carries the greatest number of trips in San Francisco, with over 500,000 trips on a typical April – May weekday in 2025. Ridership on all three operators declined significantly with the spread of COVID in 2020. Since then, ridership has been gradually increasing every year, but in 2025 ridership is still lower than pre-COVID pandemic levels, with Muni, BART, and Caltrain at 72%, 44%, and 54% of 2019 (pre-COVID pandemic) ridership respectively.
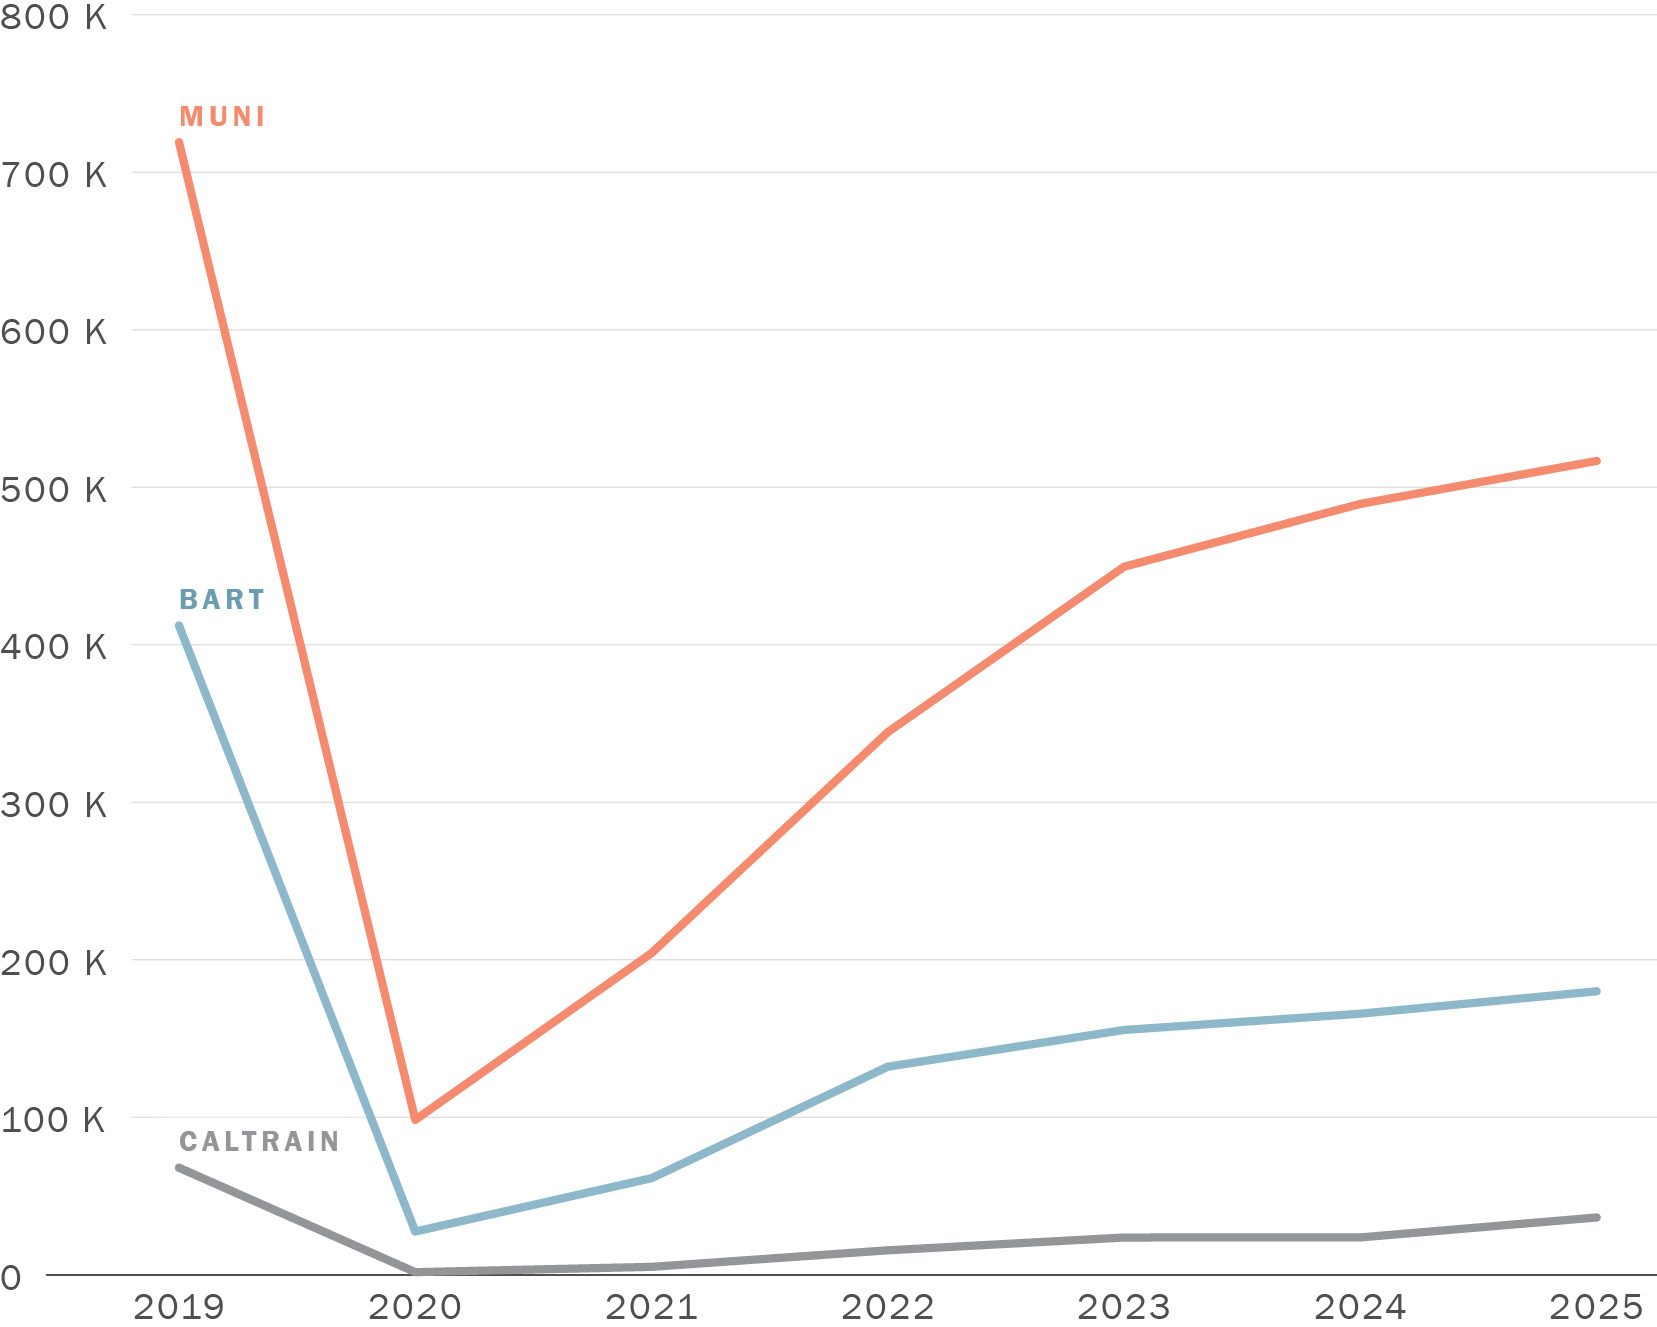
Source: SFMTA/BART/Caltrain Note: data collected April – May each year except for Caltrain it is February
Download chart data (CSV)
Mode share describes the mix of modes, such as transit, biking, walking, and driving used to travel to, from, and within San Francisco. Figure 4-40, Figure 4-41, and Figure 4-42 summarize the share of trips by mode for in San Francisco for three different travel markets: all trips to/from/within San Francisco, regional trips to/from San Francisco (trips where one of the trip ends is in San Francisco and the other is not), and trips within San Francisco (trips that both start and end in San Francisco). Driving (alone, sharing a ride, or using a TNC) is the most prevalent mode to both get around within San Francisco (43.9%) and to travel to/from San Francisco (76.3%). For travel within San Francisco, walking is the next most prevalent mode (41.0%). There is also a significant transit share for both travel markets (11.8% for trips within San Francisco, and 21.9% for trips to/from San Francisco).
Note: Data for typical weekday (Tuesday – Thursday) trips made by adults (age 18 or above)
Source: Bay Area Travel Study
Download chart data (CSV)
SFMTA collects information on the usage of shared bikes and scooters (“micromobility”). Figure 4-43 shows trips increased from 2017 to 2019, peaking at 33,000 average monthly trips. Average monthly trips then declined to 25,000 in 2020, likely due to the COVID pandemic, but still remained higher than before 2019. From 2021 to 2024, micromobility trips fluctuated between 30,000 and 38,000, and then in 2025 (up to and including September 2025) increased to 66,000 average monthly trips.
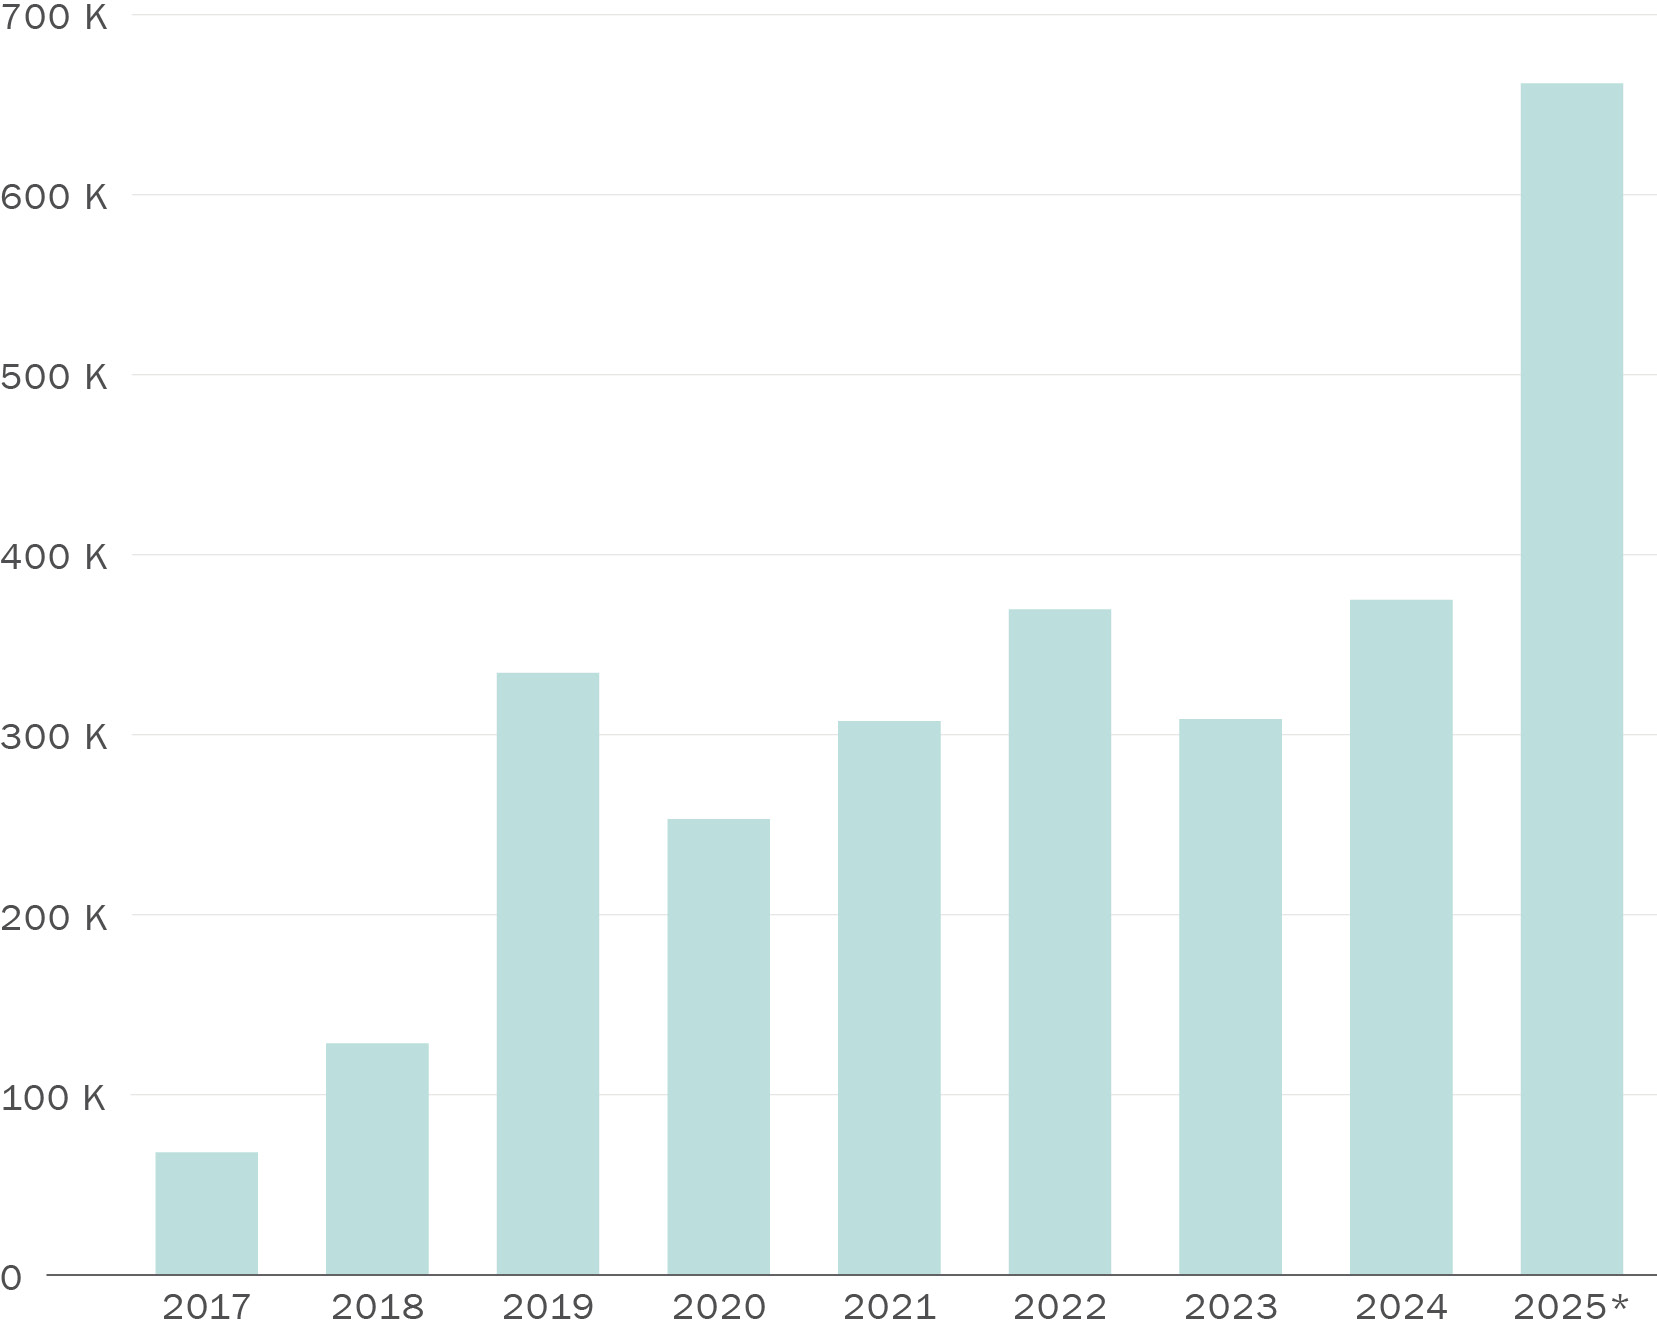
* provisional data: 2025 data is only up to and including September 2025
Source: https://www.sfmta.com/reports/shared-mobility-trips
Download chart data (CSV)
In November 1999, San Francisco voters passed Proposition E which, among other changes, amended the City Charter to require the creation of service standards and goals for Muni to attain. The SFMTA, through its strategic planning process, establishes its vision and values, and identifies the strategic goals and metrics in order to achieve this vision and uphold this set of values.SFMTA Strategic Plan Refer to the SFMTA Strategic Plan and Performance Metrics web page for details on each goal and metric.
Work program items consist of those intended to improve the City’s performance monitoring as well as initiatives targeted at improving system performance. Transportation Authority work program elements intended to continue and enhance performance monitoring include:
In addition, the Transportation Authority and City agencies will continue to engage in planning efforts and implement projects to improve the transportation system’s performance. The San Francisco Transportation Plan (SFTP) 2050+, a minor update to SFTP 2050, will be published in Summer 2026. The plan will inform San Francisco’s advocacy for discretionary (e.g. competitive) transportation funds, as well as for new transportation revenues. The purpose of SFTP+ is to incorporate post-pandemic travel patterns, lowered revenue projections, and revised land-use allocation, and to refine SFTP investment strategies and recommendations. This minor update will also update policy developments and report on implementation progress of SFTP 2050. The Transportation Authority will, as part of its efforts to achieve these outcomes:
KEY TOPICS
The Congestion Management Program legislation requires that the CMP include a travel demand management (TDM) element. TDM is a systematic approach to shift how, when, and where people travel through programs and policies. TDM will maximize the infrastructure investment priorities defined in the San Francisco Transportation Plan 2050 (SFTP2050) and can reduce congestion by shifting more trips from driving alone to walking, bicycling/rolling, transit, or carpooling. TDM can include policies, low-cost capital improvements, requirements on new development, and information/outreach programs designed to facilitate the use of sustainable transportation options. This chapter describes San Francisco’s TDM Policy Framework, Strategy, and TDM programs.
The CMP legislation’s requirement for a TDM element encourages local policy and programs to promote travel behavior changes to reduce congestion and associated impacts identified in the CMP.
San Francisco has several guiding policy documents that shape the development of TDM activities. These include:
San Francisco is an attractive place to live, work, and play because it offers so much to such a wide variety of people. As a vibrant, busy city, San Francisco faces challenges with how to accommodate expected growth within the constraints of a world-class location that has already developed most of its available land. As the city increases in density, transportation and land-use planners are working to make the city work better for the people who are already here as well as for those who will be here in the future. The city has limited street space and, due to the costs of building major infrastructure, San Francisco is striving to make the most efficient use of this limited space by designating more space for transit, walking, and biking/rolling, which can move more people in less space.
In 2014, City agencies developed an Interagency Travel Demand Management Strategy outlining the city’s approach to TDM, including activities related to (1) Implementing new TDM Policies, (2) Enforcement of existing policies, and (3) Developing supportive programs and services.
In 2017, City agencies developed a joint San Francisco TDM Plan: 2017 – 2020. This workplan, based on the 2014 strategy, identifies the policies, projects, and programs the city can implement to accomplish its TDM goals. The plan was collaboratively developed by the four major agencies that implement TDM in the city — the Transportation Authority, SFMTA, the San Francisco Planning Department, and the San Francisco Department of the Environment. The plan identifies which agencies have the lead and support roles for elements of the plan.
SFTP2050 included a policy initiative to plan for mode shift long-term. The TDM policy initiative includes a recommendation that San Francisco establish a vision and measurable goals for the future TDM strategy to guide development, implementation, and monitoring; identify priority geographic areas, trip types, travel markets, traveler types, and success metrics to guide program selection and implementation details; and provide guidance for how to incorporate ongoing evaluation to track impacts on modeshift and cost effectiveness and guide future TDM investments. The next steps to advance this policy initiative is to complete a TDM Market Analysis (led by SFCTA) and update the TDM Strategic Plan (a joint effort between SFCTA and SFMTA).
The TDM Market Analysis will use post-pandemic travel data to describe travel markets and match them with appropriate TDM strategies, identify areas where TDM investments will be most effective, establish VMT-reduction and mode-shift targets for TDM, and provide guidance for program implementation. This effort will inform the TDM Strategic Plan, which will define priority TDM actions to advance in the near-term. The recommendations of these two efforts will define funding priorities for the five-year prioritization of Prop L funds.
The Transportation Authority, which was designated as the Treasure Island Mobility Management Agency (TIMMA) in 2014 to implement the TITIP, is developing a business plan with San Francisco Bay Ferry to begin permanent, zero-emission ferry service in 2027. TIMMA is also securing funding to launch bike share in 2026 and the on-island shuttle in 2027. TIMMA is working to gain adoption of the toll and affordability system programs.
San Francisco has a range of TDM policies and requirements to promote sustainable modes of transportation. These efforts can be broadly grouped in the following categories:
An example is a requirement for mandatory Transit Pass purchases as part of homeowners’ dues (in new residential developments such as Park Merced or Candlestick and Hunters Point) or ticket purchases (Chase Center). Within the Candlestick Point and Hunters Point development, all residents are required to purchase an EcoPass, which also helps to subsidize the cost of enhancing transit service to the area. In Park Merced, For residents of rental units, one transit pass per household is subsidized.
MTC launched the Clipper Bay Pass Phase 2 pilot in January 2024 with three partner organizations: University of California San Francisco (8,000 employees and students), City of Menlo Park (200 employees), and Alameda Transportation Management Association (2,100 residents and employees). Key findings from the Year 1 Preliminary Evaluation found that individuals eligible for BayPass at these organizations took 35% more transit trips in 2024 (after they received BayPass) than in 2023 (before they had BayPass). BayPass’ initial evaluation found notable increases in trips taken. For example, at UCSF BayPass increased trips taken on BART by 34% and Caltrain by 93%. And among Alameda TMA residents and employees, BayPass increased trips taken on SF Bay Ferries by 196% and SF Muni by 414%.
Finally, the SFMTA allows Chase Center event goers to use their electronic or physical ticket as a valid all day Muni Pass.
Each of these categories of TDM requirements, policies, and programs are described in detail in Appendix 4.
As outlined in the San Francisco TDM Plan: 2017 – 2020, several city agencies and departments are conducting numerous TDM activities, studies, and plans. This section identifies recently completed, TDM-related studies and planning efforts where the Transportation Authority played a significant role.
School Access Plan: In 2023, the Transportation Authority adopted the School Access Plan for San Francisco which recommends transportation solutions for K–5 students and their families. Solutions focus on children and caregivers who are burdened by medium- and long-distance trips to school and afterschool activities, and seek to close equity gaps and provide sustainable transportation options to help reduce vehicle travel. The plan builds on the Transportation Authority’s 2016 Child Transportation Study, which found that most parents drive their children to school and afterschool activities and that most parents are interested in alternative transportation options.
SF Business Relocation TDM Project: Prior to the pandemic, SFMTA initiated an effort to develop and operate a program focused on addressing the transportation needs of employees at businesses that are opening in or relocating to new locations in San Francisco. The program was originally scoped to provide transportation planning services and materials to businesses to help their employees travel to work in their new location without driving alone, thus setting a more sustainable commute habit from the start, rather than trying to change habits after they have already been set. However, SFMTA amended the project scope to shift the target population from businesses as they relocate between offices, to all office-based businesses as an increasing number of employees return to office settings.
More detailed descriptions of these studies and plans can be found in Appendix 4.
The Transportation Authority will continue to work jointly with city partners to further transportation demand management policies, requirements, and programs, including numerous efforts based on the Interagency Travel Demand Management Strategy, the 2017 San Francisco TDM Plan, and SFTP2050. Specifically, the Transportation Authority will:
KEY TOPICS
The California Government Code section 65089(b)(4) requires that Congestion Management Programs (CMPs) include a program to analyze the transportation system impacts of local land use decisions. These analyses must measure impacts using CMP performance measures and estimate the costs of mitigating the impacts.
The CMP legislation also requires the Transportation Authority, as the Congestion Management Agency, to “develop a uniform database on traffic impacts for use in a countywide transportation computer model…” that will be used “to determine the quantitative impacts of development on the circulation system…” (California Government Code section 65089(c)). The database must be consistent with the modeling methodology used by regional planning agencies, the Metropolitan Transportation Commission (MTC) and the Association of Bay Area Governments (ABAG). The Transportation Authority’s GIS database, including ABAG Projections data, updated CMP networks, and numerous other data items (such as roadway level of service, transit ridership, travel behavior survey results, etc.) constitutes the uniform database for San Francisco. In addition, the Transportation Authority has an activity-based travel demand forecasting model used in combination with the uniform database. This is further detailed in Chapter 8 and Appendix 8.
In September of 2002 the legislature passed SB 1636, which is intended to “remove regulatory barriers around the development of infill housing, transit-oriented development, and mixed-use commercial development” (California Government Code 65088(g)) by enabling local jurisdictions to designate “infill opportunity zones.” These zones (IOZs) are defined as areas with compact, transit-oriented housing and mixed use in close proximity to transit service. The CMP network segments within a designated IOZ are exempt from CMP traffic level of service (LOS) standards. SB 743 revised the definition and requirements related to IOZs (discussed further in Section 6.4.4).
On September 27, 2013, the governor signed into law SB 743, which revised the criteria for determining the significance of transportation impacts within transit priority areas. Transit priority areas are defined as areas within a half mile of a major transit stop, either existing, or planned, which in San Francisco comprises most of the city. The text of SB 743 specifically eliminates automobile delay as measured by level of service as a significant impact on the environment in transit priority areas. Parking impacts from infill development also shall not be considered significant impacts on the environment. The Governor’s Office of Planning and Research identified vehicle miles traveled (VMT) as the most appropriate measure of transportation impacts.
As CMA for San Francisco, the Transportation Authority ensures that the City complies with CMP requirements including land use impact monitoring. The General Plan and the City Charter frame the City’s process for reviewing land development impacts on the transportation network. Details about the City’s land use development process within this framework can be found in Appendix 6. AB 1619, passed by the California State Assembly in 1994, stipulates that the CMA should prepare any countywide transportation plan. Pursuant to a December 1994 action, the Board of Supervisors directed the Transportation Authority to prepare a countywide transportation plan, and to coordinate City Departments.
The Transportation Authority adopted SFTP 2050 in December 2022, as Phase 3 in the ConnectSF long-range planning process. Connect SF is a multi-agency collaborative process to build an effective, equitable, and sustainable transportation system for San Francisco’s future. ConnectSF has defined a 50-year vision of San Francisco’s future that represents our priorities, goals, and aspirations as a city within the larger Bay Area. ConnectSF developed a long-range vision for 2065 that served as the underpinning of SFTP 2050.
The Transportation Authority will advance the SFTP 2050+, a minor update to SFTP 2050. SFTP 2050+ is a limited and focused update that will incorporate PBA 2050+ revisions to revenues, including strategies to address the transit fiscal cliff, reflect post-pandemic travel behaviors to refine SFTP investment strategies and recommendations. The project will incorporate public engagement and coordinate with agency partners and other interested parties.
Further details on the consistency of SFTP with long term strategic goals of the General Plan can be found in Appendix 6.
The Transportation Authority, as CMA, retains its own GIS database and travel demand model to analyze transportation and provide uniform assumptions for City departments. For major land use decisions, the Transportation Authority’s tools are used to assess transportation impacts and ensure that the methodology used to assess them is consistent with MTC models and ABAG data. A model consistency report is developed during each CMP monitoring cycle to demonstrate this (see Appendix 8).
The primary purpose of the land use analysis program is to inform decisions on the supply of transportation infrastructure to the City and how the City should best spend scarce transportation dollars. This program adds no new requirements to the existing local project environmental review process, but it provides a long-term transportation investment policy context for local environmental review. It also informs decision-making in the reverse direction: as CMA, the Transportation Authority is responsible for commenting on local land use decisions and making such comments with an understanding of how land use choices will shape future transportation demand. With the passage of California Senate Bill 743 and the use of vehicle miles traveled (VMT) as a primary metric for determining traffic related environmental impacts, review of land use projects is now more consistent with other goals in the SFTP and related City documents.
When voters approved Prop K in November 2003, they approved various policies and priorities in the Expenditure Plan designed to implement San Francisco’s Transit First policy and improve the coordination of land use and transportation. The Expenditure Plan directs the Transportation Authority to “give priority for funding to major capital projects that are supportive of adopted land use plans with particular emphasis on improving transit supply to corridors designated for infill housing and other transit-supportive land uses.” Voters approved the Prop L sales tax in 2022 to supersede Prop K and the Prop L Expenditure Plan which will continue this legacy of coordinating land use and transportation through investments from its Transportation Systems Development and Management category, including the new Development Oriented Transportation program.
MTC provides the nine Bay Area CMAs with a share of regional planning funds (“3% Planning Funds”) to support local and county-level planning functions established under state and federal law. These activities include the development of the CMP. The Transportation Authority focuses on the following activities to help integrate transportation and land use decisions:
More details about the coordination between CMA and regional land use can be found in Appendix 6.
ABAG and MTC encourage compact, transit-oriented development through the identification of Priority Development Areas (PDAs), Priority Conservation Areas (PCAs), and Transit Oriented Communities (TOCs). In May 2019, the MTC Commission and ABAG Executive Board adopted an update to the Regional Growth Framework, including updates to PDA and PCA definitions, and a new Priority Production Area (PPA) pilot program. As of September 2025, San Francisco has nominated fifteen PDAs and one PPA (Figure 6-1), and twelve PCAs (Figure 6-2).
In September 2022, MTC adopted the Transit Oriented Communities Policy, which identified locations near fixed route transit that would be prioritized for investment if supportive housing, land use, parking, and mobility policies are adopted by the local jurisdictions. San Francisco has 164 of the region’s 384 TOCs, by far more than any other jurisdiction (Figure 6-3).
MTC’s OBAG 2 (OBAG) Program seeks to integrate land use and transportation planning activities to reduce automobile travel and greenhouse gas emissions as required under Senate Bill 375. As CMA, the Transportation Authority is responsible for administration of county OBAG funds to support eligible transportation improvements that serve PDAs. The One Bay Area Grant (OBAG 2) policy and project selection framework, MTC Resolution No. 4202, requires CMAs to develop a Transportation Investment and Growth Strategy (TIGS) that describes how it expects to support its PDAs through transportation investment. The effort is required to be updated every four years. The Strategies are intended to strengthen the alignment of transportation investments and local PDA planning in each county.
The first TIGS was adopted in July 2013 and provided a framework and roadmap for San Francisco’s transportation investment in PDAs. The second TIGS was adopted in May 2017. The 2021 San Francisco TIGS closes OBAG 2 and is meant to help shape OBAG 3 funding investments by identifying opportunities and needs unique to the San Francisco County’s PDAs to support the integration between transportation investments and land use planning.
MTC’s Housing Incentive Pool (HIP) Program awarded $71 million in transportation funds to jurisdictions in 2024 based on how many affordable housing units the jurisdiction was able to produce or preserve between 2018 and 2022 within a PDA or TPA. HIP was intended to catalyze progress towards the region’s affordable housing targets by providing incentive funding to the 15 highest performing jurisdictions. San Francisco produced or preserved 6,129 qualifying housing units — more than any other jurisdiction — and received $35.8 million of the $71 million.
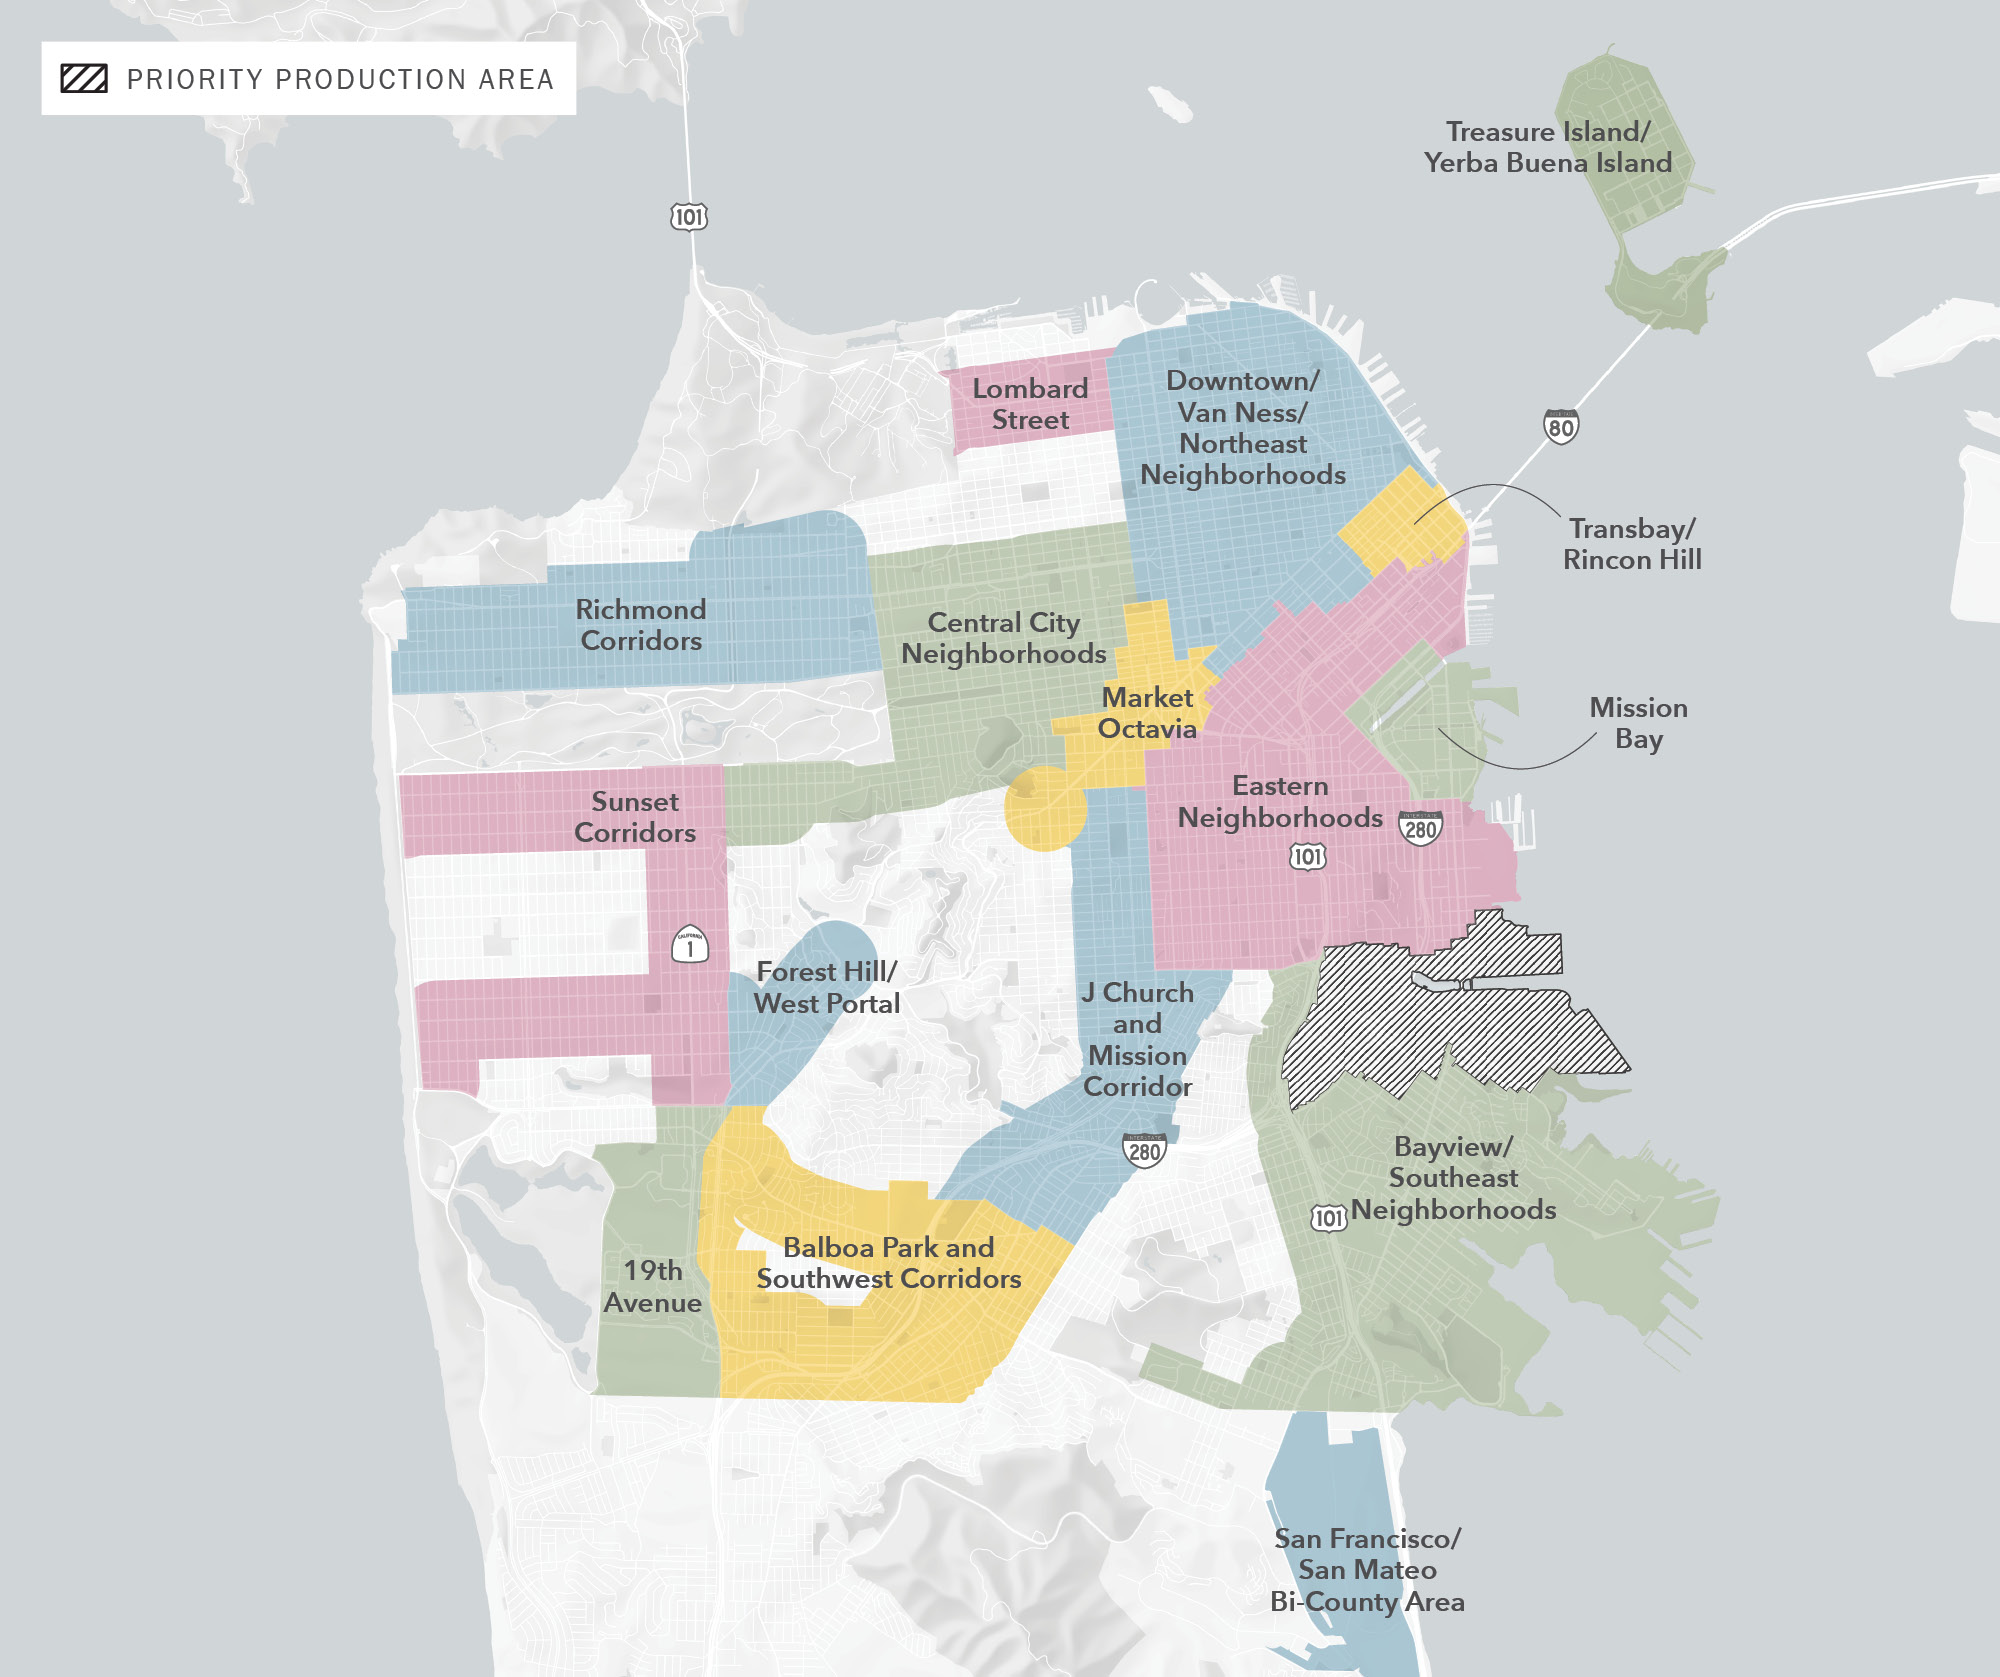
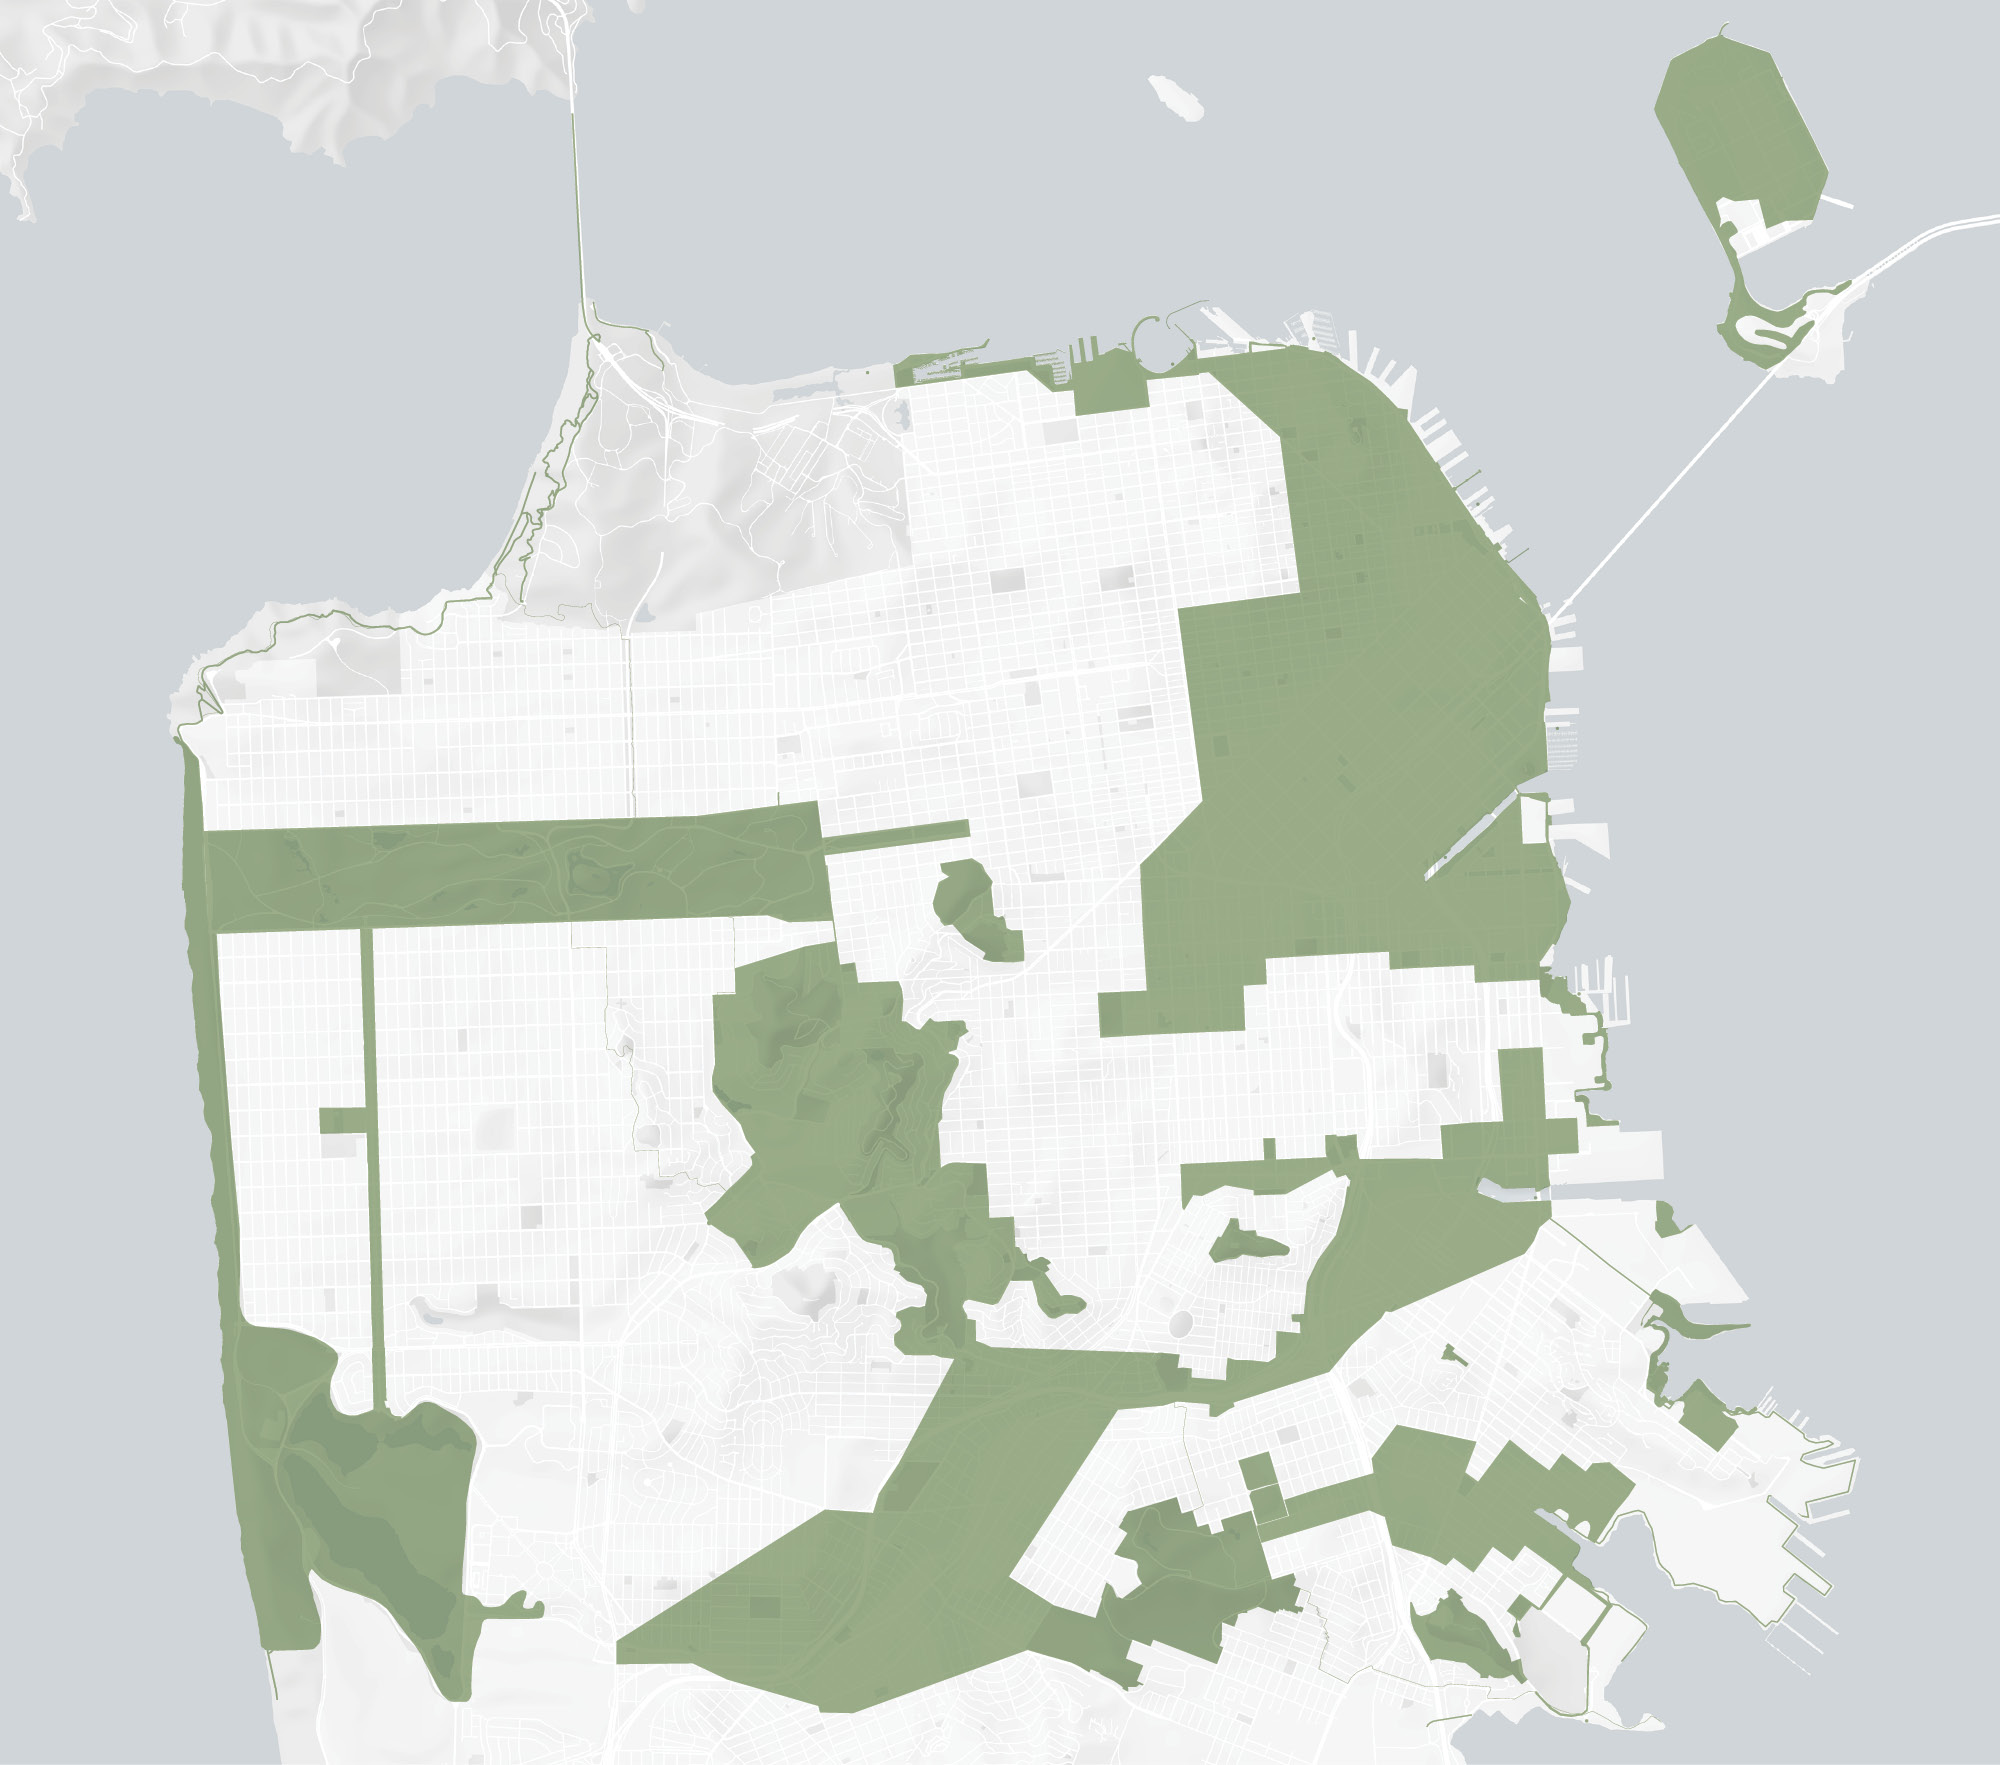
Source: Association of Bay Area Governments / Metropolitan Transportation Commission. Priority Conservation Areas Mapping Viewer.
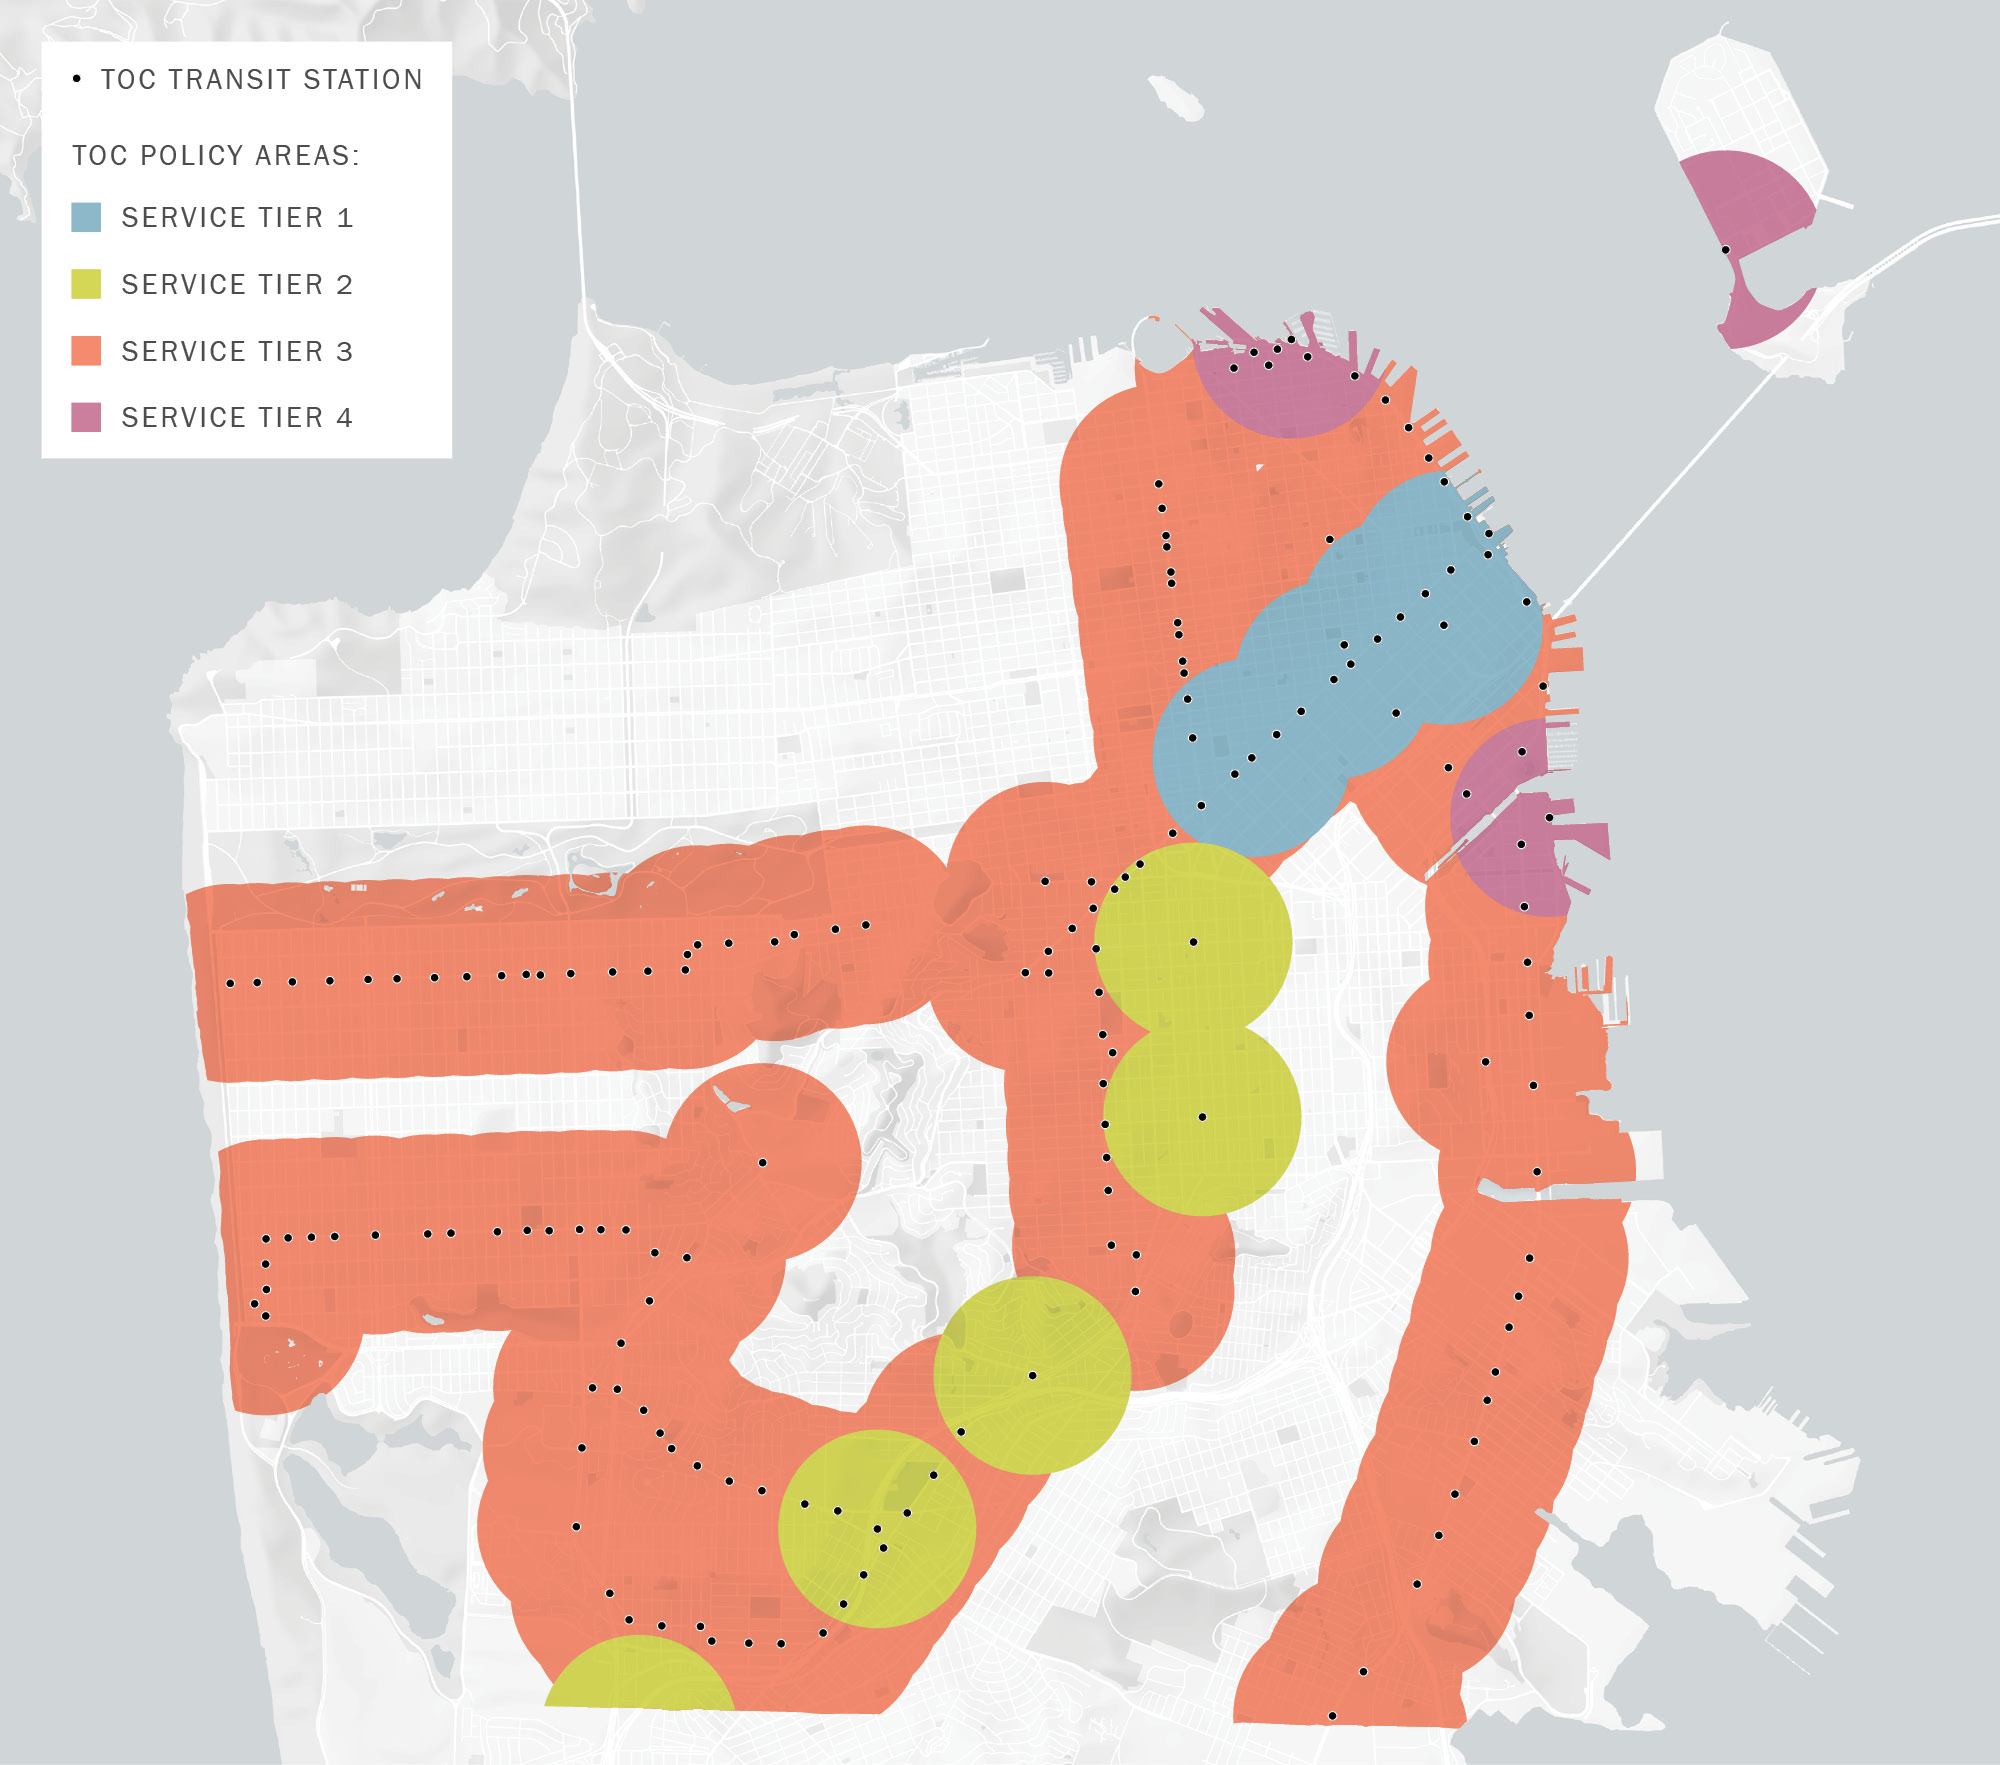
Source: Metropolitan Transportation Commission. Transit-Oriented Communities Policy Exploratory Map.
As a part of Plan Bay Area, the region has begun to identify more robust funding incentives for TOCs, PDAs, and PCAs through the One Bay Area Grant (OBAG) framework.
Details on the OBAG funding framework, and on local PDA planning projects in San Francisco can be found in Appendix 6.
Senate Bill 1636 (Figueroa 2002) granted local jurisdictions the authority to designate Infill Opportunity Zones (IOZs) in areas meeting certain specified requirements. Within a designated IOZ, the CMA is not required to maintain traffic conditions to the automobile level of service (LOS) standard.
Senate Bill 743 (Steinberg 2013) revised the criteria to designate an IOZ. An area may be designated as an IOZ if it is:
The Board of Supervisors first designated an IOZ in 2009 in accordance with SB 1636, then updated the area designated as an IOZ under SB 743 in September 2024.
A map of the current IOZ in San Francisco is shown in Figure 6-4. The Board of Supervisors resolutions, memoranda, maps, and GIS files on the IOZ designation and update can be found on the Transportation Authority’s Congestion Management Program reports & documents page.
State congestion management law requires CMAs to establish vehicle level of service (LOS) standards for a designated countywide network of roadways (see Chapter 3). Within a designated IOZ, CMP automobile LOS standards are not applicable. Instead, an alternative metric can be applied for local analysis of transportation impacts. In 2016, the San Francisco Planning Commission removed LOS as a significant impact on the environment and replaced it with a vehicle miles traveled (VMT) threshold for all CEQA determinations. This applies to all projects, whether or not they are within a designated IOZ.
For some forecasting activities, the Transportation Authority is required to use regionally-adopted projections of future Bay Area land use growth, including the distribution and nature of that growth across the region’s individual jurisdictions. In 2021, ABAG adopted its most recent regional land use forecast as part of Plan Bay Area 2050, which indicates that San Francisco will absorb over 213,000 additional households between 2015 and 2050, bringing the number of households to 578,000. Employment in San Francisco is projected to increase by 236,000 jobs between 2015 and 2050, bringing the total to more than 918,000 jobs located in the city.
In January 2023, the Housing Element 2022 Update was adopted, responding to San Francisco’s Regional Housing Needs Allocation (RHNA) assignment of planning for over 80,000 housing units. It is San Francisco’s plan for meeting housing needs for the next 8 years, from January 31, 2023 to January 31, 2031. The update is the City’s first housing plan centered on racial and social equity. The goals of the update were to recognize the right to housing, repair harms of racial and ethnic discrimination, foster racial and social inclusive neighborhoods, provide sufficient housing for existing residents, and promote well connected, healthy, and culturally rich neighborhoods. Its policies and programs express San Francisco’s collective vision for the future of housing, policymaking guidance, housing programs, and the allocation of resources. These policies and programs address constraints to housing production, affirmatively further fair housing, environmental justice issues, equal housing opportunities, development of housing, existing housing stock, and the preservation of units at risk of conversion from affordable to market rate. The update and policies were developed through robust outreach and engagement. The extensive outreach was accompanied by the required analysis of housing needs,site inventory, and government and non-government constraints, as well as the evaluation of the 2014 Housing Element and an assessment of fair housing.
In June 2025, Mayor Lurie introduced the San Francisco Family Zoning Plan. The Family Zoning Plan is a set of changes to San Francisco’s zoning rules that will allow new homes to be built in more neighborhoods across the City. These changes are required by state law and emphasizes property in the western and northern parts of San Francisco, specifically in and near the areas designated by the state as Housing Opportunity Areas, or neighborhoods with greater access to parks, quality schools, better environmental conditions, and higher median incomes. The plan aims to expand housing affordability and availability by allowing for increased density throughout the City, especially along transit and commercial corridors, in order to meet San Francisco’s Regional Housing Needs Allocation requirements set by the State of California.
The Transportation Authority supports community-based transportation improvements by leading and funding neighborhood-focused transportation planning studies. These efforts help address community transportation concerns and engage community leadership in the transportation planning process, especially in underserved and disadvantaged communities. Since the authorization of Prop K in 2003, the Transportation Authority, working with other agency partners, has completed more than a dozen neighborhood transportation plans, many of which were funded with grants from the Metropolitan Transportation Commission’s Community Based Transportation Planning (CBTP) program, which focuses planning resources in minority and low-income communities.
The Transportation Authority also manages the Neighborhood Transportation Program (NTP), a Proposition L funded program established to support community-based neighborhood-scale planning efforts and transportation improvements in San Francisco neighborhoods, especially in underserved neighborhoods and areas with vulnerable populations (e.g. seniors, children, and/or people with disabilities). The NTP has a planning component to fund community-based planning efforts in each Supervisorial district, and a capital component intended to provide local match to help advance and implement capital investment and pilot recommendations stemming from NTP and other community-based planning efforts. The goal of the program is to help neighborhoods create a pipeline of grant-ready projects that have a high degree of community and agency consensus. Another objective of the program is to increase the capacity of neighborhoods and Community-Based Organizations (CBOs) to undertake neighborhood transportation planning.
A list of plans developed with the support of the Community Based Transportation Planning program and the Neighborhood Transportation Improvement Program can be found in Appendix 6.
The CMP-based land use analysis program links the City’s land development decisions to conditions on the regional transportation system. This link already exists at the regional level in MTC’s Regional Transportation Plan (RTP), which links long-range planning for transportation investment with estimates of land development based on regional demographic growth and economic development. San Francisco’s approach to conformance with the CMP land use impacts analysis requirements is based on the existing process administered by the Planning Department. The Planning Department works from its Transportation Impact Analysis Guidelines for Environmental Review. In 2019, the San Francisco Planning Commission adopted new Transportation Impact Analysis Guidelines, following their 2016 action to remove LOS as a significant impact on the environment and replaced it with a vehicle miles traveled (VMT) threshold for all CEQA determinations. The Transportation Authority supports the Planning Department and other City agencies evaluation of CEQA transportation impact analysis by providing data and tools to measure VMT, consistent with SB 743, for assessing transportation impacts. More information on CEQA transportation impact analysis can be found in Appendix 6. The Transportation Authority also coordinated with other San Francisco agencies to develop the Transportation Sustainability Fee (TSF), an impact fee on new developments to fund transit improvements to offset impacts established through a nexus study. The TSF fee schedule is updated to account for inflation. The TSF replaced the Transit Impact Development Fee (TIDF), originally established in 1981.
The Transportation Authority will continue to work jointly with City departments and regional agencies to assess the transportation impacts of planned growth, to better link transportation and land use planning, and advance climate change-related goals related to transportation. Specifically, the Transportation Authority will:
KEY TOPICS
California Government Code 65089(b)(5) requires that the CMP contain a seven-year Capital Improvement Program (CIP), developed by the Congestion Management Agency (CMA), the Transportation Authority for San Francisco, to maintain or improve the transportation system performance measures established in the CMP, and to address impacts on the regional network, as identified through the land use impact analysis program.
The CMP statute requires that each CMP be consistent with the long-range Regional Transportation Plan (RTP), and each county’s component of the RTP must be supported by a long-range countywide transportation plan (San Francisco Transportation Plan, or SFTP), developed by the CMA. The CIP is intended to serve as a short or medium-range implementation vehicle for investment priorities as prioritized in the long-range plans.
Additional details on the RTP and SFTP can be found in Appendix 7.
San Francisco voters in November 2022 approved Proposition L, the half-cent sales tax for transportation, and adopted a new 30-year Expenditure Plan, superseding the Proposition K sales tax on April 1, 2023. The 30-year Expenditure Plan directs $2.6 billion (in 2020 $’s) to a list of transportation projects that are intended to help implement the long-range vision for the development and improvement of San Francisco’s transportation system, as articulated in the San Francisco Transportation Plan (SFTP) 2050. In 2010, San Francisco voters approved Prop AA, authorizing an additional $10 vehicle registration fee on motor vehicles registered in San Francisco. Prop AA revenues fund projects in a 30-year Expenditure Plan and are meant to complement Prop L funds.
The Transportation Authority ensures that the CIP conforms to air quality mitigation measures for transportation-related vehicle emissions, as detailed in the Bay Area Air Quality Management District’s (BAAQMD) Clean Air Plan and related documents. This also raises San Francisco projects’ competitiveness for external funds, since the MTC gives priority to proposed projects that support or help implement the mitigation measures outlined in the 2017 Bay Area Clean Air Plan as developed and adopted by BAAQMD.
See Appendix 5 for San Francisco’s trip reduction efforts in relation to the regional mitigation measures.
Each City department develops its own capital investment plans for inclusion in San Francisco’s ten-year Capital Plan. In addition to the citywide Capital Plan, the SFMTA has multiple short-term and long-term processes to prioritize its capital needs, including its 2021 – 2025 Capital Improvement Program, Strategic Plan, Transit Fleet Management Plan, Short Range Transit Plan, and the 2017 Facilities Framework. Five regional transit operators that serve San Francisco also develop their own capital plans and Short Range Transit Plans: BART, AC Transit, SamTrans, Golden Gate Transit, and Caltrain. The Transportation Authority considers these plans as an input into its programming process to facilitate better coordination of San Francisco programming decisions with citywide and regional priorities in compliance with CMP requirements. Also see Section 7.3.
The San Francisco City Charter assigns responsibility to the Planning Department for consistency review of capital improvements with the General Plan. This consistency review function is incorporated into the Transportation Authority’s CIP programming process. If necessary, projects in the CIP may be submitted to the Planning Department for a General Plan consistency check. However, in practice, this is not typically required as the SFTP is consistent with the General Plan.
Each City department or other eligible project sponsor develops its own capital investment plans. The Transportation Authority steers the overall multiagency programming strategy and analysis of trade-offs, with a particular focus on the fund sources included in this CIP. The Transportation Authority review process uses information already developed by project sponsors. The most significant value added by the Transportation Authority’s review process is in providing an overall context for transportation programming strategy and system performance to facilitate Transportation Authority Board decisions. Key roles and responsibilities of the City departments and the Transportation Authority in the transportation programming process are summarized below.
Listed below are major CIP funding sources administered by the Transportation Authority. Importantly, as described in the Relationship with Other Plans section, the Transportation Authority ensures that all CIP projects, as well as the programming and project selection processes, are consistent with the RTP, SFTP, and other requirements attached to the funding.
Detailed descriptions of each funding source listed can be found in Appendix 7:
The previous sections describe the central role of the CMP in establishing standards and measuring or otherwise assessing the performance of the multimodal transportation system, and the role of the CIP in helping to maintain that level of performance. Any proposed changes to CIP projects must therefore first be assessed by the Transportation Authority for potential effects on the system performance. There are two kinds of CIP amendments: policy level and administrative level. These types of amendments are described in detail in Appendix 7, which also described the applicability of CIP amendments, and the amendment process.
One of the key purposes of the CMP is to establish the link between transportation investment and system performance. Programming projects in the CIP is only half of the picture. To be effective, the CIP must also function as a transportation project delivery mechanism. Failure to deliver projects or delays in implementation can affect system performance. Further, depending upon the fund source, delay in obligating funds or implementing a project can result in loss of funds to the project, to San Francisco, and/or to the Bay Area. In the long run, poor project delivery rates can influence state and federal authorization levels for transportation funding, leading to fewer resources to dedicate to maintaining and improving the transportation system.
The Transportation Authority has mechanisms in place for tracking Prop L, Prop AA, and TNC Tax project delivery (i.e., the Strategic Plan, 5YPPs, the Portal, MyStreetSF.com, and ongoing project management oversight activities). As a CMA, the Transportation Authority continues to work with the MTC and Caltrans to monitor project delivery rates for projects programmed in the RTIP and federal TIP and serve as a resource to facilitate and advocate for San Francisco sponsors.
The Transportation Authority will continue to work jointly with city partners and other eligible project sponsors to recommend funding for projects identified in capital investment plans, and steer the programming strategy and analysis of trade-offs with a particular focus on Transportation Authority Board decisions for the fund sources noted in this chapter.
KEY TOPICS
California Government Code section 65089(c), requires that each Congestion Management Agency (CMA), in consultation with the regional transportation planning agency (the Metropolitan Transportation Commission (MTC) in the Bay Area), the county, and local jurisdictions, develop a uniform database on traffic impacts for use in a countywide transportation computer model. The CMA must approve computer models used for county sub-areas, including models used by local jurisdictions for land use impact analysis. All models must be consistent with the modeling methodology and databases used by the regional transportation planning agency.
Congestion management legislation was enacted in part to help transportation planning agencies identify the source of the transportation impacts of land use decisions. All Bay Area counties except San Francisco include multiple local jurisdictions each of which has authority over land use within its boundaries. The transportation impacts of decisions made in one local jurisdiction are felt across local jurisdictional boundaries. The travel demand model is intended as a technical tool to analyze land use impacts across local jurisdictions from a uniform technical basis.
As a unified City and County, San Francisco is spared the need to estimate transportation impacts across city boundaries, although inter-county impacts must still be considered. San Francisco’s travel demand forecasting challenge is primarily the forecasting of travel by modes other than the private automobile, (e.g. transit, walking, and biking trips).
The Transportation Authority continually updates and refines their travel demand forecasting model, San Francisco Chained Activity Modeling Process (SF-CHAMP). Since the creation of the original San Francisco model in 2000, the model’s geographic scope has been extended to the full nine-county Bay Area, along with significant improvements to pricing sensitivity and time-of-day modeling. The Metropolitan Transportation Commission (MTC) has developed an activity-based model with a similar structure. In 2018 the Transportation Authority adopted a new demand model — DaySim — within SF-CHAMP that offers significant improvements in several areas. SF-CHAMP 6.1 includes greater temporal detail, a wider variety of activity purposes, smaller zonal resolution, a TNC mode, and the ability to test autonomous vehicle scenarios, among other features. Since DaySim is an open-source demand model that is also used in other regional travel demand models, the Transportation Authority can benefit from improvements made by other regions. In 2023 and 2024 the Transportation Authority developed an updated model version, CHAMP 7(BCE), calibrated to 2019 (“before Covid era”) conditions and informed by the Bay Area Travel Study 2018/2019. Later in 2024 the Transportation Authority also developed CHAMP 7CE to reflect 2023 (“Covid era”) conditions. Calibration of CHAMP 7CE was informed by the 2023 Bay Area Travel Survey. The Transportation Authority is initiating the development of CHAMP 8, which will incorporate Activity Sim, an open source travel demand model system and will scope the development of features to support Treasure Island Mobility Management Agency’s (TIMMA) modeling needs.
The Transportation Authority continues to use its Geographic Information System (GIS) database as a supplemental analysis tool for appropriate CMP purposes. The model is integrated with the Transportation Authority’s GIS database. GIS is ideally suited for the graphic display of model outputs and more detailed spatial analysis. In 2024 the Transportation Authority further integrated GIS capabilities into SF-CHAMP using Simwrapper to develop interactive dashboards, called “topsheets,” to display key model output data. In 2025, the Transportation Authority added interactive validation workbooks also using Simwrapper. Together, GIS and SF-CHAMP can be very effective both for sketch planning and the policy-level travel demand and performance forecasting exercises associated with long-range planning. The Transportation Authority’s integrated model and GIS allow the ready presentation of data using graphics and maps.
The Transportation Authority also collects, curates, and publishes other datasets to support planning, forecasting, and analysis. To improve this practice, the Transportation Authority is developing a data strategy to identify and prioritize data collection needs, and establishing data collection procedures.
A detailed description of the SFCTA’s technical approach to modeling can be found in Appendix 8.
The Transportation Authority will continue to work collaboratively with the Planning Department, MTA, other City agencies, regional transit operators, Caltrans, and MTC to:
AC Transit.
https://www.actransit.org/
Bay Area Rapid Transit.
https://www.bart.gov/
California Government Code Title 7, Division 1, Chapter 2.6 (sections 65088 – 65089.10) ‘Congestion Management’.
https://leginfo.legislature.ca.gov/faces/codes_displayText.xhtml?lawCode=GOV&division=1.&title=7.&part=&chapter=2.6.
California Transportation Commission. Local Partnership Program (LPP) — Formulaic.
https://catc.ca.gov/programs/sb1/local-partnership-program/local-partnership-program-formulaic
Caltrain.
https://www.caltrain.com/
Golden Gate Bridge Highway & Transportation District.
https://www.goldengate.org/
Metropolitan Transportation Commission Planning Committee. MTC Resolution No. 3000, Revised — Congestion Management Program Policy (Updated Apr 2025). File # 25-0428.
https://mtc.legistar.com/LegislationDetail.aspx?ID=7294023&GUID=9006B969-C51F-4C23-8222-91B77A76B946
SamTrans.
https://www.samtrans.com/
San Francisco County Transportation Authority. Congestion Management Program: Reports & documents
https://www.sfcta.org/projects/congestion-management-program#panel-reports-documents
San Francisco County Transportation Authority. Lifeline Transportation Program.
https://www.sfcta.org/funding/lifeline-transportation-program
San Francisco County Transportation Authority. One Bay Area Grant Program.
https://www.sfcta.org/funding/one-bay-area-grant-program
San Francisco County Transportation Authority. Prop AA Vehicle Registration Fee.
https://www.sfcta.org/funding/prop-aa-vehicle-registration-fee
San Francisco County Transportation Authority. Prop K Transportation Sales Tax: Prop K Expenditure Plan Summary.
https://www.sfcta.org/funding/prop-k-transportation-sales-tax#panel-reports-and-documents
San Francisco County Transportation Authority. Prop L Transportation Sales Tax: Prop L Expenditure Plan Summary.
https://www.sfcta.org/ExpenditurePlan
San Francisco County Transportation Authority. San Francisco Freeway Network Management Study.
https://www.sfcta.org/projects/san-francisco-freeway-network-management-study
San Francisco County Transportation Authority. TNC Tax.
https://www.sfcta.org/funding/tnc-tax
San Francisco County Transportation Authority. Transportation Fund for Clean Air.
https://www.sfcta.org/funding/transportation-fund-clean-air
San Francisco Municipal Transportation Agency (SFMTA). Muni.
https://www.sfmta.com/muni-transit
San Francisco Municipal Transportation Agency (SFMTA). Bicycle Ridership Data.
https://www.sfmta.com/bicycle-ridership-data
San Francisco Municipal Transportation Agency (SFMTA). Muni Service Map.
https://www.sfmta.com/maps/muni-service-map
San Francisco Municipal Transportation Agency (SFMTA). Performance Metrics.
https://www.sfmta.com/performance-metrics
San Francisco Planning Code. Transportation Sustainability Fee.
https://codelibrary.amlegal.com/codes/san_francisco/latest/sf_planning/0-0-0-52222
San Francisco Planning Code. Transportation Sustainability Fee Impact Fee Schedule.
https://sfplanning.org/sites/default/files/forms/Impact_Fee_Schedule.pdf
San Francisco Planning Department. Transportation Impact Analysis Guidelines.
https://default.sfplanning.org/publications_reports/TIA_Guidelines.pdf
Vision Zero SF.
https://www.visionzerosf.org/
KEY TOPICS
The San Francisco County Transportation Authority (Transportation Authority) has updated its Congestion Management Program (CMP) every two years since 1991. The Transportation Authority monitors roadway performance with Level of Service (LOS) along its CMP network, which includes all state highways, principal arterials and several other roads as defined in previous LOS monitoring efforts. The Transportation Authority ensures that LOS measurement methods used by its contractors, Caltrans, or other agencies involved in monitoring the CMP network are consistent with State law.
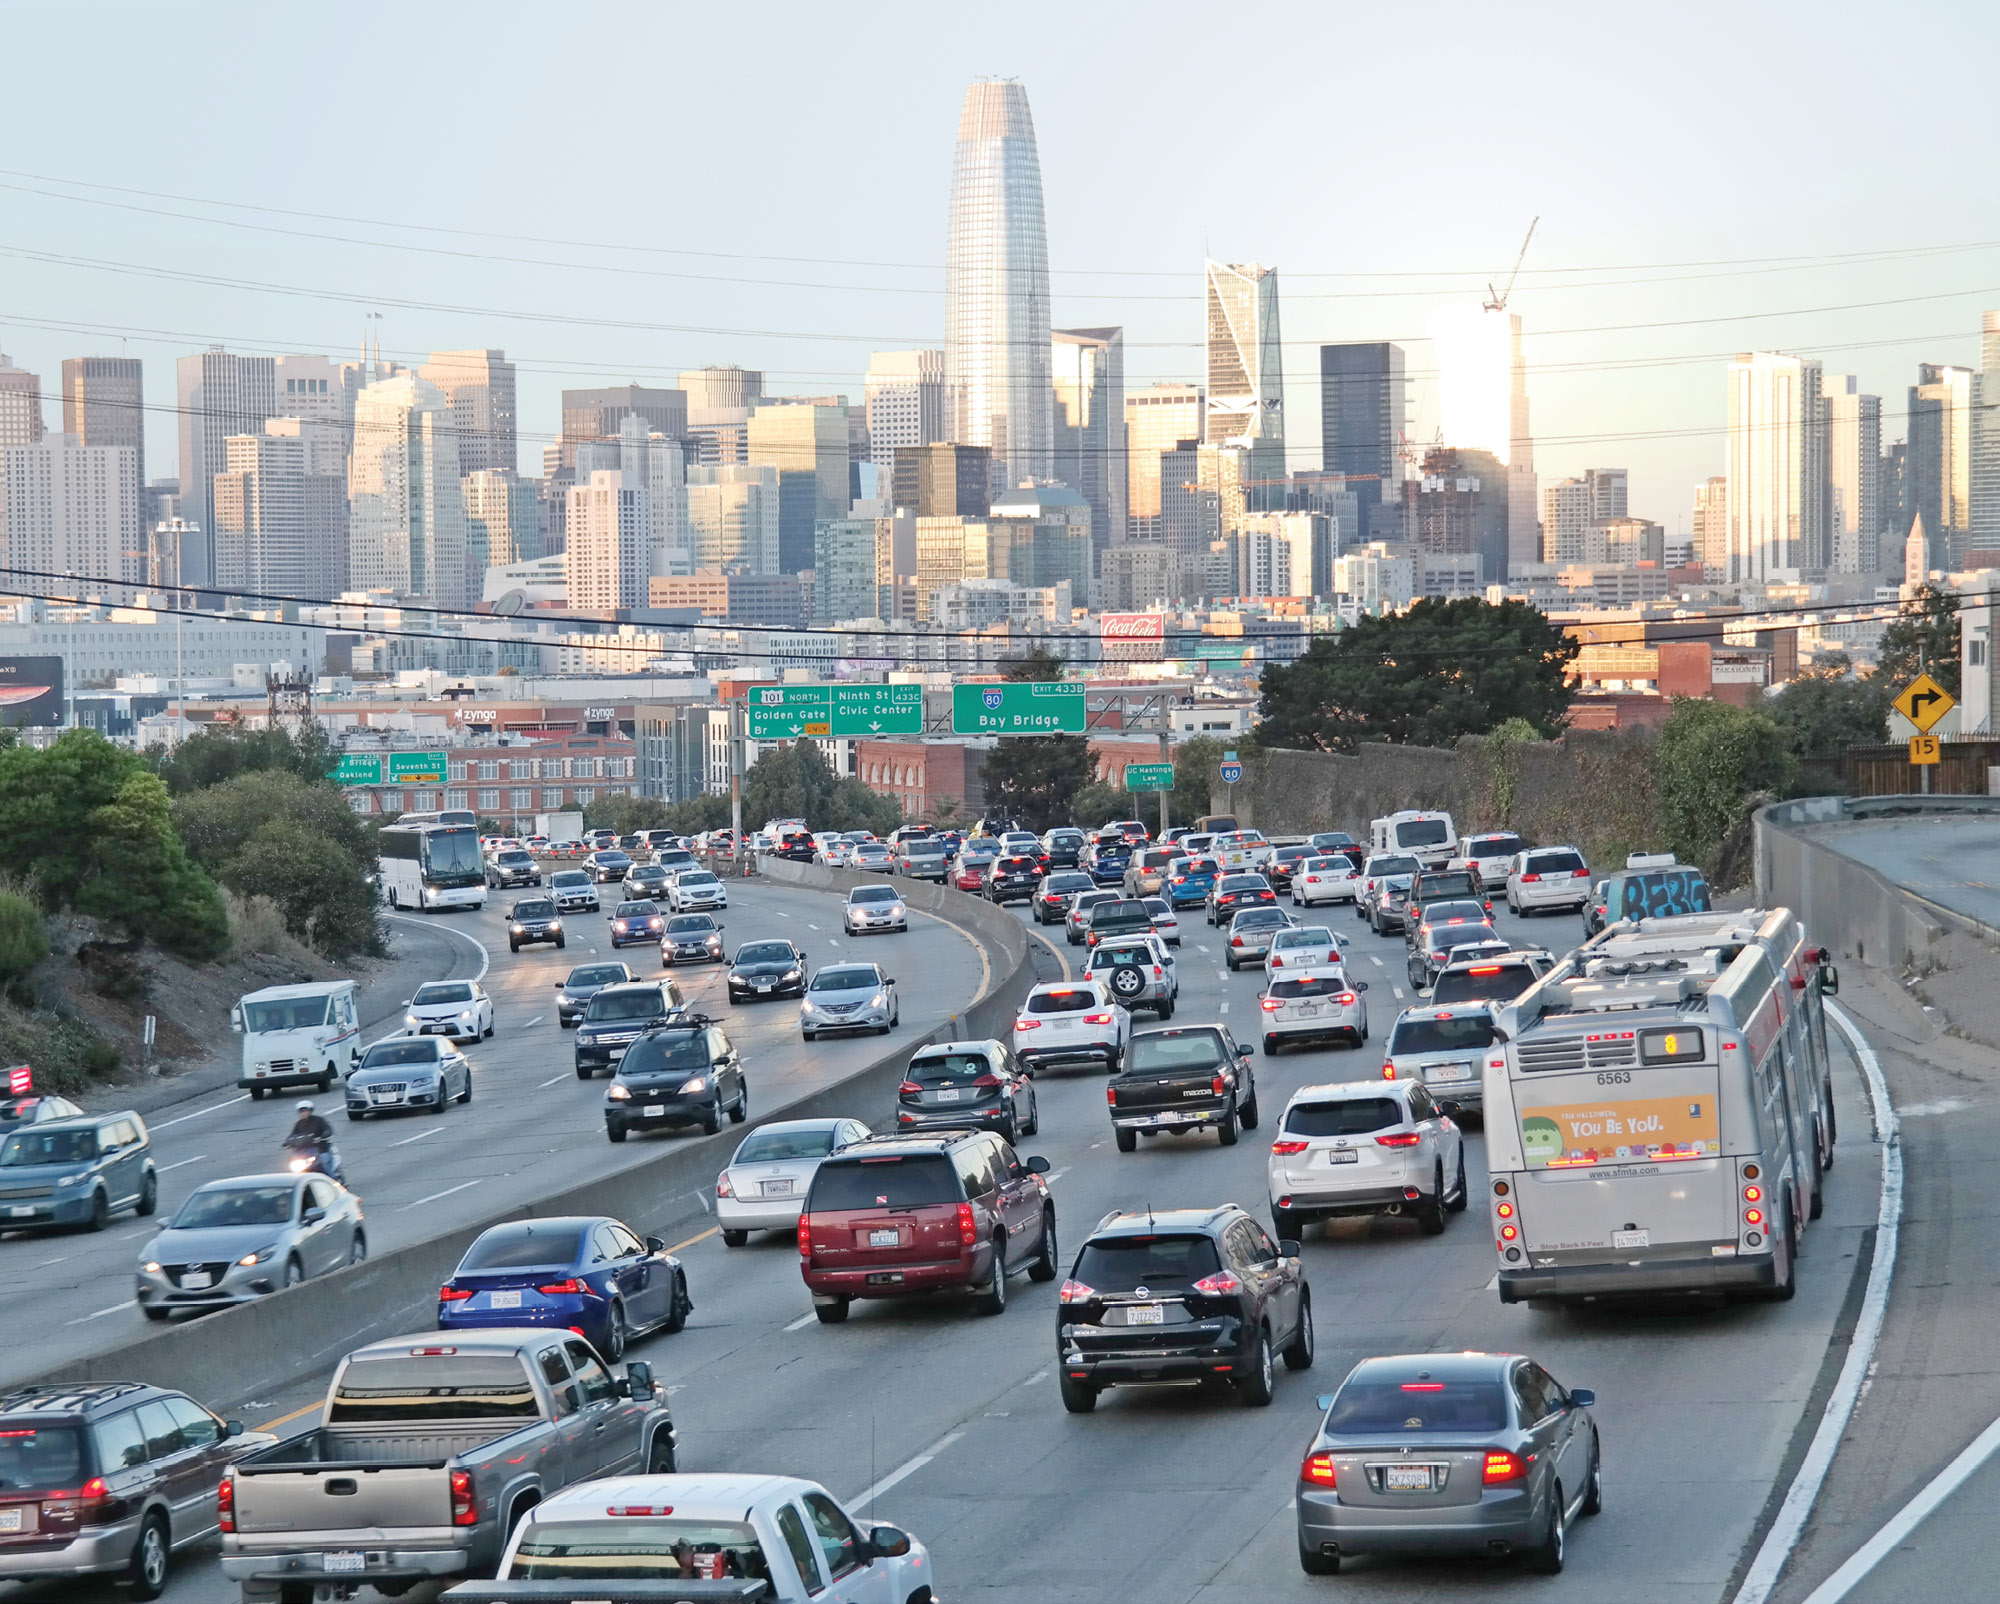
LOS E was the adopted standard in the initial (1991) CMP monitoring. Since 1991, CMP monitoring has been conducted biannually to ensure that non-exempt facilities within the CMP network are operated at LOS E or better.
The Transportation Authority is mandated to prepare a deficiency plan or monitoring follow-up, depending on the applicable exemption, to improve the performance of non-exempt facilities operated at LOS F. The criteria to qualify for the exemption are:
For LOS monitoring purposes, the CMP segments are categorized by exempt or non-exempt status:
Since 2005, speed monitoring has included the exempt facilities in addition to the rest of the CMP network. Figure A1-1 and Figure A1-2 show segments that are exempt from LOS standards because they were found to be LOS F in the inaugural CMP cycle, while Figure A1-3 shows CMP network segments that are exempt from LOS standards due to having more than half of their length within San Francisco’s Infill Opportunity Zone.
Under the above exemptions, the following are the only non-exempt segments in San Francisco:
The CMP network is described in detail in Chapter 3 of the main report. There are no changes to the CMP network from 2023 to 2025.
Since the 2013 CMP update, automobile LOS monitoring was conducted using commercial speed data from INRIX where available, and floating car runs were made to collect data for all other CMP segments for which INRIX data coverage was insufficient. In the 2013 – 2017 cycles, INRIX provided travel time data at one-minute intervals on a unique set of roadway segments called Traffic Message Channels (TMCs).
Since the 2019 cycle, INRIX has provided data at a spatially finer-grained level (XD segments) and the TMC-based travel time data were discontinued, so the Transportation Authority switched to using XD-based travel time data. Consistent with the processing method used in the previous cycles, the XD-based speeds were aggregated to CMP segments spatially and the peak periods temporally.
Data anomalies were identified by Transportation Authority staff in the INRIX XD-based speeds data around summer 2023, when there was an unexplained increase in speeds. Speeds data have stayed elevated since then. Staff believes there is an error in the underlying data or change in data processing methods, although INRIX has not confirmed this.
LOS was assigned based on the average speed observed in the AM Peak and PM Peak periods using both 1985 and 2000 Highway Capacity Manual (HCM) methodologies. Section A3.3.4 provides a detailed description of data processing steps.
The 1985 Highway Capacity Manual (HCM) methodology has been adopted since the baseline monitoring cycle. It is necessary to maintain 1985 HCM for historical comparisons, identifying exempt segments, and monitoring potential network deficiencies. Since 2009, all the arterial segments have also been evaluated using the HCM 2000 classification. Therefore, both the HCM 1985 and 2000 results are presented below.
For freeways, only HCM 1985 LOS was calculated, as the HCM 2000 methodology requires traffic density information for all unique freeway segments and ramps. Collection of comprehensive freeway traffic densities is beyond the scope of the CMP monitoring effort.
In addition to LOS, the buffer time index (BTI) which reflects auto travel time reliability was introduced in the 2021 cycle. The idea behind the metric is that travel times vary significantly during different times of the day and from day to day, and travelers remember these unexpected long delays experienced during their commutes and would therefore budget extra (i.e. buffer) time for the trip in order to reach destination on time. The buffer time here is calculated as the difference between the 95th percentile travel time and the average travel time. Buffer time index is the buffer time divided by the average travel time. It indicates the amount of extra time required to be on-time 95 percent of the time, or in other words, late only one day per month (approximated as 20 working days).
This section summarizes the monitoring days and the conditions that may affect the regular traffic pattern during the monitoring period. INRIX data for every Tuesday, Wednesday, and Thursdays in the months of April and May 2025 were utilized to calculate the average speed of each CMP segment. The morning (AM) and afternoon (PM) peak periods were defined as 7:00 a.m. – 9:00 a.m. and 4:30 p.m. – 6:30 p.m. respectively.
These monitoring periods were also used for transit speed monitoring (see Appendix 2).
There were no public holidays within the monitoring period (Tuesdays, Wednesdays, and Thursdays in April and May 2025). The San Francisco Unified School District (SFUSD) was in session during the monitoring period.
No INRIX data during the monitoring period were removed from analysis due to special, construction, or weather events.
Since the adoption of the 2009 CMP update, there has been a proliferation of archived commercial speed data. This data is collected through real-time GPS monitoring of a variety of sources such as delivery vehicles, navigational devices, and highway performance monitoring systems, and obtained from third-party vendors like INRIX.
As part of the 2011 CMP update, the Transportation Authority explored the reliability of this new data source by comparing results computed from this source to those computed from floating car runs. The analysis found that, although the INRIX data speeds were somewhat higher, on average, than the floating car speeds, the difference was within the typical range of variation for floating car results and that commercial speed data and floating vehicle data were equally acceptable for meeting CMP legislative requirements. For more details about the pros and cons of using commercial speed data, refer to the 2013 CMP report.
In 2013, MTC contracted with INRIX to obtain region wide commercial speed data and has made the data available to the Congestion Management Agency (CMA) and other local governments free of charge for planning and monitoring purposes. The data available from INRIX was in the form of traffic message channel (TMC) links.
In 2019, MTC renewed the contract with INRIX with a major change that the speed data would be on the XD segments, whose length are typically much shorter than those of TMC segments. Due to this segmentation change, the aggregated CMP speeds from XD links and TMC links were found to be inconsistent even with the same underlying data sources. To make an “apples-to-apples” comparison, both 2017 and 2019 speeds based on XD speeds were calculated and reported, and the congestion trends from 2017 to 2019 were derived from them.
Since 2019, the CMP reports have used the XD-based speed data to derive and report auto LOS and reliability metrics.
Data anomalies were identified by Transportation Authority staff in the INRIX XD-based speeds data around summer 2023, when there was an unexplained increase in speeds. Speeds data have stayed elevated since then. Staff believes there is an error in the underlying data or change in data processing methods, although INRIX has not confirmed this.
Floating car surveys were conducted on CMP segments with insufficient INRIX speed coverage. The surveys were conducted using conventional methodologies. Drivers were instructed to follow road rules including the speed limit, traffic signals and not block intersections. GPS coordinates are recorded as the floating car travels along the CMP segment. The temporal aggregation of multiple floating car runs on the corresponding CMP segment was performed in the same manner as for the INRIX data, explained in Section A3.3.4 below.
The data were processed to obtain automobile speed, LOS, and reliability for each CMP segment during the morning and afternoon peak periods. The data processing consists of four steps as shown in Figure A1-4. The following provides more details on the data processing procedure:

This section discusses the methodology for assigning a LOS (A to F) to each CMP segment for both morning and afternoon peak periods. The LOS assignments for arterials and freeways are consistent with previous reporting periods and legislative requirements from the California Government Code. First, each CMP segment was classified as either an arterial or a freeway. The methodology slightly differs depending on this classification, as follows.
LOS for arterial segments was assigned twice using both 1985 and 2000 Highway Capacity Manual (HCM) methodologies. Both methods required identifying the class of the street (HCM 1985 Class I, II or III; HCM 2000 Class I, II, III or IV). Class was determined according to the free flow speed of the road. For example, the free flow speed may be the average speed at 6am when traffic volumes are light and travel speeds are not influenced by interactions with other vehicles.
For the HCM 1985 and 2000, the classification of streets was taken from previous LOS monitoring reports. Then, by knowing the average travel speed in the morning and afternoon peak periods and the class of the street, the LOS could be assigned according to the HCM 1985 and HCM 2000 methodologies. Refer to Table A1-3 and Table A1-4 for the LOS look up tables.
Freeways followed a similar methodology as arterials; however, it was not necessary to assign a class of freeway. The HCM-1985 method was used to calculate LOS for all freeway CMP segments. By knowing the average speed of the freeway in the morning and afternoon peaks, Table A1-5 was used to assign a LOS in each time period.
Speeds for the AM Peak and PM Peak for each CMP road segment from all CMP cycles can be found in Attachment A1-1 and Attachment A1-2. Attachment A1-3 presents the 2025 LOS monitoring results for all CMP segments. For arterials, the results are presented for both the 1985 and 2000 HCM methodologies. Table A1-6 presents summary statistics on the peak period speeds.
As noted above, the Transportation Authority uses the 1985 HCM for calculating LOS when making historical comparisons to the baseline cycle. There are no non-exempt LOS F Segments for the AM Peak or PM Peak this cycle.
Auto travel time reliability represented by Buffer Time Index (BTI) was a new metric added in the 2021 monitoring cycle. Unlike LOS, which indicates the congestion condition based on average speed, BTI provides additional information on variability of travel times experienced by travelers over a certain period of time. It is useful in that travelers can budget extra amount of time in accordance with BTI to ensure on-time arrival 95 percent of time.
Table A1-7 presents summary statistics on the peak period BTI for the current cycle. Attachment A1-4 presents the reliability monitoring results for all segments in the CMP network.
Download attachment data (CSV)
Download attachment data (CSV)
Download attachment data (CSV)
Download attachment data (CSV)
KEY TOPICS

Photo credit: SFMTA Photo Library
The transit speed monitoring was conducted using Automatic Vehicle Location (AVL) /Automatic Passenger Count (APC) data from the San Francisco Municipal Transportation Agency (SFMTA), which tracks transit speeds, boardings, and alightings on SFMTA buses. SFMTA rail vehicles are not included. SFMTA has APC counters on a significant portion of the bus fleet at any given time and rotates the counters between vehicles periodically to collect data on every bus run.
The APC data are valuable for detailed service planning purposes. For broader system performance monitoring and planning purposes, such as the CMP, the APC data can be aggregated to a weekday peak period and have a relatively large sample set. APC data have been used to report transit speeds since CMP 2011 cycle. In 2011, transit speeds were reported on CMP segments for the afternoon peak alone; since the 2013 CMP update, the monitoring effort included both morning and afternoon peak results.
In 2019, the format of the APC data were changed as the SFMTA implemented a new radio-based APC system. The most impactful change from the CMP monitoring perspective was that no records would be generated when a bus passes-by scheduled bus stops, as opposed to generating interpolated time-tramps for the skipped stops as the older system did. To deal with this issue, the processing method was updated to base calculations on individual trips instead of transit stop pairs. This was done by first mapping transit stop pairs to CMP segments as previously did and then aggregating the speeds from the matched transit stop pairs to individual transit trips. Those trip level speeds were lastly processed to compute transit performance measures, including average speed, standard deviation, and coefficient of variation, for CMP segments during AM Peak and PM Peak periods. This approach better reflects overall transit speeds on a CMP segment, and is less susceptible to the impact of localized factors such as traffic signal between stop pairs.
During the analysis, the generated intermediate dataset provided stop-to-stop travel time and speed, inclusive of bus dwell time.Note that door dwell time was excluded for few bus stop pairs to filter out the layover time corresponding to end of the line operations. Specifically, dwell time was assigned to the “upstream” stop: the segment-level data represent upstream stop-arrival point to downstream stop-arrival point. In this way, the processed data correspond with the travel time and through-speed experience by a transit rider as the rider passes multiple stops while on-board. (This is comparable to the manner in which automobile speed is reported by including fully-stopped intersection delay in the calculation of through-travel speed.). The stop-to-stop travel time results with inclusion of upstream dwell time are then aggregated to get travel time of transit trips that are overlapping with the CMP segments.
Following the above methodology, APC data collected on Muni’s bus (diesel and trolley coach) fleet in (the entire months of) April and May 2025 were analyzed. Up to and including 2023, Muni light rail vehicles were not equipped with APCs, and were thus not included in the analysis. Muni light rail vehicles travel time may be included in a future cycle CMP. The raw APC transit data utilized corresponded to the same morning and afternoon peak periods as the Automobile LOS monitoring. The monitoring days were examined through a similar data cleaning process that considered the same special events, construction and weather events that informed the cleaning of the auto monitoring data.
Attachment A2-1 and Attachment A2-2 present the Average Transit Speeds for the morning and afternoon peak periods in the current CMP cycle. The AM Peak and PM Peak transit speeds from the previous CMP cycles are included for comparison.
|
Number of Segments |
Average Speed |
Standard Deviation |
Minimum Speed |
Maximum Speed |
|
|---|---|---|---|---|---|
|
AM Peak Period |
104 |
8.8 |
2.3 |
4.4 |
15.3 |
|
PM Peak Period |
97 |
8.1 |
2.7 |
3.7 |
22.1 |
This section examine the transit speed variability/reliability, and compares the results between 2023 and 2025.
In order to fairly compare the variability of speeds for segments that are fast on average and those that are slow on average, a reliability measure is needed that would not favor one or the other. If the standard deviation alone was used, segments that have higher absolute standard deviations (i.e. most commonly segments with higher average speeds) would be ranked higher than segments that are slower on average. To prevent this, the Coefficient of Variation (CV), the ratio between the standard deviation and the average, is used to measure reliability. The CV is expressed as a percentage of the mean speed, thus both segments with high and low average speeds can be compared on the same scale.
Since it is theoretically possible for segments to be reliably fast, reliably slow, unreliably fast, or unreliably slow, the ideal comparison of these results would show the results in two dimensions at the same time, as is shown in Figure A2-1 below. Most CMP segments have a transit speed between 4 and 14 MPH, with a coefficient of variation between 10% and 35%. The figure shows no clear functional relationship between transit reliability (the coefficient of variation) and its speed.
In 2025, 6% of monitored segments had a CV above 30% in the AM Peak period, whereas for the PM Peak period it was 9%. This is lower than in 2023, when the same metric was at 8% (AM Peak) and 10% (PM Peak). Of the unreliable (CV > 30%) segments in 2025, 2 in the AM Peak had a low sample size (<50), whereas none in the PM Peak had a low sample size (<50).
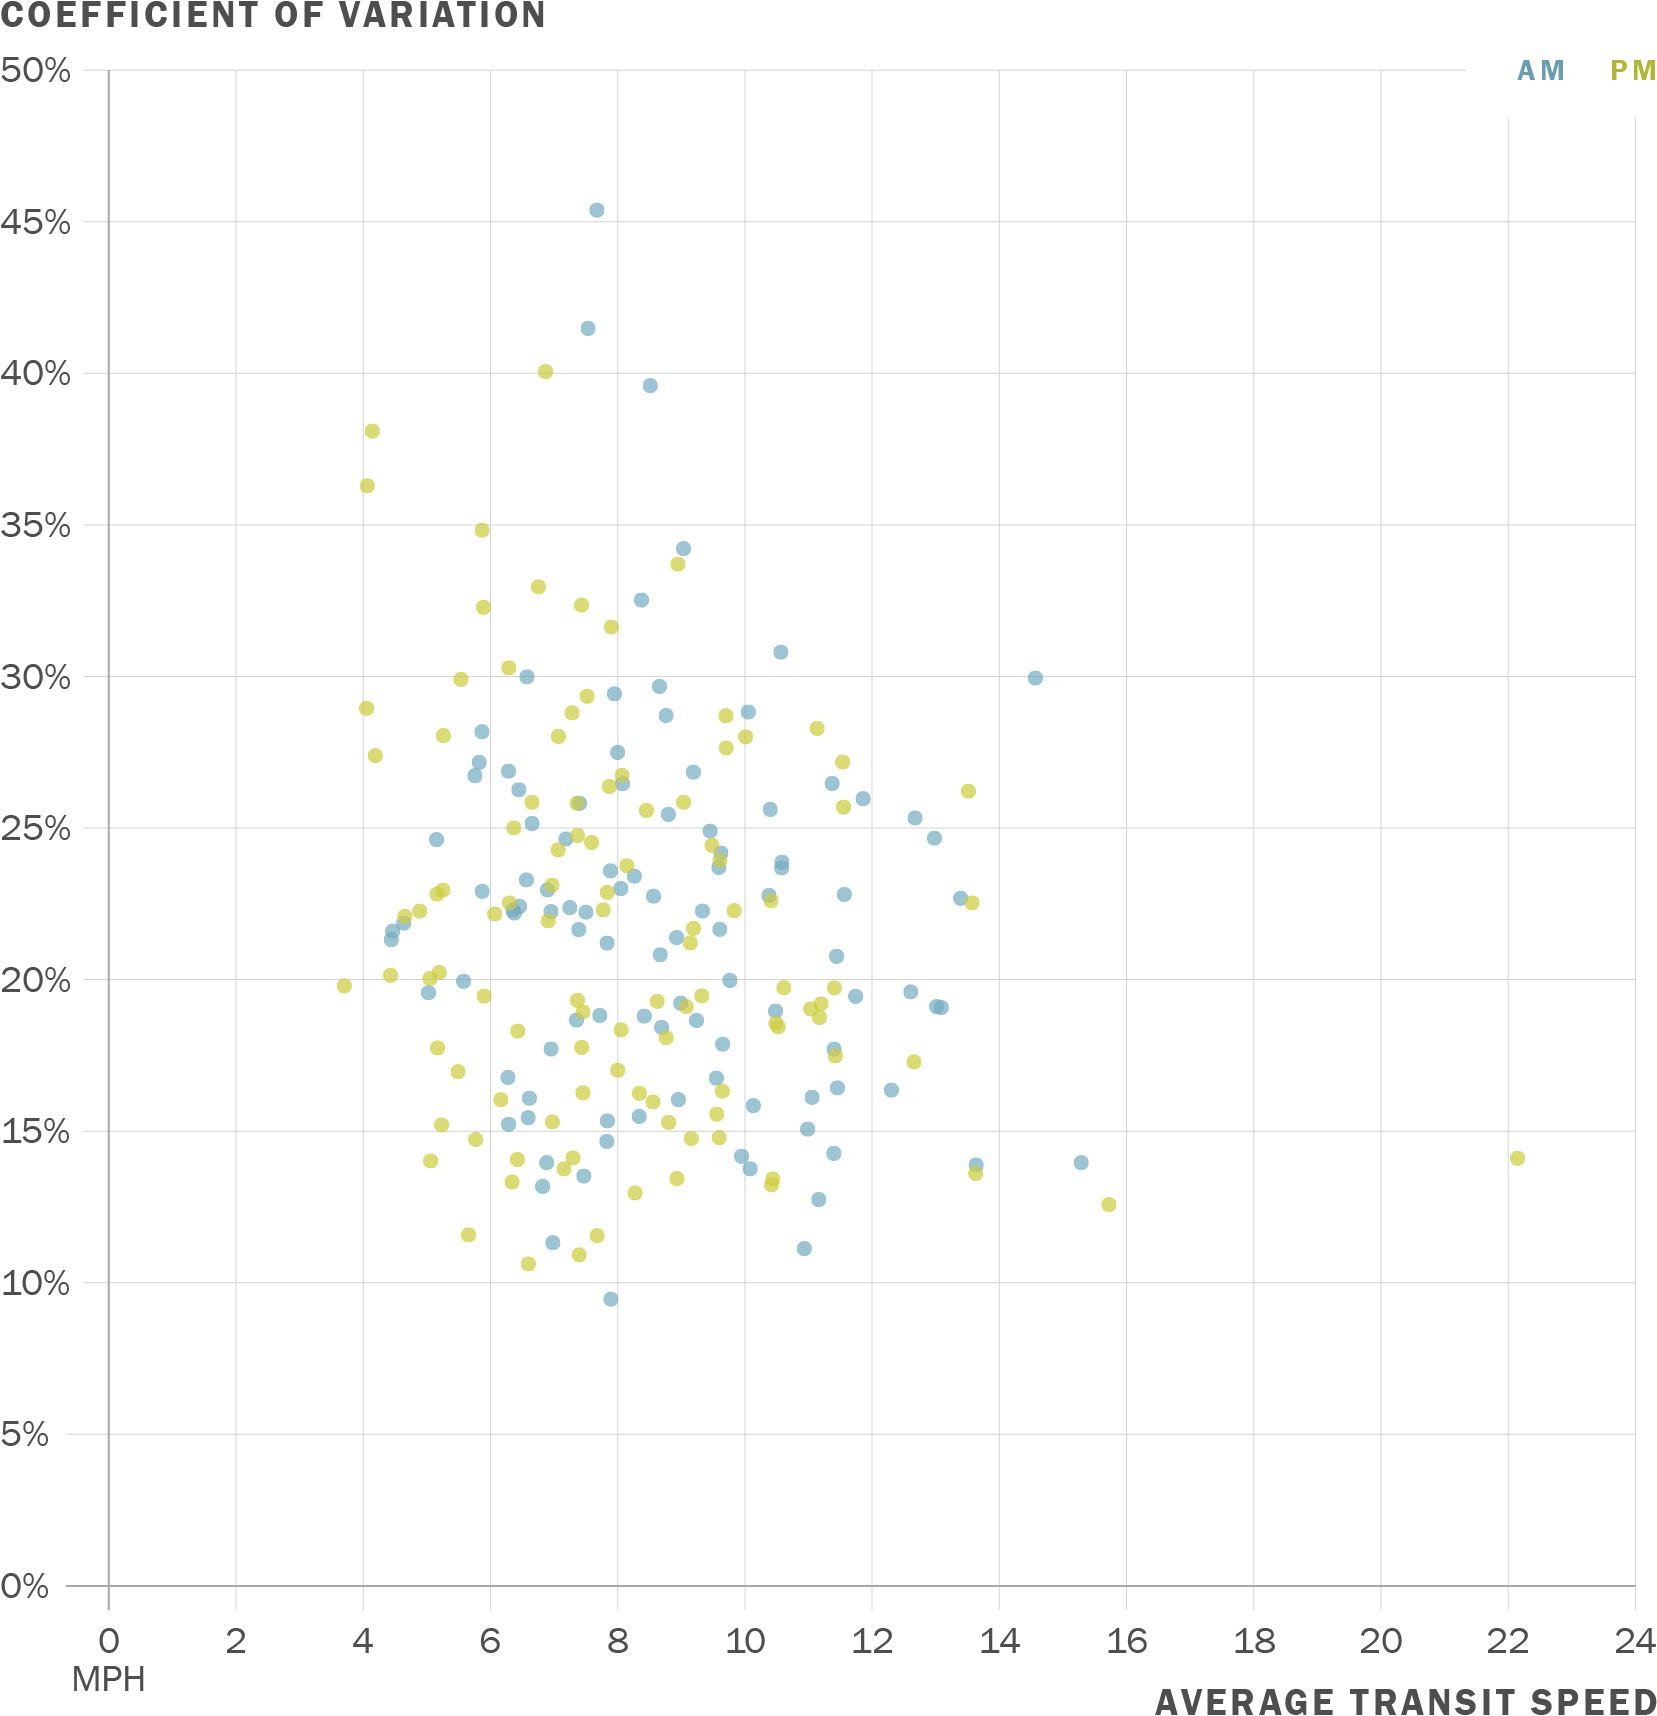
Download chart data (CSV)
Download attachment data (CSV)
Download attachment data (CSV)
KEY TOPICS
In 2023, the Transportation Authority continued to conduct its biennial mid-block and intersection multimodal volume counts. These counts are in addition to the legislatively required CMP performance measures and are therefore not subject to deficiency analyses. Two types of field volume counts were conducted at key locations across San Francisco: turning movement counts and mid-block counts (Figure A3-1). The data collected with these counts are used by agencies for planning and operations activities. Note that construction and other activities at individual sites can affect count numbers.
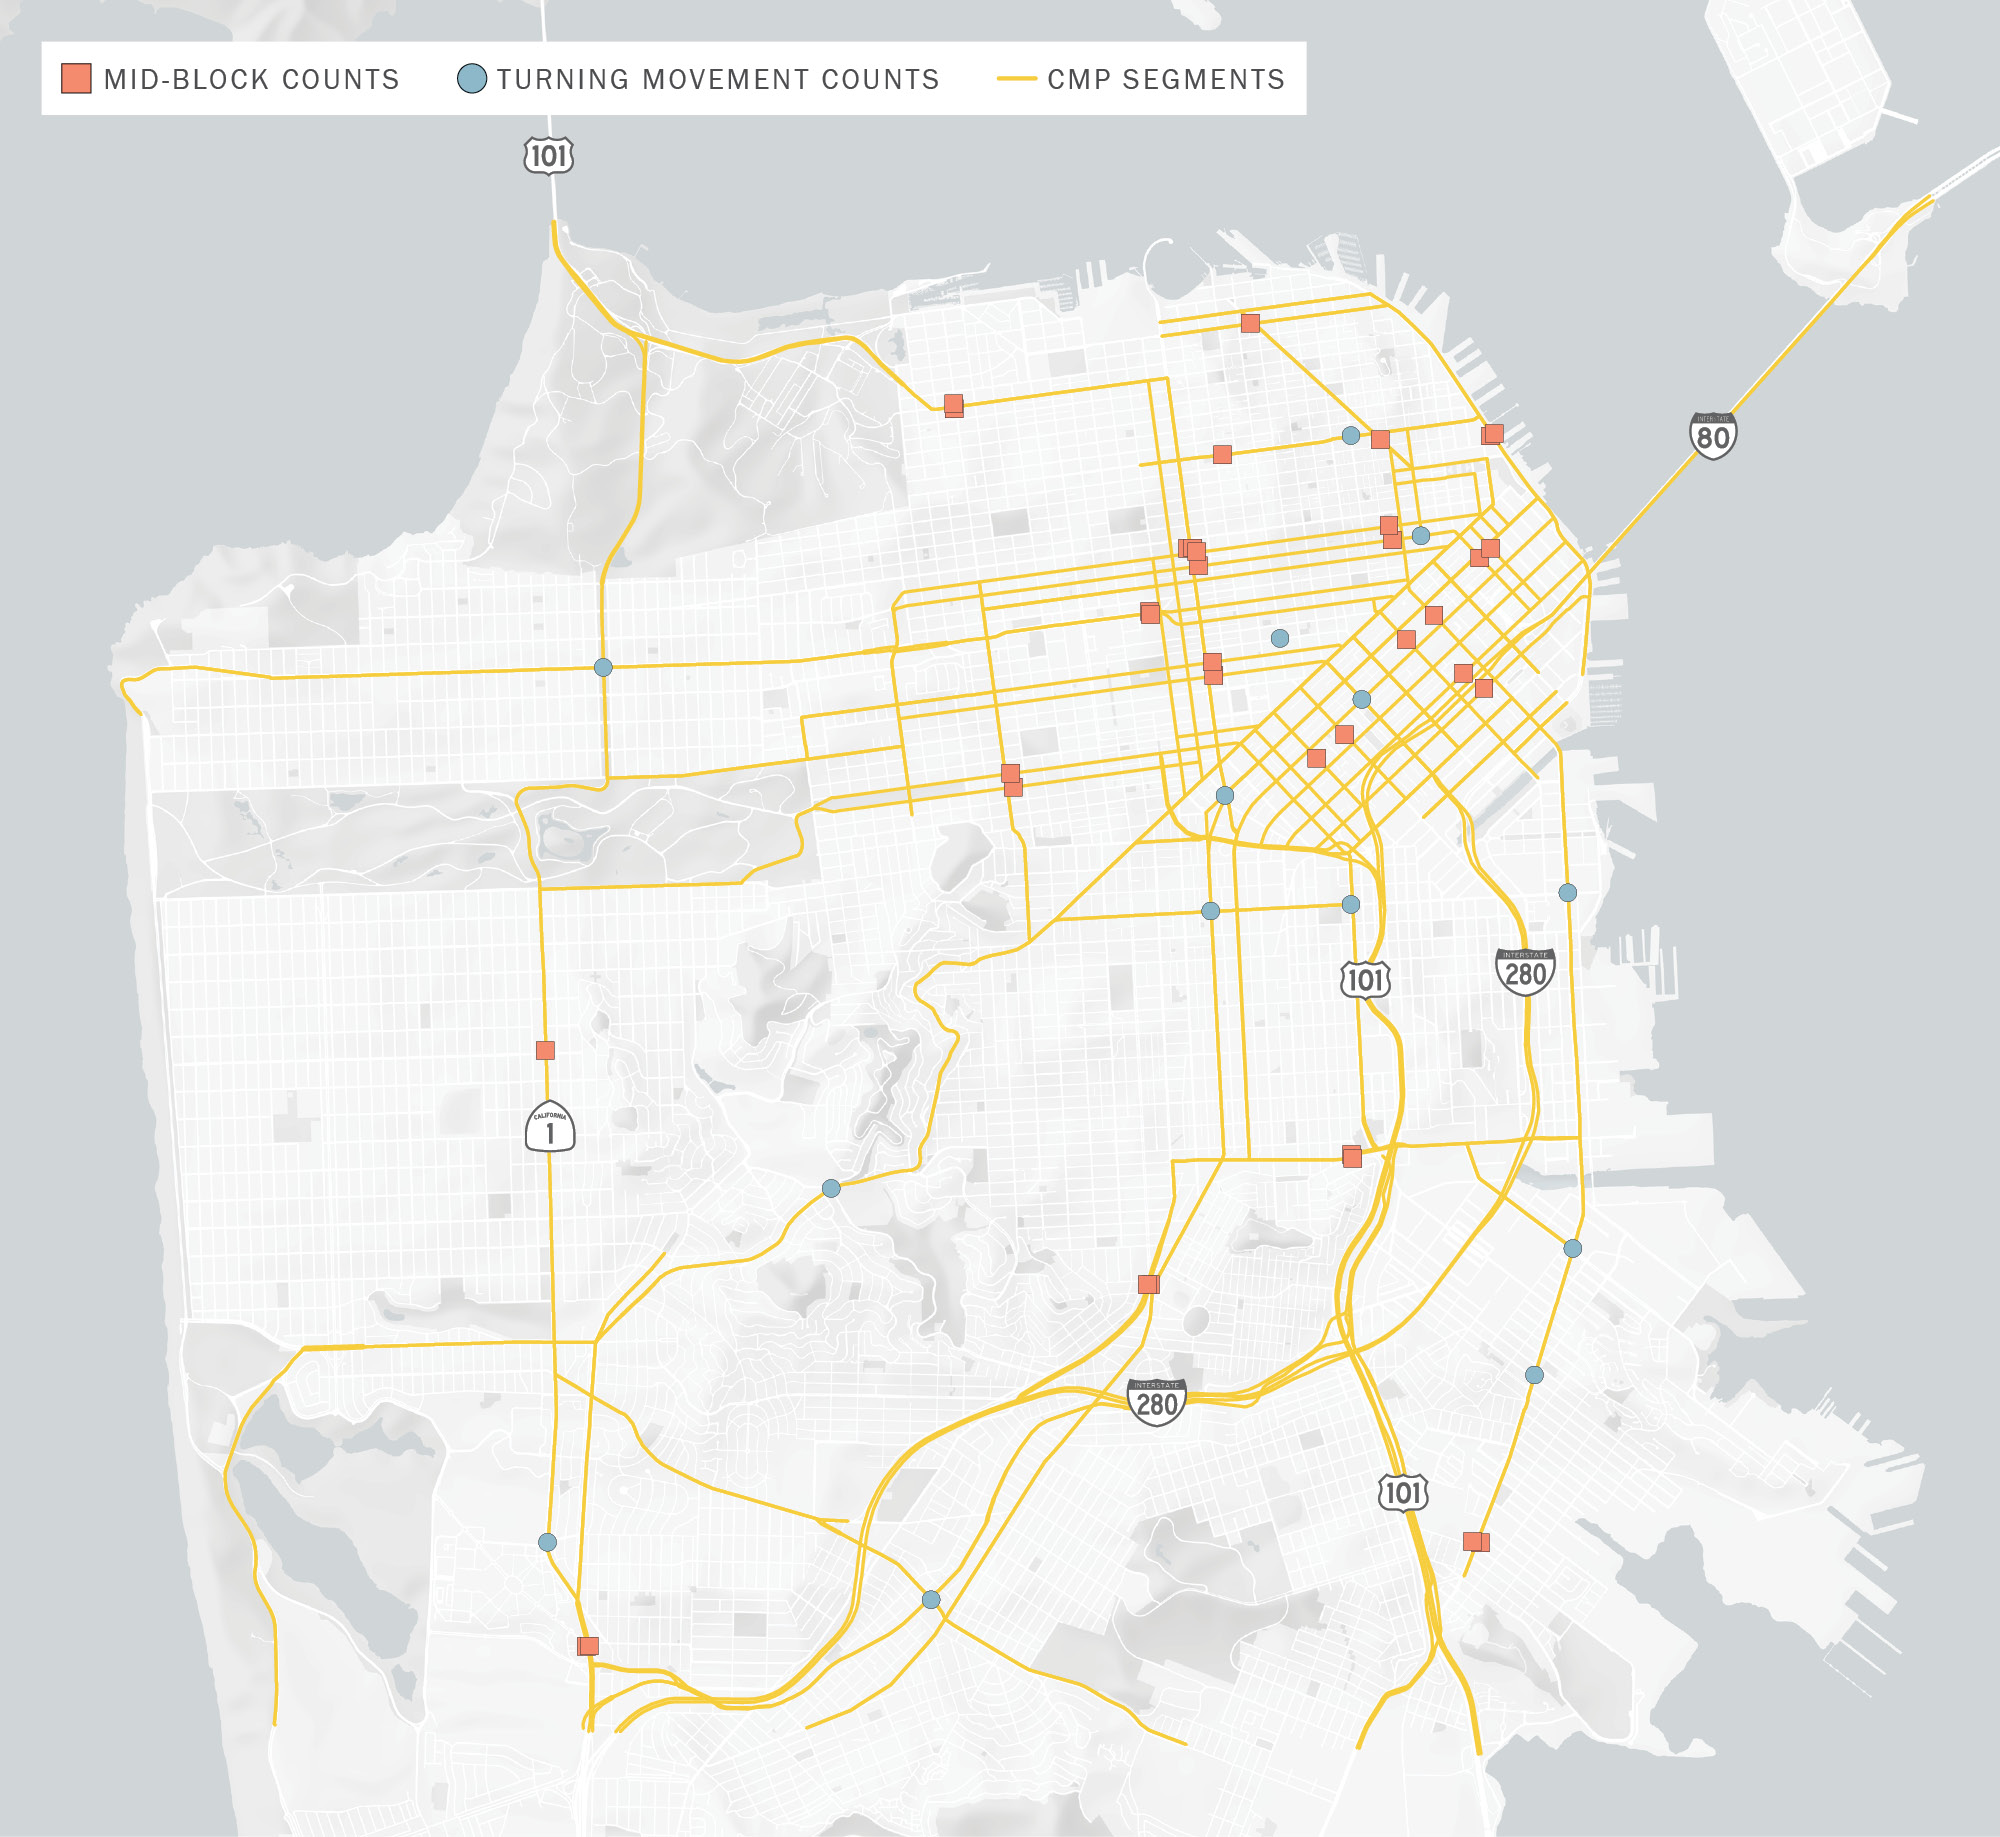
Turning Movement Counts for three modes (vehicles, pedestrians, and bicycle) were conducted at 14 intersections during the a.m. and p.m. peak periods on a single day within the monitoring period (Table A3-1).
Mid-block counts were recorded at 29 locations (of which 16 are one-ways and 13 are two-ways) for at least three consecutive weekdays (Tuesday to Thursday) within the monitoring period. For the CMP 2025, three locations (19th Ave between Moraga and Noriega, Mission St between 24th and 25th, and Van Ness Ave between California and Pine) were extended beyond the three-day monitoring period to record the following Friday, Saturday and Sunday for a total of six days. Results of weekdayI.e., the data were averaged over Tuesday to Thursday/Friday only. average mid-block traffic counts from 2015 to 2025 are shown in Attachment A3-1.The CMP 2023 corrects and publishes previously unreported mid-block average weekday traffic counts from the CMP 2017 to 2021.
Download attachment data (CSV)
Note: NB = northbound, SB = southbound, EB = eastbound, WB = westbound; No data collection at Van Ness Ave Between California And Pine in 2017 due to construction.
KEY TOPICS
The Transportation Element of the General Plan lays out the City’s policy of transit-oriented solutions for accommodating growth in travel demand and discouraging single-occupant automobile travel:
San Francisco is subject to regional air district requirements to implement TDM measures (also referred to as Transportation Control Measures) to address air quality issues. In 1991 as required by the California Clean Air Act (CCAA), the Association of Bay Area Governments (ABAG), the Bay Area Air Quality Management District (BAAQMD), and the Metropolitan Transportation Commission (MTC) jointly prepared the first Bay Area Clean Air Plan, which included measures to reduce the total number of trips and miles traveled, (“Transportation Control Measures,” or TCMs). The most recent Plan, the 2017 Bay Area Clean Air Plan, was adopted by BAAQMD in April 2017. The Plan addresses greenhouse gases, as well as ozone, particulate matter, and air toxics. It also included new and revised TCMs. The 2017 Clean Air Plan focuses on laying groundwork for a long-term effort to reduce Bay Area GHG emissions 40 percent below 1990 levels by 2030 and 80 percent below 1990 levels by 2050. It also updates the 2010 Clean Air Plan, to fulfill state ozone planning requirements and includes all feasible measures to reduce emissions of ozone precursors — reactive organic gases (ROG) and nitrogen oxides (NOx) — and reduce transport of ozone and its precursors to neighboring air basins. In addition, the Plan builds upon and enhances the Air District’s efforts to reduce emissions of fine particulate matter and toxic air contaminants.
Local agencies are expected to incorporate TCMs into planning and implementation for transportation and land use programs. The region, through the MTC, is held responsible for overall progress toward the stated goals. The CMP process provides an opportunity to integrate local planning and programming into the regional air quality planning process. Appendix 5 lists the currently adopted regional TCMs, and discusses how San Francisco’s congestion management strategies contribute to, or reinforce, these measures.
Numerous TDM requirements are included within area plans and negotiated agreements for major developments. Significant examples include the following:
TDM measures are also present in Institutional Master Plans (IMP), which city planning code requires for all medical and post-secondary educational institutions in the City and County of San Francisco; currently 41 institutions are subject to the requirement. IMPs describe any planned campus expansions and present mitigations for reducing the impact of the expansion on the surrounding neighborhood; this could include TDM measures such as shuttles, changes to parking policy, etc. For example, the IMP prepared by the California Pacific Medical Center in 2008 describes the campus TDM program, which includes elements such as free transit passes, vanpool subsidies, and other measures.
Planning Code Section 163 requires that all new development of over 100,000 square feet of new office space (or 25,000 square feet in some districts), or 100 residential units in specific zoning designations undertake measures to mitigate impacts on the transportation system, for the lifetime of the project. Section 163 was first added to the Planning Code in 1985 (Ordinance 414-85) as a means to mitigate the transportation impacts, and thus allow a greater density of development than would otherwise be possible. It was subsequently expanded to all new development of over 100,000 square feet in downtown areas zoned C-3, and has more recently been expanded again to include other non-residential, office space outside of the C-3-O, and residential development
Planning Code 163 requires that project sponsors provide onsite transportation brokerage and management service to building occupants that include coordination, encouragement, and promotion of TDM activities, including:
Buildings can elect to meet Section 163 requirements on their own or by contracting with a City-approved provider (or vendor) of transportation brokerage services or administering TDM services on their own. Currently, TMASF Connects, a non-profit organization, is the only City-approved vendor of transportation brokerage services. TMASF was first incorporated as a non-profit in 1989 and began to provide transportation management services in 1990. TMASF provides information support and promotions to its currently 68 member building tenants to reduce drive alone rates. Its member buildings report a single-occupancy vehicle (SOV) mode share of less than 10 percent in the last several years. TMASF’s activities include providing a website with transportation resources for employers and travelers, publishing a newsletter, issuing traveler alerts, and organizing periodic campaigns to promote sustainable commute alternatives.
As a condition of the Mission Bay Development Plan, the Mission Bay Transportation Management Association (TMA) was formed and began operating in May 2010. The TMA operates shuttle service to and from BART and Caltrain, facilitates TDM marketing, provides bicycle parking assistance, and provides information via a website. Membership includes all property owners and developers, including the recent addition of the Golden State Warriors with the completion of Chase Arena in Fall 2019. According to the 2017 Mission Bay Annual Report, annual shuttle ridership has experienced declines since peaking at over 375,000 in 2014 to under 325,000 in 2017. Mission Bay TMA shuttles serve multiple areas of the City, not just Mission Bay, and the service area has changed over time as the district has been built out and partnerships with other areas have been established and ended.
The San Francisco Planning Code contains numerous additional requirements to help ensure new developments include features to support sustainable transportation. For example:
In August 2008, the City enacted a landmark Commuter Benefits Ordinance (CBO), which became effective on January 19, 2009. The ordinance requires businesses with locations in San Francisco and more than 20 employees to offer commuter benefits such as transit, vanpool, and bicycle programs to their eligible employees. In 2012, the Bay Area Air Quality Management District (BAAQMD) and the Bay Area Metropolitan Transportation Commission implemented a similar program on a pilot basis, but focused on employers with fifty or more full-time employees in the region (the local ordinance applies to employers in San Francisco with at least twenty employees nationwide).
The San Francisco Department of the Environment (SFE) is working with the region to coordinate both the local and regional ordinances for seamless implementation and program management. SFE works with employers with fewer than 50 employees and coordinates with the region when outreaching to employers with 50 or more employees. To date, 2520 employers subject to the SF Commuter Benefits Ordinance have submitted a compliance form, with a cumulative 25,000 employees participating in their employer’s commuter benefit program.
Numerous employers, educational institutions, medical facilities, office buildings, and transportation management associations offer shuttle service to their employees, students, and clients. Some buildings are required to provide shuttle service as part of their conditions of approval, and an employer may comply with San Francisco’s Commuter Benefits Ordinance by offering a free commute shuttle to employees. The majority of the commuter shuttles are closed systems that provide service to a specific population and are not open to the general public. Most shuttles are provided for free to employees (or students, tenants, etc.).
In 2014, SFMTA launched the Commuter Shuttles Pilot Program to create clear and enforceable locations and guidelines for private shuttle loading and unloading and reduce conflicts with Muni and other vehicles. In October, 2015, SFMTA released a Commuter Shuttle Policy that permits ongoing use of the shared stops subject to additional requirements. In February 2017, SFMTA approved the continuation of the Commuter Shuttle Program, based in part on a mid-year evaluation and commuter shuttles hub study. The hub study, conducted jointly by SFMTA and the Transportation Authority, found that a “hub” model, which would concentrate commuter shuttle stops at a small number of designated locations in the city, would dramatically reduce shuttle ridership, increase driving by current shuttle riders, and increase the risk for crashes in the city. The mid-year evaluation found that the existing program had led to a lower potential for conflicts with Muni, fewer shuttles on small, residential streets, a cleaner vehicle fleet, a reduced potential for service disruptions, including those arising from labor disputes, and increased enforcement for violations of parking laws. The updated program allows the SFMTA to establish shuttle vehicle accessibility guidelines and to issue higher penalties for repeated violations of the shuttle permit terms and conditions.
Carsharing programs are encouraged in San Francisco as a means to reduce car ownership and decrease VMT.Cervero, R., Golub, A., & Nee, B. (2007). City CarShare: Longer-term travel demand and car ownership impacts. Transportation Research Record: Journal of the Transportation Research Board, 1992, 70-80. The precise number of car sharing members in San Francisco is unknown but is likely increasing, as new car sharing vendors like GIG Car Share expand the market.
To further encourage car sharing, SFMTA developed a car sharing policy in 2013. The policy outlines the On-Street Car Sharing Pilot Program whereby private car sharing companies can apply to use on-street parking spaces for car share vehicles. As of December 2019, 237 on-street parking spaces were reserved for car share vehicles. A 2017 evaluation of the pilot program found that car share cars enrolled in the program were in use 6 hours a day, relative to 1 hour a day for a private vehicle, and were used on-average by 19 unique users per month.
The General Plan, Planning Code, and Zoning Code guide parking management in San Francisco. San Francisco’s existing parking policies are intended to support the city’s development, and have been especially successful in the downtown area by limiting the provision of parking provided with new office development. Parking policies are also designed to support the City’s Transit First policy through a combination of regulatory controls, revenue transfers, regulations, and incentives. In November 2007, San Francisco voters approved Proposition A, which shifted responsibility for parking regulations, fees, and fines from the Board of Supervisors to SFMTA. In 2007, the Transportation Authority and the Metropolitan Transportation Commission (MTC) applied for and subsequently received a U.S. Department of Transportation (USDOT) Urban Partnership Program (UPP) grant, which includes $19.4 million for a demonstration of variable parking pricing as part of the Federal initiative to fight congestion. SFMTA’s SFpark program was a demonstration project funded through the Department of Transportation’s Urban Partnership Program where the SFMTA used several strategies to make it easier to find a space and improve the parking experience, including:
SFpark piloted and cultivated several emerging technologies, including smart meters, parking sensors, and a sophisticated data management tool. The demonstration ran from 2010 – 2014, after which SFMTA evaluated the program. The evaluation found several benefits including better parking availability, improved ease of payment, and reduced circling for parking and associated reductions in greenhouse gas emissions and vehicle miles traveled, among other benefits. After the end of the pilot demonstration, the SFMTA Board established an ongoing demand-responsive parking policy, with meter rate adjustments made approximately once a quarter. Using meter payment data to estimate parking occupancy, the SFMTA raises the rate by $0.25 on blocks where average occupancy is above 80%, lowers the rate $0.25 on blocks where average occupancy is below 60%, and does not change the rate on blocks that hit the target occupancy between 60% and 80%.
SFMTA continues to evaluate and incorporate emerging technology and best practices as part of their ongoing curb management work. The agency is currently engaged in a process to create a digital database of all curbside parking regulations citywide, making it easier to understand and adjust regulations beyond paid parking zones. While the current phase of work does not include the collection or maintenance of occupancy data outside of paid parking areas, the functionality to store occupancy information is anticipated to be incorporated in the database should future phases of the effort warrant this expansion.
The San Francisco Department of Environment (SFE)’s Emergency Ride Home (ERH) program promotes sustainable commuting by ensuring a free or low-cost ride home in cases of emergency. The program pays for a ride home for employees of registered businesses in the event of illness, severe crisis, unscheduled overtime, or disruption of carpool or vanpool schedules. The program is designed to remove some of the risks and reliability concerns associated with the choice of carpooling or relying on transit service for the commute trip. SFE promotes the ERH program to City employees and all San Francisco employers and commuters.
SFMTA encourages the use of carpools and vanpools during the morning and evening commutes. The City provides a casual carpool pick-up location on Beale Street between Howard and Folsom, adjacent to the Temporary Transbay Terminal site. At this location, there is signage indicating several East Bay destination locations.
SFMTA also administers a program through which major employers (those with Transportation Brokerage Services described above) may provide parking for employee carpool vehicles (three or more riders) in City-owned garages at a reduced rate. The City also provides a limited amount of designated on-street parking in the downtown area for registered/permitted vanpool vehicles.
Bay Wheels, formerly known as Ford GoBike and Bay Area Bike Share, opened on August 29, 2013 with 700 bikes at 70 stations in San Francisco and along the peninsula as a pilot program of the Bay Area Air Quality Management District and the Metropolitan Transportation Commission (MTC). Originally operated by Alta Bikeshare, MTC transferred operations to Motivate in May of 2015, and in 2017 Motivate expanded the program to 5 Bay Area Cities with 540 stations and 7,000 bicycles, including a substantial expansion within San Francisco. Currently, there are over 300 stations in San Francisco. The bike share system is integrated with the clipper card program, allowing both individual trips and memberships to be accessed via the clipper card. In 2018, Lyft purchased Motivate and assumed operations of Ford GoBike, changing the name to Bay Wheels in 2019.
Currently, dockless e-bikes make up half of the Bay Wheels fleet. In 2023, the MTC and Lyft reached an agreement on a $16 million expansion of the Bay Wheels system. The expansion includes over 1,000 next-generation docked-only e-bikes and 19 new stations in San Francisco. Several stations will support in-dock charging to reduce operational vehicle miles traveled due to less battery swapping. The expansion also includes membership price reductions and a discounted student membership pilot.
The City of San Francisco’s Department of the Environment is conducting a pilot program that provides free e-bikes to delivery workers. The pilot is designed to reduce carbon emissions and determine the viability of e-bikes for delivery services. Data will be collected from the e-bikes and compared to a control group of delivery drivers using cars, helping the program operators to evaluate the validity of the delivery e-bikes. The pilot program will provide food delivery workers with e-bikes to use for making deliveries. The program will monitor the impact e-bikes have on delivery efficiency and worker revenue while assessing bike safety. The first phase of the pilot concluded in 2024 and included an initial cohort of 17 e-bike workers and 30 drivers. The pilot reported about 2,300 VMT eliminated and found modest benefits for e-bike workers, including lower operating costs and ease of navigating traffic. However, delivery workers using cars earned more per delivery and received more orders. The second phase of the pilot is ongoing and expands the study population to 80 e-bike riders and 80 drivers.
The SFMTA, Planning Department, and SFCTA partnered to craft the Travel Demand Management (TDM) Ordinance as part of the Transportation Sustainability Program (TSP). The TDM Ordinance introduced TDM requirements on new construction or changes of land use in San Francisco, and provides a toolkit to aid developers in designing an appropriate TDM program. The toolkit is used to ensure a consistent approach to including TDM in new development and ensuring that the most effective measures are prioritized. The inter-agency team is committed to analyzing the effectiveness of TDM measures, through research, to improve the toolkit by prioritizing the most effective measures. The San Francisco Board of Supervisors approved the ordinance on February 7, 2017.
The SF Moves Pilot was conducted through collecting data on Mission residents’ travel habits using daily text-message polls asking participants to report the number of sustainable trips and car trips they took each day during the Challenge. The more sustainable trips a participant reported and the more text polls they responded to, the greater their chances of winning a prize.
The target geographic area of the Challenge was San Francisco’s Mission neighborhood — specifically the four-block radius around the 20th and Shotwell Slow Streets, the latter of which was made permanent in August 2021. SFE chose this area for the pilot due to its ample access to low-carbon transportation options, and high concentration of Black, Indigenous, and people of color (BIPOC) residents.
The target audience of the Challenge was Mission residents with a particular focus on Spanish-speaking and low-income residents. The Challenge was run in both English and Spanish, and garnered significant participation in both languages with 75% English language participation and 25% Spanish language participation.
The San Francisco Transportation Plan 2050 identifies TDM as a systematic approach to shift how, when, and where people travel through programs and policies and an effective tool to address the rise in congestion associated with population and job growth. The SFTP recommends that San Francisco establish a vision and measurable goals for the future TDM strategy to guide development, implementation, and monitoring; identify priority geographic areas, trip types, travel markets, traveler types, and success metrics to guide program selection and implementation details; and provide guidance for how to incorporate ongoing evaluation to track impacts on modeshift and cost effectiveness and guide future TDM investments. This recommendation is reflected in the upcoming TDM Market Analysis and an upstate to the 2017 TDM Plan.
This is an effort led by SFMTA to develop and operate a program focused on addressing the transportation needs of employees at businesses that are opening in or relocating to new locations in San Francisco. The program was originally scoped to provide transportation planning services and materials to businesses to help their employees travel to work in their new location without driving alone, thus setting a more sustainable commute habit from the get-go, rather than trying to change habits after they have already been set.
The intention of targeting businesses with a TDM intervention as they relocate was to capitalize on a window of opportunity when large numbers of commuters are selecting a new route to work and have not yet formed mode habits that are difficult to influence. The emergence of COVID and resulting health orders changed the business and commute environment such that identifying and targeting businesses as they moved into San Francisco or moved office locations within San Francisco has become infeasible.
However, public health orders requiring office-based businesses to have their employees work-from-home to the greatest extent possible created a new form of “relocation” — first from the office to remote work locations, followed by a substantial shift of employees returning to their offices when restrictions are eased. After months of working remotely, each returning employee is selecting a new route and mode(s) to their office, shaped by new motivations and constraints, opening a similar opportunity to influence mode choice as exists when a business relocates their office.
For these reasons SFMTA amended the project scope to shift the target population from businesses as they relocate between offices, to all office-based businesses as an increasing number of employees return to office settings.
SFCTA conducted the Eco-Friendly Downtown Deliveries Study to identify and prioritize strategies for low- and zero-emission delivery in downtown San Francisco. The study convened a working group of merchant associations, community benefit districts, delivery companies, and environmental groups. The working group reviewed three potential pilot opportunities to understand which strategies were most likely to advance shared goals and be effective in San Francisco: 1) Off-Hours Delivery Program; 2) Logistics Microhub; and 3) E-Bike Battery Swapping Lockers. The study makes recommendations for an off-hours delivery pilot to shift deliveries on congested commercial corridors to off-peak hours when traffic is less intense and there is less demand for curb space. The study also recommends next steps for a logistics microhub pilot, which can shift deliveries to sustainable modes by providing a location and infrastructure to allow goods to be transloaded from larger freight vehicles to smaller electric or human powered vehicles for last-mile deliveries. The study also makes recommendations for data collection and infrastructure changes needed to support an expanded e-bike delivery workforce and more diverse delivery fleet.
|
Regional TCM |
Local Implementation |
|---|---|
|
A-1. Local and Area-wide Bus Service Improvements |
The San Francisco Municipal Transportation Agency (SFMTA) is currently implementing MuniForward, a major program to upgrade Muni service throughout the city. It includes service and route changes, capital upgrades, and other enhancements to nearly every major bus and rail transit route in the city. Upgrades are designed to make Muni faster and more reliable, and to improve safety. The city also has several major transit improvement projects underway. The Van Ness Bus Rapid Transit Project is currently under construction. The Geary Bus Rapid Transit Project has a Locally Preferred Alternative (LPA) that secured state and federal environmental clearance by 2018. SFMTA is also in the process of replacing its fleet with a goal towards zero emissions. |
|
TCM |
Local Implementation |
|---|---|
|
A-2. Improve Local & Regional Rail Service |
The Muni Forward project mentioned above includes numerous upgrades to Muni rail service. Five of the seven Muni rail line have capital projects underway (either in the study or implementation phase) to improve service quality and reliability. The Transportation Authority continues to advocate and program funds for local and regional rail improvement projects, such as Phase 2 of the Third Street Light Rail Project (Central Subway), Caltrain electrification and signal improvements, BART station improvements, and the downtown extension of Caltrain and High Speed Rail to the rebuilt Transbay Terminal. Construction on Central Subway began in 2011 and the Transbay Terminal opened in 2019. The Transportation Authority completed the feasibility study for a major upgrade to the M Ocean View line that would underground portions of the line and extend it to Park Merced. The Transportation Authority and SFMTA recently completed a Subway Vision that creates a framework for subway expansion throughout the city and identifies likely corridors. The corridors from the Subway Vision are currently being evaluated as part of the ConnectSF Transit Corridor Study. The Transportation Authority partnered with the Metropolitan Transportation Commission and numerous other agencies to complete a Core Capacity Transit Study that recommended a suite of projects to address transit crowding and unreliability in corridors into downtown San Francisco. The Transportation Authority will be partnering with BART and Capitol Corridor to further evaluate new proposed BART and conventional rail alignments across the Bay. |
|
B-1. Freeway & Arterial Operations Strategies |
Implementation of this TCM is being coordinated by Caltrans and the Metropolitan Transportation Commission (MTC). SFMTA’s SFgo program is developing an integrated traffic management system managed from a centralized transportation control center. In addition, the Program is working with Caltrans to coordinate freeway improvements with the City’s traffic management systems. As part of this project, SFMTA is working to replace aging signal controllers and install signals with transit priority capabilities on key transit routes. |
|
B-2. Transit Efficiency & Use |
Major transit operators in San Francisco, including Muni, BART, AC Transit, Golden Gate Transit, Caltrain, and SamTrans, all accept the Clipper card for fare payment. In addition, BART is upgrading signage at its downtown stations to ease wayfinding. Muni is upgrading signage, lighting, and other architectural aspects of its downtown stations. San Francisco has also worked to have discounted or free transit passes be part of TDM and mitigation programs required of new developers such as Candlestick Point/Hunters Point Shipyard, Treasure Island, California Pacific Medical Center, and Park Merced. San Francisco State University has implemented a discount transit pass for trips on BART and Muni. |
|
B-3. Bay Area Express Lane Network |
Implementation of this TCM is being led by MTC. An HOV pricing structure exists on the approaches to San Francisco via the San Francisco Oakland Bay Bridge and the Golden Gate Bridge during peak commute hours, with separate HOV lanes on the Bay Bridge. Express buses will continue to operate in San Francisco and will be prioritized through the new Transbay Terminal. The Transportation Authority completed the Freeway Corridor Management Study and is initiating a Caltrans Project Initiation Document (PID) and environmental clearance process for potential express lanes alternatives that may include high occupancy vehicle or high occupancy toll lanes on portions of U.S. 101 and I-280. These lanes would connect to high occupancy toll lanes being implemented on U.S. 101 in San Mateo County. |
|
B-4. Goods movement Improvements & Emission Reduction Strategies |
Implementation of this TCM is being led by MTC and BAAQMD. San Francisco will work with BAAQMD to implement grant programs that fund diesel emission reduction programs. As part of ConnectSF, the Transportation Authority is evaluating changes in the delivery of goods in San Francisco and opportunities to increase the efficiency and sustainability of freight movement in the City. |
|
C-1. Voluntary Employer-Based Trip Reduction Program. |
The San Francisco Department of the Environment (SFE) currently conducts many of the City’s employer based Transportation Demand Management (TDM) activities, funded in part through Prop K. These activities currently include the commuter benefits program; Emergency Ride Home (ERH) program; bicycle fleet (e.g. CityCycle) program; and regional ride sharing program. The San Francisco Planning Department also conducts compliance monitoring of office buildings required to have a TDM program. In 2017, city agencies developed a joint San Francisco TDM Plan: 2017 – 2020. This workplan, based on the 2014 strategy, identifies the employer-oriented policies, projects, and programs the city can implement to accomplish its TDM goals. |
|
C-2. Safe Routes to School & Safe Routes to Transit Programs |
The SFMTA manages San Francisco’s Safe Routes to Schools program, which conducts education, encouragement, and related programs at elementary, middle and high schools in San Francisco. These programs are designed to encourage schoolchildren to walk and bicycle to school rather than driving in the family car. |
|
C-3. Ridesharing Services & Incentives |
SFE is the MTC-delegated agency that oversees the Regional Rideshare Program in the City, including introducing employers to TDM programs, promoting ride share, and encouraging and assisting employers to implement ride share. SFMTA promotes the use of carpools and vanpools during the morning and evening commutes. The City provides a casual carpool pick-up location for evening commutes on Spear Street between Howard and Folsom Streets. SFMTA also administers a program through which major employers may provide parking for employee carpool vehicles (3 or more riders) in City-owned garages at a reduced rate. The City also provides a limited amount of designated on-street parking in the downtown area for registered vanpool vehicles. Finally, buildings subject to Section 163 Planning Code Requirements are required to encourage alternatives to driving alone, including through ride sharing and carpooling. |
|
C-4. Conduct Public Outreach & Education |
Implementation of this TCM (e.g., Spare the Air Days) is occurring through the Air District, MTC, and transit operators throughout the region, as well as through local agency activities, including the ongoing SF Moves pilot project to provide outreach and education to neighborhoods in San Francisco, and the completed TDM Partnership Project which involved employer outreach and education. Additionally, buildings subject to the Section 163 Planning Code requirement must engage in outreach and education activities, such as those provided by the downtown TMA. |
|
C-5. Smart Driving |
Implementation of this TCM is being led by MTC. San Francisco does have a traffic calming program, funded through Prop K and implemented by SFMTA, which includes speed reduction on arterials streets. However, speeding on freeways in San Francisco is generally not a major concern due to relatively dense traffic conditions within the city limits. |
|
D-1. Bicycle Access and Facilities Improvements |
Since the Bicycle Plan injunction was lifted in 2010, the City and County have moved rapidly to implementation. The SFMTA has installed more than 50 miles of bicycle lanes since 2008, using Prop K as well as regional funding for many projects. Progress on the Plan has also included separated and buffered bike lanes, bike boxes at intersections, colored pavement treatments to increase the visibility and safety of bicycling on City streets, sharrows, and bike racks and bicycle corrals. Several major bicycling improvement projects have been recently completed or will be under construction soon, including implementation of new protected bicycle lanes on Masonic Street, 2nd Street, 7th/8th Street, Division/13th Street, 17th Street, Folsom/Howard Street, San Jose Avenue, upper Market Street, and others. |
|
D-2. Pedestrian Access and Facilities Improvements |
The General Plan and Planning Code have supported pedestrian friendly, transit-oriented development for decades, which is referred to as the City’s Transit First Policy. The Transportation Authority funds pedestrian-related projects through Prop K and programs other fund sources to support pedestrian improvements. Many of these projects fall under SFMTA’s programs related to traffic calming, pedestrian and bicycle safety, and school area safety, and are also implemented through new development compliance with the Better Streets Plan which sets standards for street improvements associated with new development. Multi-agency efforts to coordinate major construction opportunities with pedestrian projects have also improved through the Follow-the-Paving process. In 2014, following a directive from the Transportation Authority Board, city agencies launched the Vision Zero program aimed to eliminate traffic injuries and fatalities by 2024. Because pedestrians typically make up more than half of fatalities in the city, work has involved focusing on improving conditions for pedestrians, especially on corridors identified as high injury pedestrian corridors. |
|
D-3. Local Land Use Strategies |
The Transportation Authority promotes legislative activities that encourage smart growth and more sustainable transportation and development-related investment decisions by the City and developers. ABAG and MTC have been working for years to encourage the region’s municipalities to plan for compact, transit-oriented development to meet the region’s sustainability goals. The most recent regional transportation plan (Plan Bay Area), called for focused growth around Priority Development Areas (PDAs), which largely center around existing or planned transit hubs. The Transportation Authority continues to work closely with City agencies to plan multimodal transportation improvements to support focused growth in San Francisco’s 12 PDAs. |
|
E-1. Value Pricing Strategies |
The Transportation Authority has been designated as the Treasure Island Mobility Management Agency (TIMMA). TIMMA is working to implement congestion pricing on Treasure Island, as required in the development agreement prepared for the island. Additionally, the Transportation Authority continues to study the potential for congestion pricing or alternative approaches to manage congestion in downtown San Francisco. In 2018, the Transportation Authority began a fresh look at the idea of congestion pricing with updated data and analysis and a full community engagement process. |
|
E-2. Parking Policies to Reduce VMT |
In September 2009, the Transportation Authority adopted the San Francisco On-Street Parking Management and Pricing Study. SFMTA piloted the study’s key recommendations through the SFpark program and adopted demand responsive parking pricing for all City-owned garages and street parking in late 2017. The City has also addressed private off-street parking by eliminating minimum parking requirements downtown and in specific neighborhoods and commercial corridors, in some cases replacing them with maximum parking requirements. Unbundled parking, bicycle parking, and car share parking requirements have also been implemented. In 2016, the Transportation Authority completed a Parking Supply and Utilization Study that considered further parking policy reform to manage auto trip demand. Rather than pursue any of the strategies analyzed, the study recommended that agencies advance existing parking-related initiatives, including the Residential Parking Permit Evaluation and Reform Project and implementation of the city’s proposed TDM Ordinance. |
|
E-3. Transportation Pricing Reform |
The Transportation Authority continues to work with MTC and the Bay Area Partnership to identify new revenue sources. The Authority developed major transportation pricing studies, including the Mobility, Access, and Pricing Study and the Parking Supply and Utilization Study, to examine the potential for pricing to be used in combination with new technology and transportation enhancements to improve system performance and reduce emissions. |
KEY TOPICS
The General Plan and the City Charter are the primary policies that guide the City’s review of land development impacts on the transportation network. San Francisco is a Charter City, and it has a consolidated city and county government. An eleven-member Board of Supervisors serves as the legislative body for the City’s unified city and county government. The City Planning Commission (CPC) has responsibility for land use decision-making throughout the City. The Mayor appoints the seven members of the CPC. Among the responsibilities of the CPC are the following:
In addition, both the CPC and the Board of Supervisors must approve all rezoning.
The Planning Department’s land use responsibilities include transportation matters. The Planning Department has primary responsibility for assessment of the transportation impacts of development proposals, and to determine consistency with land use and transportation policies in the General Plan. The existing local regulations include measures to mitigate project-specific transportation impacts within the policy and priority framework of the General Plan, the long-range transportation plan, and the Capital Improvement Program (CIP) of the CMP.
The City already has in place an extensive process for evaluating the transportation impacts of land development proposals. This process, which ensures the City’s compliance with State and Federal environmental review requirements, is the responsibility of the Planning Department. With the passage of California Senate Bill 743 (see Section A10.4), the City aligned its CEQA review and development approval process with RTP goals such as a vehicle miles traveled (VMT) reduction target. Nevertheless, as CMA, the Transportation Authority has a role in ensuring that the impacts of land use decisions on the transportation system are analyzed with a uniform methodology, consistent with the long-term strategic goals of the General Plan and the San Francisco Transportation Plan.
In June 2025, Mayor Lurie introduced the San Francisco Family Zoning Plan. The Family Zoning Plan is a set of changes to San Francisco’s zoning rules that will allow new homes to be built in more neighborhoods across the City. These changes are required by state law and focus on property in the western and northern parts of San Francisco, specifically in and near the areas designated by the state as Housing Opportunity Areas, or neighborhoods with greater access to parks, quality schools, better environmental conditions, and with higher median incomes. The plan aims to expand housing affordability and availability by allowing for increased density throughout the City, especially along transit and commercial corridors, in order to meet San Francisco’s Regional Housing Needs Allocation requirements set by the State of California.
San Francisco has been able to maintain one of the highest levels of transit use among U.S. cities because of its relatively high-density development and because topography and geography limit vehicular access routes to and from the City.
There have been significant numbers of non-resident commuters into the city for over a century. To improve the balance of housing and jobs, during the 1980s San Francisco actively promoted new residential development. Extensive revisions to the City’s General Plan and rezonings were undertaken. Each of these land use plans — the Downtown Plan, Rincon Hill, North of Market, Chinatown, Neighborhood Commercial, Van Ness Avenue, South of Market, and Mission Bay — incorporated measures to retain and enhance opportunities for residential development.
In recent years, several more area plans have been developed or adopted including: the Market/Octavia Plan, Eastern Neighborhoods Plan, Balboa and Glen Park BART Station Area Plans, the Treasure Island Plan, the Transbay Center District Plan, and the Central SoMa Plan. In addition, housing development has been promoted by the policies of the San Francisco Redevelopment Agency and its successor agency, the Office of Community Investment and Infrastructure, in various areas, including the Rincon Point/South Beach, Yerba Buena Gardens, Transbay, the Bayview Hunters Point Redevelopment Plan Areas, India Basin, Candlestick Point-Hunters Point Shipyard Phase 2, Parkmerced, Stonestown, UCSF Parnassus, and Visitacion Valley.
San Francisco’s continued role as a regional employment center and its policy of housing development have had an impact on the demand for transportation in the city. A primary mission of the Transportation Authority is to strategize investment in the city’s transportation infrastructure and promote the development of demand management tools to address growing travel demand. Infrastructure investment is intended both to address future growth in transportation demand and to improve the city’s current transportation system. Demand management is needed to promote a balanced and cost-effective transportation system.
In past decades, San Francisco’s primary transportation challenge was to absorb new jobs downtown without proportionately increasing the number of workers commuting by car. That challenge was addressed with the construction of BART and Muni services focused on downtown commuting, combined with limits on parking provision.
Today San Francisco’s transportation challenges are more varied. They are numerous and located across the city, throughout the various neighborhoods as well in core areas, which can expect not only employment growth but also extensive residential growth. Challenges include competitive transit service for non-commute and reverse commute trips; neighborhood parking management; safety for people walking and biking; improved transit reliability and speed through the development of a transit priority network; and reducing emissions of pollution and greenhouse gases. Recent innovations in transportation are rapidly changing how people navigate our city streets. These emerging mobility services and technologies include ride-hailing services (such as Uber & Lyft), microtransit (Via), app-based ride sharing, bike/e-bike/scooter/car sharing, courier network services, autonomous vehicle technologies, and more. Additionally, post-pandemic continued remote work for some types of occupations presents further challenges.
Regional efforts to coordinate land use and transportation include Priority Development Areas (PDAs), Transit Oriented Communities (TOCs), and development of a regional High Occupancy/Toll (HOT) lane system. In addition, state laws promulgated in 2006 and 2007 require greater integration of land use and transportation planning processes in recognition of the climate change challenge.
Underlying these needs is the challenge of finding new mechanisms to pay for needed transit and other improvements as development decisions are made. A discussion of the city’s initiative to update transportation impact and mitigation fees is provided in Section A10.4.
NOTE: California Government Code Section 65089(b)(4) requires the land use program to assess the impacts of land development on regional transportation systems. In the 1991 San Francisco CMP this was interpreted to mean impacts on the CMP roadway network. However, the federal Intermodal Surface Transportation Efficiency Act (ISTEA), passed in 1991, explicitly requires the development of a metropolitan transportation system (MTS), including both transit and highways. As discussed in Chapter 3, MTC contracted with the Transportation Authority, acting as CMA, to help develop the MTS and to use the CMP process to link land development decisions to impacts on the MTS. For purposes of the land use analysis program, the San Francisco CMP will use the San Francisco component of the MTS, but conformance with roadway level of service (LOS) standards will continue to be assessed using the CMP roadway network, which is a subset of the multimodal MTS.
One key aspect of the CMP approach to land use impacts analysis is that, pursuant to state law, the Transportation Authority will also be responsible for reviewing transportation analysis of specific development projects under CEQA and determining the consistency of these “sub-area” analyses with the citywide model. Examples of this role include our work to support the Bayview/Hunters Point Redevelopment Area Environmental Impact Report (EIR), the Transbay Center District Plan EIR, and the Market/Octavia Better Neighborhoods Plan EIR, and the Central SoMa Plan and EIR.
Pursuant to MTC’s agreements with county CMAs over coordination of transportation and land use, the Transportation Authority focuses on the following activities to help integrate transportation and land use decisions:
ABAG and MTC have been working for years to encourage the region’s municipalities to plan for compact, transit-oriented development to meet the region’s sustainability goals. This work was previously conducted through the FOCUS program that invited municipalities to nominate locations to be considered as Priority Development Areas (PDAs) or Priority Conservation Areas (PCAs) based on regionally established criteria. In 2013, the region adopted Plan Bay Area, the first SCS for the San Francisco Bay Area prepared pursuant to Senate Bill 375 (Steinberg). PDAs and PCAs are key “building blocks” of the region’s land use strategy presented in Plan Bay Area. ABAG and MTC approved an update to Plan Bay Area 2050 in October 2021.
Prior to 2019, San Francisco had identified twelve PDAs, generally in the eastern part of San Francisco, and generally in locations that have been comprehensively planned as part of an Area Plan process. San Francisco’s PDAs were first identified and approved by the San Francisco Board of Supervisors in 2007 and have been updated since then to reflect slight changes to boundaries. In August 2015, ABAG approved three additional regional PCAs that cross San Francisco: California Coast Trail (along the Pacific coast), San Francisco Bay Water Trail (including access points in San Francisco’s Marina District), and San Francisco Bay Trail (along the Embarcadero, through the Marina and over the Golden Gate Bridge). Five Priority Conservation Areas (PCAs) were adopted by San Francisco at this early stage : Palou Phelps Natural Area, Bayview Hill Natural Area, Green Connections-McLaren Park Pivot, Crosstown Trail-Connecting Twin Peaks Bio-Region/Glen Canyon, and the San Francisco Bay Area Water Trail.
In May 2019, the MTC Commission and Executive Board adopted an update to the Regional Growth Framework, including updated criteria for PDAs and PCAs, and a new Priority Production Area (PPA) pilot program, which promotes middle-wage jobs and support the region’s industrial economy. San Francisco worked with MTC to expand the coverage of existing PDAs and identify four new PDAs, eight new PCAs, and one PPA designation as part of the ongoing update to Plan Bay Area. These additional PDAs ensure their eligibility for regional OBAG and other funding, and that more of the region’s areas well-served by transit and with high access to opportunity are included in the PDA framework and considered for investment as they grow. In total, fifteen Priority Development Areas (PDAs) have been adopted by the City (a map of the PDAs can be found in Chapter 6).
In September 2022, MTC adopted the TOC designation as part of its Transit Oriented Communities Policy, which is intended to inform the prioritization of future transportation investments to support housing and business development near public transit. The TOC Policy establishes planning, zoning, and policy requirements in areas within a half-mile of rail, ferry, or grade-separated bus stations. It includes: minimum residential and commercial office densities for new development; policies to promote affordable housing, business stabilization, and minimize displacement; parking management; and improvements to transit access in the TOC area. Given its robust, high-quality public transit network, MTC has identified that San Francisco has 163 of the region’s 265 TOCs (a map of San Francisco’s TOCs can be found in Chapter 6). The deadline for jurisdictions to comply with the TOC Policy is in 2026.
As a part of Plan Bay Area, the region committed to identify funding incentives for PDAs and PCAs, most significantly through the One Bay Area Grant (OBAG) Program. This commitment was affirmed through the subsequent Plan Bay Area 2050, and the forthcoming Plan Bay Area 2050+, which MTC expects to approve in early 2026. OBAG provides a four or five year framework for the federal Surface Transportation Program and the Congestion Mitigation and Air Quality Improvement Program funds programmed by MTC. OBAG Cycle 1 covered Fiscal Years 2012/13 through 2016/17; OBAG Cycle 2 covered Fiscal Years 2017/18 through 2021/22, OBAG Cycle 3 covers Fiscal Years 2022/23 through 2025/26, and OBAG 4 will cover Fiscal Years 2025/27 through 2029/30. OBAG Cycle 2 built upon OBAG Cycle 1 with an added focus on affordable housing and anti-displacement policies in light of the region’s current housing crisis. OBAG Cycle 3 built further upon OBAG Cycle 2, requiring compliance with state housing laws related to accessory dwelling units, density bonuses, and the Housing Accountability Act. Approximately 50% of OBAG Cycle 3 funds are passed to county Congestion Management Agencies (CMAs), including the Transportation Authority for San Francisco, to nominate projects that help advance the transportation and land use vision expressed in Plan Bay Area 2050. For the OBAG Cycle 3 county grant program:
The OBAG 4 investment framework is currently under development but we anticipate it will be structured similarly to OBAG 3 and include new and modified initiatives to reflect the Plan Bay Area 2050+ Implementation Plan. Refer to the Transportation Authority’s OBAG page (see the Bibliography) for the list of funded projects.
In addition to projects identified to receive PDA Planning Funds, San Francisco is leading or plans to lead several studies in which transportation is closely tied to land use development. All planned development areas are located within PDAs and involve a multiagency approach in which the Transportation Authority has a supporting role.
For example, the SFCTA-led Geary-Fillmore Underpass Community Planning Study will develop transportation and land use concept designs that rethink the urban renewal-era Geary Expressway and advance a high quality, mixed-use, transit-oriented area to connect the Japantown and Fillmore/Western Addition neighborhoods. SFMTA and SF Planning are partners in the effort which has also formed a Community Council to guide each step of the study.
Following from the long-range recommendations of the Core Capacity Transit study (CCTS), BART is conducting a multi-jurisdictional planning process to identify one or more new potential transbay rail crossings. This study is being conducted jointly with Capitol Corridor and will evaluate both BART and standard gauge rail crossings of the San Francisco Bay. The Transportation Authority, along with other city agencies, will be coordinating closely with BART, Capitol Corridor, and other agencies, stakeholders, and the public on this study as it unfolds. This study will identify a preferred alternative for a transbay rail crossing.
The San Francisco Department of Planning, SFMTA, and the Transportation Authority are jointly leading the development of a long-range plan for San Francisco known as ConnectSF. This process includes the development of an updated San Francisco Transportation Plan (SFTP 2050) by the Transportation Authority and an updated General Plan Transportation Element by the Planning Department. The process began by developing a comprehensive vision for the future of transportation that considers how a combination of transportation and land use policy and investments can provide an effective, sustainable, and equitable future for San Francisco. The effort produced a 50-year roadmap to arrive at that future, including policies, planning, project development, and funding strategies. The key outputs for the program include a vision document 2018, the Transit Strategy, the Streets and Freeways Strategy, and the SFTP 2050. The effort did not include an update to the Transportation Element of the San Francisco General Plan.
The ConnectSF team engaged a diverse set of stakeholders to understand priorities and shape study recommendations.
A list of plans developed with the support of the Community Based Transportation Planning program and the Neighborhood Transportation Improvement Program is provided below.
The Community Based Transportation Planning program supported development of the following plans:
The Neighborhood Transportation Program has recently supported the following planning projects (* indicates projects that are underway):
The California Environmental Quality Act (CEQA) requires California’s public agencies to determine the potential for proposed projects to have significant impacts on the environment, including transportation impacts. CEQA also encourages agencies to develop thresholds of significance — the quantitative point at which an environmental effect may be considered significant — to facilitate these determinations. Beginning on September 15, 2020, new projects were required to include a VMT-based transportation impact significance determination, the culmination of a multi-year effort led by the California Office of Planning and Research (OPR) to implement Senate Bill 743 (SB 743). CEQA gives local jurisdictions discretion to adopt impact measures and significance thresholds, and while many agencies in California measure a project’s effects on transportation using the Highway Capacity Manual’s intersection Level of Service (LOS) measure, which measures delay to automobiles, LOS may no longer be used as a sole measure of transportation impact. These changes better align environmental review with environmental policies, like reducing greenhouse gas emissions.
Prior to statewide implementation of SB 743, the Transportation Authority had a long history of supporting CEQA reform. In October 2008, the Transportation Authority adopted the Final Report on the Automobile Trip Generation Impact Measure as an alternative to automobile LOS. The Report recommends that the City measure the transportation impacts of projects under CEQA based on the net new automobile trips generated (ATG) by a project. In 2009 the Transportation Authority worked with the State Office of Policy and Research to revise the CEQA Guidelines section on transportation impact analysis, which removed the exclusive reference to automobile LOS and replaced it with an option for local jurisdictions to select an alternative measure of transportation impact. The revisions also deleted references to parking as a transportation impact area.
On September 27, 2013, the governor signed into law SB 743, which revised the criteria for determining the significance of transportation impacts within transit priority areas. In the fall of 2014, the State of California Office of Planning and Research released draft guidelines for implementation of SB 743, indicating that vehicle miles traveled (VMT) would be the primary metric for evaluating transportation impacts. In March 2016, San Francisco became the first county to adopt the proposed SB 743, preceding statewide adoption by more than 2 years. The San Francisco Planning Commission adopted a resolution, based on state-proposed guidelines that remove automobile delay as a significant impact on the environment and replaced it with a vehicle miles traveled threshold for all CEQA environmental determinations, including active projects, going forward. In 2018, California adopted CEQA guidelines for implementing SB 743, and on September 15, 2020, all new projects were required to include a VMT-based transportation impact significance determination.
KEY TOPICS
The CMP statute requires that each CMP be consistent with the long-range Regional Transportation Plan (RTP), developed by the regional transportation planning agency (the Metropolitan Transportation Commission, or MTC, for the Bay Area), and each county’s component of the RTP must be supported by a long-range countywide transportation plan (San Francisco Transportation Plan, or SFTP), developed by the CMA. The Capital Improvement Program (CIP) is intended to serve as a short or medium-range implementation vehicle for investment priorities as prioritized in the long-range plans.
Through the RTP, the MTC establishes the Bay Area’s vision for transportation with supporting policies and investment strategies, including a list of specific projects and programs. Inclusion of projects and programs in the RTP is a prerequisite for receiving state and federal transportation grants for certain state or federal approvals and a requirement for capacity expanding projects that may have air quality impacts. 2013’s Plan Bay Area was the region’s first RTP/Sustainable Communities Strategy (SCS) that explicitly integrated transportation projects and policies with land-use strategies to meet the SB 375 requirements to accommodate future population growth and reduce greenhouse gas emissions. MTC and the Association of Bay Area of Governments adopted an update to Plan Bay Area, named Plan Bay Area 2050 in fall 2021, which was amended in November 2024. An update, Plan Bay Area 2050+, is scheduled to be adopted in early 2026 that will incorporate lessons learned from the pandemic.
The Transportation Authority develops the SFTP (countywide transportation plan) for San Francisco, consistent with MTC guidelines, to guide transportation investment and to serve as a basis for RTP/SCS assumptions. The Transportation Authority updated the SFTP in December 2013, which identified four goals (economic competitiveness, safe and livable neighborhoods, environmental health, and well maintained infrastructure) and proposed scenarios that invest strategically in a diverse set of projects to make progress toward each of the goals. A focused update approved in October 2017 reaffirmed these goals, updated project costs, and reassessed projects previously identified for funding. A major update of the SFTP, named SFTP 2050, was adopted by the Transportation Authority in December 2022. The Transportation Authority ensures the CIP projects, as well as their selection processes, are consistent with the SFTP. The SFTP is discussed in further detail in Chapter 6.
As a result of the Transportation Authority’s role as the Prop L and Prop AA administrator and the CMA, the capital priorities programming process not only involves state and federal funds that are required by state law to be programmed through the CMP but also incorporates the Prop L and Prop AA programming strategy. Listed below are major CIP funding sources administered by the Transportation Authority. Importantly, as described in Chapter 7, the Transportation Authority ensures that all CIP projects, as well as the programming and project selection processes, are consistent with the RTP, SFTP, and other requirements attached to the funding.
Evaluation of potential impacts of CIP projects on multimodal system performance is embedded throughout the project selection and monitoring processes. The results of the CMP multimodal system performance analysis and any deficiency findings will also be incorporated into the future CIP development as appropriate. Please refer to Chapter 4 for a detailed discussion of multimodal system performance.
Conformance with the CMP is required for a local jurisdiction to receive federal Surface Transportation Program (STP) funds or Congestion Mitigation and Air Quality Improvement Program (CMAQ) funds. STP funds are among the most flexible and are used to support a wide range of transportation improvement projects across all modes. CMAQ funds are intended for projects that reduce transportation related emissions. Both funds are distributed mainly by the regional transportation planning agency, i.e. the MTC for the Bay Area. The MTC has divided the Bay Area’s share of STP and CMAQ funds into multiple programs under the umbrella of the One Bay Area Grant (OBAG) program. Each of the OBAG programs typically has its own associated policies and guidelines in pursuant of RTP goals. The MTC approved a third cycle of OBAG programming (OBAG 3) for Fiscal Years 22/23 through 25/26. One of the centerpieces of OBAG 3 is the county share program, which is intended to better integrate the region’s transportation program with land use and housing policies and to promote transportation investments that support Priority Development Areas (PDAs). PDAs refer to locally-identified, regionally designated infill development opportunity areas within existing communities. A map of PDAs is included in Chapter 6 of the main report. The Transportation Authority recommended and MTC approved $50,577,000 in county share OBAG 3 funds for projects. The Transportation Authority has also provided monitoring and support for sponsor agencies as San Francisco’s OBAG projects advance through the design and construction phases under the federal aid guidelines. OBAG 4 policies and framework, which will include funding in Fiscal Years 26/27 through 29/30, is nearing the final stages of development, as of November 2025, and will implement Transit Oriented Communities (TOC) policies, accommodate Senate Bill (SB) 125 which addresses the region’s transit fiscal cliff, and apply any updates from Plan Bay Area 2050+ (anticipated for adoption in 2025). The OBAG 4 framework will be adopted in early 2026, followed by the release of the county call for projects..
The Bibliography includes a link to the OBAG funded projects list.
Inclusion in the CIP is a prerequisite for inclusion in the State Transportation Improvement Program (STIP), a five-year program of projects adopted by the California Transportation Commission (CTC) every two years. Priorities for approximately 75% of the STIP programming capacity are set by regional transportation planning agencies, and the remaining 25% is established by the state. The Regional Transportation Improvement Program (RTIP) is the MTC’s submission to the state, which is merged with other regions’ RTIPs and additional CTC priorities to become the STIP. In the Bay Area, the practice has been for the CMAs to establish priorities for their county share, subject to the MTC’s concurrence and the CTC approval of the region’s RTIP. In the 2026 RTIP, the Transportation Authority Board continues to fulfill its long-standing commitments to RTIP priorities. RTIP funds cannot be programmed directly to the Central Subway or Presidio Parkway projects because all the contracts have been awarded, so we are honoring the commitment by programming RTIP funds to the other eligible projects of SFMTA’s and MTC’s choice.
The STIP used to be a significant, although highly variable source of state funds for highways, local streets and roads, transit rehabilitation and expansion projects, and pedestrian and bicycle projects. With reduced revenues from fuel taxes and lack of an adequately funded multi-year federal transportation bill, the STIP experienced a drastic reduction in available funding. However, the passage of Senate Bill 1 in 2017 has helped to stabilize the program. The Transportation Authority Board approved the 2026 RTIP and its list of priorities through the CTC’s STIP adoption in March 2026.
Since 1990, San Francisco has had a half-cent local sales tax for transportation improvements. San Francisco voters approved the first such sales tax and expenditure plan in November 1989 as Proposition B and the second in November 2003 as Proposition K. In November 2022, voters approved Proposition L and adopted a new 30-year Expenditure Plan, superseding the prior one. At the time of the Expenditure Plan adoption, Prop L was expected to generate $2.6 billion (in 2020 $’s) over 30 years and to leverage close to $23.7 billion in federal, state, and other local funds for transportation projects in San Francisco.
The Expenditure Plan established five overall categories of investment and attached mandatory percentage shares of total Prop L revenues: Transit Maintenance and Enhancements (41.2%), Major Transit Projects (22.6%), Streets and Freeways (18.9%), Paratransit (11.4%), and Transportation System Development and Management (5.9%). The Expenditure Plan details eligible sponsors and project types for 28 programs, ranging from the The Portal/Caltrain Downtown Rail Extension, to street resurfacing, to pedestrian and bicycle improvements to transit vehicle replacements to transportation demand management.
The Bibliography provides a link to a summary of the Expenditure Plan, which lists the eligible projects and programs along with their shares of Prop L funds and expected leveraging goals.
As required by the Expenditure Plan, the Transportation Authority Board adopts a Prop L Strategic Plan to guide the day-to-day implementation of the Prop L program, and for each of the programmatic categories, a five-Year Prioritization Program (5YPP). The Prop L Strategic Plan is the financial tool that guides the timing and allocation of Prop L revenues over the 30-year Expenditure Plan period, and it considers many factors, such as the presence of matching funds and the likelihood of projects to move forward in the year proposed. The 5YPP includes prioritization criteria, a five-year list of projects (with scope, schedule, cost, and funding information), and performance measures. The Strategic Plan and 5YPPs are updated quinquennially and may, between quinquennial updates, be amended as needed. Between July 2023 and July 2024, the Board approved the 5YPPs identifying the projects to be funded in Fiscal Years (FYs) 2023/24 – FY2027/28. The Transportation Authority Board adopted the Prop L Strategic Plan in March 2025.
Prop AA is a $10 countywide annual vehicle registration fee that was passed by San Francisco voters in 2010. Total revenues are estimated over the 30-year period at approximately $150 million, or approximately $5 million annually, to fund smaller, high-impact projects throughout the city on a pay-as-you-go basis. The Prop AA Expenditure Plan established three categories of investment and prescribed percentage shares over 30 years: Street Repair & Reconstruction (50%), Pedestrian Safety (25%), and Transit Reliability & Mobility Improvements (25%). The Expenditure Plan requires that the Transportation Authority adopt a Strategic Plan to guide the timing of expenditures and set policies for day-to-day management of the program and to update it every five years. In 2012, the Transportation Authority Board approved the first Prop AA Strategic Plan with $25.1 million to projects over the five year period of Fiscal Year 2012/13 through Fiscal Year 2016/17. In 2017, the Board approved the first update to the Strategic Plan, with $22.8 million programmed to projects over the five year period of Fiscal Year 2017/18 to Fiscal Year 2021/22. The Strategic Plan was updated again in 2022 with $23.5 million programmed to 15 projects over Fiscal Years 2022/23 through 2026/27. The Bibliography provides a link to the 2022 Prop AA Strategic Plan Programming and Allocations.
The Transportation Fund for Clean Air Program (TFCA) was established to fund cost-effective transportation projects that achieve a reduction in motor vehicle emissions. Funds are generated from a $4 surcharge on the vehicle registration fee. Forty percent of the funds are passed through and administered by the designated public agency for each of the nine counties in the Bay Area Air District (BAAD). The Transportation Authority is the designated TFCA administering agency for San Francisco. In that capacity, it programs approximately $700,000 every year to clean air vehicles, shuttle operations, bicycle and pedestrian improvements, and other eligible transportation projects that help clean up the air by reducing motor vehicle emissions. The Transportation Authority also provides assistance to project sponsors in applying for Regional TFCA funds that are programmed directly by the BAAD. The remaining sixty percent of the revenues, referred to as the Regional Fund, is distributed to applicants from the nine Bay Area counties through a variety of grant programs.
The Bibliography provides a link to the 2025-26 TFCA funded projects summary.
In February 2018, the MTC established a transit-focused STA County Block Grant program, with funds from the regional paratransit program, the northern counties/small transit operators program, and the regional Lifeline Transportation Program, to be administered by CMAs. The STA County Block Grant program allows each county to determine how to invest in paratransit, transit operating and capital needs, including providing lifeline transit services. Funds were distributed among the nine Bay Area counties based on the amount that each county would have received in Fiscal Year 2018/19 under the former regional programs. For the first two years of the new block grant program, Fiscal Years 2018/19 and 2019/20, San Francisco received approximately $8.3 million.
In December 2018, the Transportation Authority Board approved the San Francisco STA County Block Grant Framework to distribute 40% of the funds to the SFMTA’s paratransit program consistent with what SFMTA would have received under the prior regional paratransit program. The Board approved the remaining 60% for the new SF LTP modeled on the former regional LTP. In April 2019, the Transportation Authority Board approved the SF LTP Cycle 1 program of projects to address gaps or barriers identified through equity assessments and collaborative and inclusive community-based planning processes.
In light of the significant decline in transit fare and other operating revenues due to the COVID-19 pandemic, in April 2020, the Board approved San Francisco’s share of Fiscal Year 2020/21 County Block Grant funds to support the San Francisco Municipal Transportation Agency’s paratransit operations. In addition, STA County Block Grant funds support the Bay Area Rapid Transit District’s Elevator Attendant Program at the downtown stations. The Bibliography provides a link to the STA County Block Grant funded projects summary. This funding distribution between paratransit operations and BART’s Elevator Attendant Program has continued in Fiscal Year 2021/22 through Fiscal Year 2025/26.
The Local Partnership Program (LPP), created by the Road Repair and Accountability Act of 2017 or Senate Bill 1, is a program created to reward local or regional transportation agencies that have sought and received voter approval of taxes or fees solely dedicated to transportation. Of the $200 million appropriated annually, the California Transportation Commission (CTC) allocates 50% of the program through a Formulaic Program based on both the share of revenues and population of counties with voter-approved sales taxes, tolls, or fees. As administrator of San Francisco’s Prop L transportation sales tax, Prop AA annual vehicle registration fee, and a portion of the Prop D TNC Tax, the Transportation Authority is responsible for programming a majority of San Francisco’s share of the LPP Formulaic Program. The Bibliography provides a link to the 2018 through 2022 LPP Formulaic Program of Projects, adopted by the CTC in August 2023. For the 2022 Program funding cycle covering Fiscal Years 2023/24 – 2024/25, San Francisco received $8.875 million based on Prop K, Prop AA, and the TNC tax revenues as well as a one-time $5 million bump from LPP incentive funds to reward San Francisco for passing Prop L in November 2022. In September 2025, the Board approved $1.374 million in LPP formulaic funds for the Yerba Buena Island (YBI) Multi-Use Pathway Segment 4, the last of the 2022 Program funding cycle funds. In June 2025, the California Transportation Commission recommended allocating $14 million in Competitive Program funds for the Howard Streetscape Project, a Complete Streets with road diet project, as a part of the 2024 Local Partnership Competitive Program’s Program of Projects. For the 2024 Program funding cycle covering Fiscal Years 2025/26 – 2026/27, San Francisco will receive $3.894 million based on Prop L, Prop AA, and TNC Tax revenues.
On November 5, 2019, San Francisco voters approved Prop D, enabling the City to impose a 1.5% business tax on shared rides and 3.25% business tax on private rides for fares charged by commercial ride share and driverless-vehicle companies until November 5, 2045. Through 2024, single occupant trips were taxed at 3.25%, with electric vehicle trips receiving a discount of 1.5%. Since January 2025, a 1.5% tax is maintained on shared rides and 3.25% is charged on all other rides. The Traffic Congestion Mitigation Tax, referred to as the TNC Tax, was expected to generate about $30 million annually, before the COVID-19 pandemic. Half of the revenue goes to the SFMTA for transit improvements. The Transportation Authority administers the other half of the funds for street safety improvements. Revenue collection began on January 1, 2020.
On October 27, 2020, the Transportation Authority Board adopted the TNC Tax Program Guidelines and in March 2023, the Transportation Authority Board adopted the first update to the Program Guidelines. Since the program’s inception the Transportation Authority has programmed and allocated over $34.7 million in TNC Tax funds primarily to the SFMTA’s Vision Zero Quick-Build Program and a smaller amount to the SFMTA’s Application-Based Residential Traffic Calming Program.
The Bibliography provides a link to the TNC Tax funded projects summary.
The project sponsor is expected to deliver a project or program as approved by the Board. If a project sponsor anticipates that the scope, schedule, budget or funding plan will change, Transportation Authority staff will assess the need for a CIP amendment. There are two types of CIP amendments — administrative and policy level. Administrative amendments are approved by the Transportation Authority’s Executive Director or her designee. Policy-level amendments must be approved by the Transportation Authority Board. The type of approval required by an amendment request depends upon the significance of the proposed changes to the project’s scope, schedule and budget.
Administrative-level amendments address minor changes that do not substantively change the nature of the original project and its impact on system performance, and do not increase the amount of funding allocated or programmed by the Transportation Authority to the project. Administrative amendments will only require notification to and approval by the Transportation Authority’s Executive Director or their designee. The Executive Director may rule that a requested CIP amendment is administrative if the proposed changes, involving one or more projects and one or more funding sources, requires programming actions that can be authorized at the staff level at the Transportation Authority, at the MTC and/or the CTC, or at the regional office level for federal agencies, such as administrative TIP amendments.
Policy-level amendments apply to changes that are deemed by the Transportation Authority to be significant enough that they have the potential to affect the performance of the multimodal transportation system and represent a significant departure from the scope, schedule, or budget approved by the Transportation Authority. This may include changes that will affect the year of delivery (completion), the amount or availability of operating funds, the year of programming, the fund source designation, or any other aspect of the project requiring action by the MTC and/or the CTC for funds initially prioritized or programmed by the Transportation Authority. Policy-level amendments require approval by the Transportation Authority Board prior to processing of the change by the project sponsor or other funding agency.
Applicable funding sources include but are not limited to those programmed directly by the Transportation Authority, such as county share STP/CMAQ, SB 1 Local Partnership Program Formulaic Shares, RIP, LTP, TFCA, Prop L, Prop AA, and TNC Tax. Certain funding sources are programmed through state or regional processes and typically become available to project sponsors through a separate application procedure. Further, many sources have timely use of funds requirements where failure to meet deadlines can result in loss of funds to the project or to San Francisco or prohibition from applying for future cycles until deadlines are met. The MTC has requested that CMAs assist with oversight of certain funding sources (e.g. Highway Safety Improvement Program) even if not directly prioritized by CMAs. The intent is to improve project delivery and specifically to avoid loss of funds to the region. The Transportation Authority encourages sponsors to proactively notify the Transportation Authority of any project delivery issues or other issues that may threaten a project’s ability to meet timely use of fund deadlines, whether sources covered by CIP amendments or not. The Transportation Authority can serve as a resource and facilitator to help resolve delivery issues and avoid loss of funds to San Francisco projects.
The San Francisco Travel Demand Forecasting Model, known as SF-CHAMP, is a tool used to assess the impacts of land use, socioeconomic, and transportation system changes on the performance of the transportation system. SF-CHAMP was developed to reflect the unique transportation, socioeconomic, and land use characteristics of San Francisco and the Bay Area. The Model uses residents’ observed travel patterns; detailed representations of the region’s transportation systems, population and employment characteristics; tolling and parking pricing; and the number of vehicles available to households to simulate daily travel activity and measure performance. Future year transportation, land use, and socioeconomic inputs are used to forecast future travel demand.
SF-CHAMP is an activity-based microsimulation model that is sensitive to a broad array of conditions that influence travelers’ choices. It is a tour-based model which represents an entire day’s travel activity for each Bay Area resident, represented by a synthetic population. A tour is a sequence of trips made by an individual that begins and ends at home, whereas a trip is a single movement from an origin to a destination. This framework allows the model to:
At the time of its initial release, SF-CHAMP was one of the first activity-based travel demand models used in practice and has been continuously used and updated both in order to take advantage of new data, and to be appropriately sensitive to issues confronted in new projects and plans for which it is used. Two versions of SF-CHAMP are in current use: 7 (BCE, based on 2019 ("before COVID era") conditions) and 7CE (based on 2023 ("COVID era") conditions).
The Transportation Authority uses SF-CHAMP to provide detailed forecasts supporting planning applications, including the San Francisco Transportation Plan (SFTP 2050+), policy analyses, mobility assessments, the transportation planning and revenue forecasting for the Treasure Island Mobility Management Agency, and environmental analyses. Current model applications include the Freeway Network Managed Lanes Study, Tax Scenario Modeling, West Side Network, the Portal/Downtown Rail Extension, and the Treasure Island Mobility Management Study.
The key inputs required to develop and apply a travel demand forecasting model include information on household and individual travel behavior (obtained in a household travel survey), representations of the pedestrian, transit, and roadway networks, and spatial representations of employment and residential characteristics. SF-CHAMP 7 (BCE) was estimated and calibrated using the 2019 Bay Area Travel Study (BATS 2019) and SF-CHAMP 7CE was calibrated using the 2023 Bay Area Travel Study (BATS 2023).
SF-CHAMP 7CE uses the DaySim demand model. DaySim is an open-source travel demand microsimulation package that is used by several regional planning organizations in their travel demand models. DaySim consists of a series of discrete choice models that represent different components of travel decision-making. Each model has been estimated with BATS 2019 and re-calibrated with BATS 2023. The implementation of DaySim in SF-CHAMP added key functionality to the model, most importantly:
In addition to these new DaySim features, TNCs were added to the mode choice model and calibrated to TNC activity data from the SFCTA’s TNCs Today study. Autonomous vehicles were added for exploratory analysis. Truck and commercial vehicle models were separated from a single assignment class into two classes. New vehicle class restrictions were implemented to better represent existing HOV and other vehicle restriction policies. Figure A8-1 shows the model components and workflow of DaySim, the demand model core of SF-CHAMP.
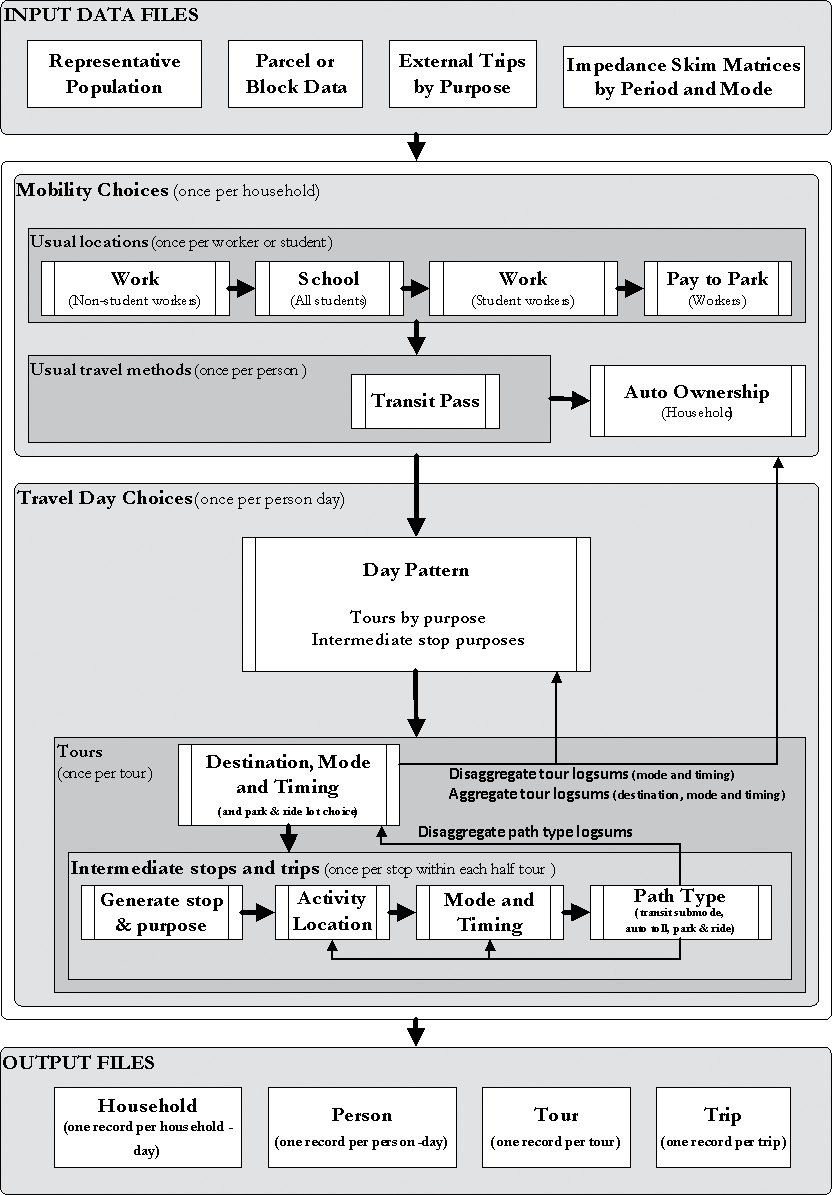
San Francisco’s travel demand model can use any standard set of ABAG land use projections as an input. While some projects use land use estimates prepared specifically for the project, most use ABAG’s Plan Bay Area 2050 forecasts for population, households, jobs, and employed residents. Outside of San Francisco, the Plan Bay Area 2050 forecasts are used without modification. The Transportation Authority has also prepared preliminary land use inputs designed to align with Plan Bay Area 2050+, but these will be updated to fully align with final Plan Bay Area 2050+ land use assumptions after those become available in late 2025. Within San Francisco, the San Francisco Planning Department allocates the countywide control totals for population, households, jobs, and employed residents to Transportation Analysis Zones (TAZs). Base year and future year forecasts were developed using a parcel-level residential and employment database, inventories of new development projects under construction, approved, and under review, and information on development potential for major area plans.
The San Francisco 981 TAZ system is used within the City and County of San Francisco. Outside of the City, the San Francisco Model zone system is the same as the MTC Travel Model 1 (TM1) 1,454 zone system. The model has 2,245 zones.
SF-CHAMP’s transportation networks are very detailed and use network assumptions consistent with the MTC Regional Transportation Plan. Within San Francisco, the network is an all-streets network which is highly spatially accurate and includes every street segment within the City. The roadway network outside of San Francisco is a simplified network developed from the MTC TM1 regional model highway network. All local and regional transit route alignments and all stop locations are coded in the SF-CHAMP’s transit networks. The regional transit network is a simplified network based on MTC’s TM1 transit network representation.
The model uses a synthesized population of Bay Area residents that matches Traffic Analysis Zone (TAZ) totals of households, population, and employed residents, as well as census-based distributions of household configuration, age, and income-level serve as inputs to the population synthesis model.
The model samples the Census Public Use Microdata Sample (PUMS) (from the American Communities Survey) household records, and then assigns these to the TAZ, based on the control totals and marginal distributions. The result is a file with one record for each decision-maker. It matches all control totals and distributions when aggregated to the TAZ-level.
The vehicle availability model predicts the vehicles available in each household for each Bay Area resident. The model estimates the probabilities of having zero, one, two, or three, or four or more vehicles available. The Model accounts for tradeoffs for auto ownership based on the employment locations of workers in the household. This is a significant factor for auto ownership in a transit-rich environment such as San Francisco.
The vehicle availability model was validated primarily on two key variables, number of workers per household and super district,Superdistrict is a geographic area defined by MTC. estimated with BATS 2019 and re-calibrated with BATS 2023.
The full day pattern model is actually several models used together to predict the main components of all of a person’s travel across the day. The Primary Tour Generation Models predict whether each individual will make either no tour on a typical weekday or will make a primary tour for one of the following purposes: work, university, school, escort, meal, social/recreational, shopping, or other. The primary tour is an individual’s longest tour. These primary tours are home-based. Work-based sub-tours and secondary home-based tours are also predicted. The models also predict whether there are intermediate stops on each tour half. Subsequent models predict the exact number of intermediate stops on each tour leg.
Tour mode constrains trip modes within the tour, and informs the timing and location of intermediate stops, subtours and secondary tours. The day pattern models were estimated with BATS 2019 and re-calibrated with BATS 2023.
The time-of-day model predicts the time (at the minute level) when the traveler leaves home to begin the primary tour simultaneously with the time the traveler leaves the primary destination to return home. It also predicts the times of intermediate stops. While trip arrival and departure times are estimated at the half-hour level, and then disaggregated to the minute, they are assigned to networks in 5 time periods:
The destination choice models estimate destinations for tours and trips generated by the day pattern model. The San Francisco DaySim Model uses destination choice models for work, school, and other tours, work-based subtours, and intermediate stops. The stops for work-based subtours and intermediate stops are conditional on the primary destination. The Destination Choice Models were estimated using BATS 2019, with other tour destination, work-based tour destination, and work location models calibrated using BATS 2023.
The Mode Choice Models predict the mode for each trip, once destinations have been determined. First, tour mode choice models determine the primary mode for the tour, while trip mode choice models determine the mode for each trip, based on the tour mode. SF-CHAMP uses the following modes:
The mode choice models were estimated with BATS 2019 and re-calibrated with BATS 2023, and validated using Census and ACS Journey to Work data, and observed SFMTA, BART, Caltrain, and Ferry ridership levels.
The visitor models estimate visitor trips by mode, estimated using San Francisco Visitor & Convention Bureau data, and coefficients derived from the Honolulu model visitor development effort.
The visitor models are significantly less complex than the San Francisco resident models. They estimate the number of visitors to 29 key visitor destinations for each of three modes. The destinations include among others, Alcatraz, Golden Gate Park, North Beach, Union Square, and a cable car ride.
The detailed estimate of activity patterns of Bay Area travelers (including the type and timing of trips, destinations, and modes of travel) results in tables of trips by mode of travel from zone to zone by time of day. This time period-specific demand is then assigned to the regional roadway and transit networks. SF-CHAMP 7CE assigns vehicles on the roadway network, and passengers on the transit network.
Roadway assignment predicts the route chosen by travelers based primarily on congested travel times and traveler cost (distance and tolls), using a generalized cost function. Generalized cost is a weighted cost that takes into account vehicle travel time, waiting time, walk access time, transfers, and transfer time. Routes are assigned and congested travel times are updated iteratively until travel times converge in a framework known as static user equilibrium.
Transit assignment predicts the specific route chosen, including transfers, based on walking time to the nearest stop, expected wait time, presence of other transit alternatives, fares, in-vehicle travel time, and walk time to the final destination. The transit assignment algorithm minimizes the generalized cost by origin-destination pair and time period.
The validation of transit and highway assignments is done separately, using observed volumes of vehicles and passengers on the highway and transit systems, respectively. Assignment validation at the county level was completed using aggregated volumes by corridor (identified by screenlines), type of service (facility type, mode or operator), size (volume group), and time period. Speeds and travel times are also used in highway and transit validations to ensure that these are accurately represented in the models.
The Transportation Authority uses a Geographic Information Systems (GIS) database coupled with a variety of GIS tools, including QGIS, ESRI’s ArcGIS, and python geoprocessing packages like shapely and geopandas to complement the strategic analysis facilitated by SF-CHAMP. The Transportation Authority’s GIS database includes a large repository of shape files corresponding to local and regional street networks, census tracts, census block groups, census blocks, TAZs, transit routes, public facilities, and more, updated periodically from source data.
The Transportation Authority also maintains a geodatabase of level-of-service data containing auto and transit travel time and speed data for CMP segments, updated biennially.