The recent shelter-in-place orders have changed traffic patterns and congestion much more rapidly than we’ve ever seen. Overnight, San Francisco went from experiencing some of the worst congestion in the country to being virtually congestion-free. Recently, as the economy begins to recover, we have seen traffic and congestion levels rising. We launched the COVID-Era Congestion Tracker, an interactive map of key segments in our transportation network, to illustrate these unprecedented changes. The congestion tracker allows users to view speed data on a given area or particular segment, and to choose morning or evening views, as well as select views of absolute speeds or comparisons with pre-COVID conditions.
Freeway speeds: The visualization shows that freeway speeds increased significantly after the shelter-in-place order on March 16, with average evening speeds increasing to more than 60 mph from 26 mph.
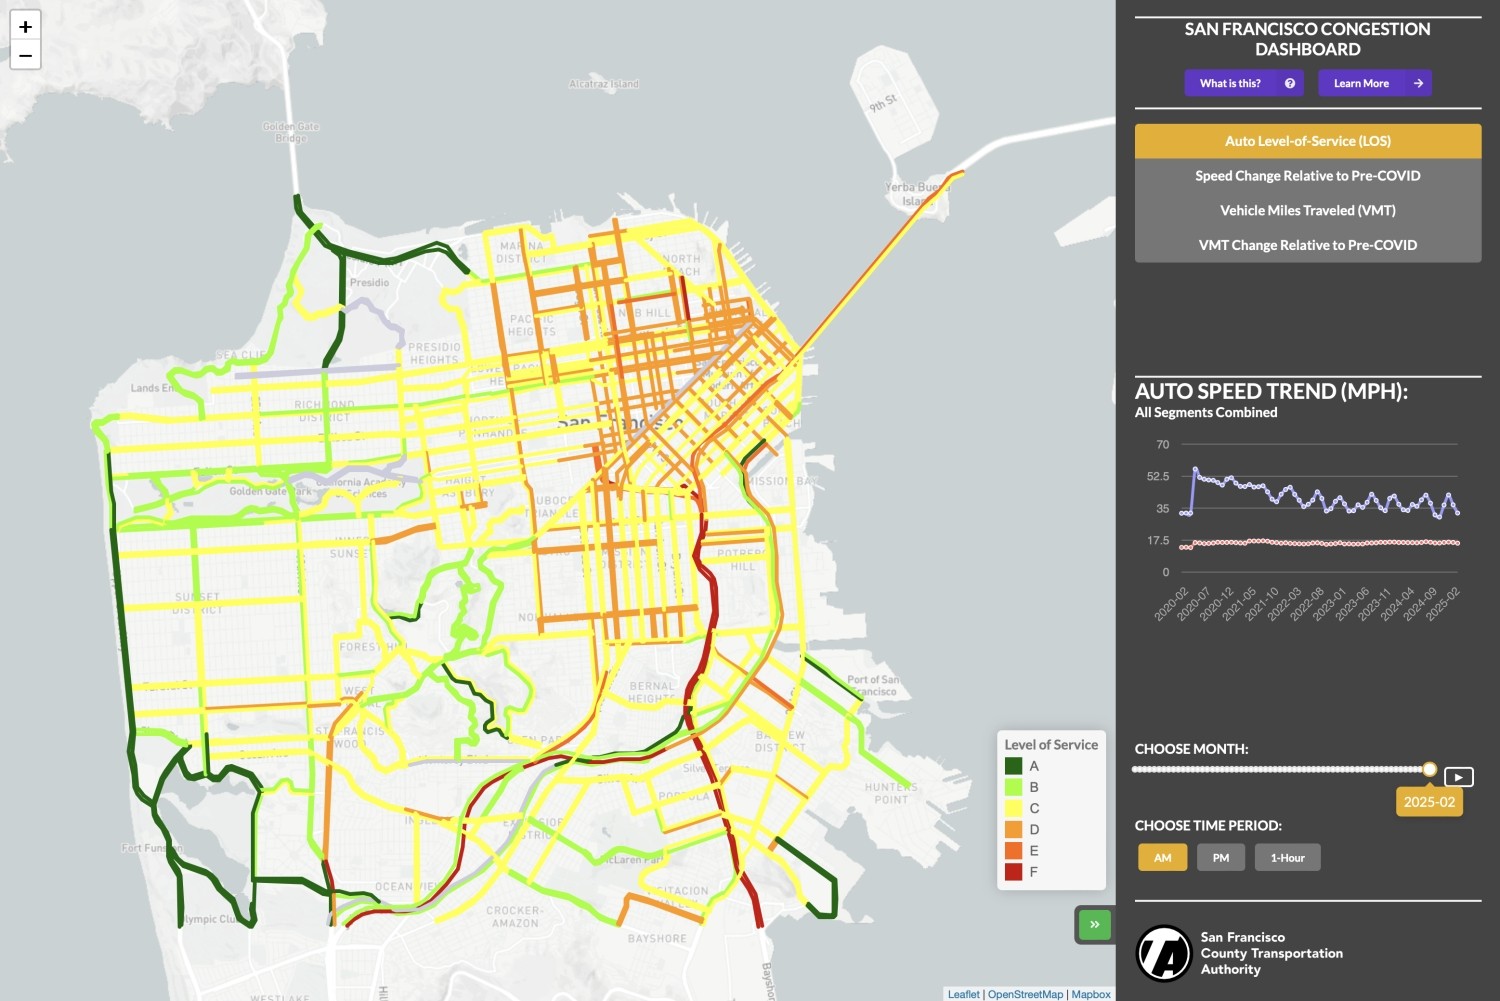
Speeds on city streets: The map shows that speeds on city streets increased from about 12 to 16 miles per hour with the shelter-in-place order.
COVID-Era Congestion Map
The map shows roadway segments for which the Transportation Authority monitors congestion. Hotter colors such as red show slower speeds, while cooler colors such as green show faster speeds. Overall speed trends are shown in the chart on the right, and selecting an individual roadway link allows one to look at the speed data for this specific roadway link.
Recently, with the resumption of some businesses last week, congestion is rising along many segments of our downtown core. Unlike freeways, congestion on surface streets doesn't appear to be increasing overall (though on some streets congestion has started to re-emerge).
“Transportation plays a key role in the plan to support economic recovery while maintaining public health,” said Aaron Peskin, Transportation Authority Board Chair and District 3 Supervisor. “As San Francisco reopens, this new Congestion Tracker will help support planning and decision-making for our transportation system in a data-driven way.”
The Transportation Authority is the congestion management agency for San Francisco and partners with local and regional transportation agencies to ensure accessibility, particularly by affordable and sustainable modes.
“We are pleased to add the new Covid-Era Congestion Tracker to our toolkit of online interactive maps and data resources describing San Francisco travel trends and patterns,” said Tilly Chang, Executive Director of the Transportation Authority. “This near-real time tool provides a week-by-week view of network trends including where congestion has subsided, where it is slowly returning, and in some cases, where it is already at higher levels than before the pandemic.”
The data underlying this map is collected by Inrix, which monitors traffic data, and provided to us and other Bay Area Congestion Management Agencies by the Metropolitan Transportation Commission. The data in the interactive map is updated approximately every one to two weeks.
This new visualization can serve a number of purposes:
- Support ongoing Vision Zero safety efforts to maintain safe streets as vehicle speeds rise.
- Identify where and when congestion is increasing as shelter-in-place regulations are lifted. This can support local and regional efforts to keep road users safe and traffic moving smoothly.
- Inform SFMTA’s six-step transportation recovery plan, which is exploring ways to enhance major transit routes and other network changes to support economic recovery and public health.
- Help city agencies monitor the effects of Open Streets and Slow Streets and support decisions about how to manage these streets as the city re-opens.
Every other year since 1991, the Transportation Authority has prepared a report on changes in roadway congestion in San Francisco. You can find almost 30 years of congestion monitoring on our website, and check out this and other tools on our Tools and Data page.