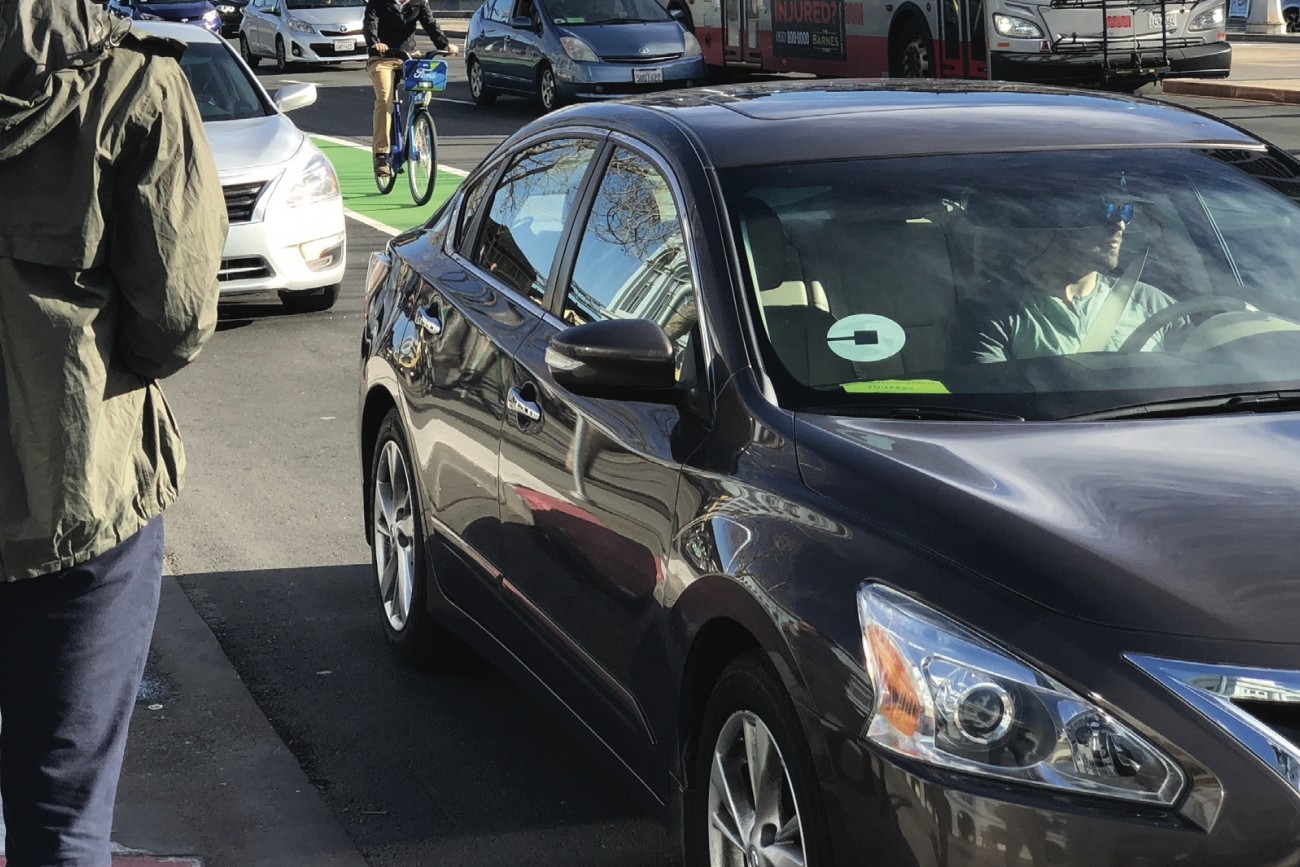
Photo by SFMTA Photography Department
A new dashboard presenting wheelchair access data from transportation network companies or TNCs is now available. The dashboards show how TNCs like Uber and Lyft are serving passengers with wheelchairs and can be used to evaluate whether TNCs are meeting the TNC Access for All Act benchmarks for trip completion and response times by county.
Learn more and explore the dashboards on SFMTA’s website
Dashboard summaries can be generated by:
- TNC
- County
- Year
- Quarter
Metrics include:
- Requested trips
- Completed trips
- Percent completed trips
- Requests canceled
- Requests canceled by driver
- Requests canceled by passenger
- Requests passenger no show
- Average number of wheelchair accessible vehicles available by day-of-week and hour-of-day
- Percentage of completed trips meeting county response time benchmarks
- Average response time between passenger request and driver arrival
- Total wheelchair accessible vehicle expenditures
- Wheelchair accessible vehicle expenditures by category
- Number of complaints by type
SFMTA led the project to build the dashboards to transparently report the data required to be submitted by TNCs to the California Public Utilities Commission as part of the TNC Access for All Act, signed into law by former Governor Jerry Brown in 2018. Along with ZS associates, a pro-bono consultant matched through San Francisco’s Office of Civic Innovation’s Civic Bridge Program, the Transportation Authority supported the effort by helping SFMTA and ZS to understand the data and design the dashboards. SFMTA will be updating the dashboard as new data is released.
The Transportation Authority also maps data on transportation projects, congestion, and more to help policymakers and the public better understand the city's transportation network. These tools help us evaluate San Francisco's transportation system and make informed decisions for the future.
Explore the Transportation Authority’s tools and data
Resources
CPUC's TNC Access for All Program Response Time Report, March 2021 (PDF)
