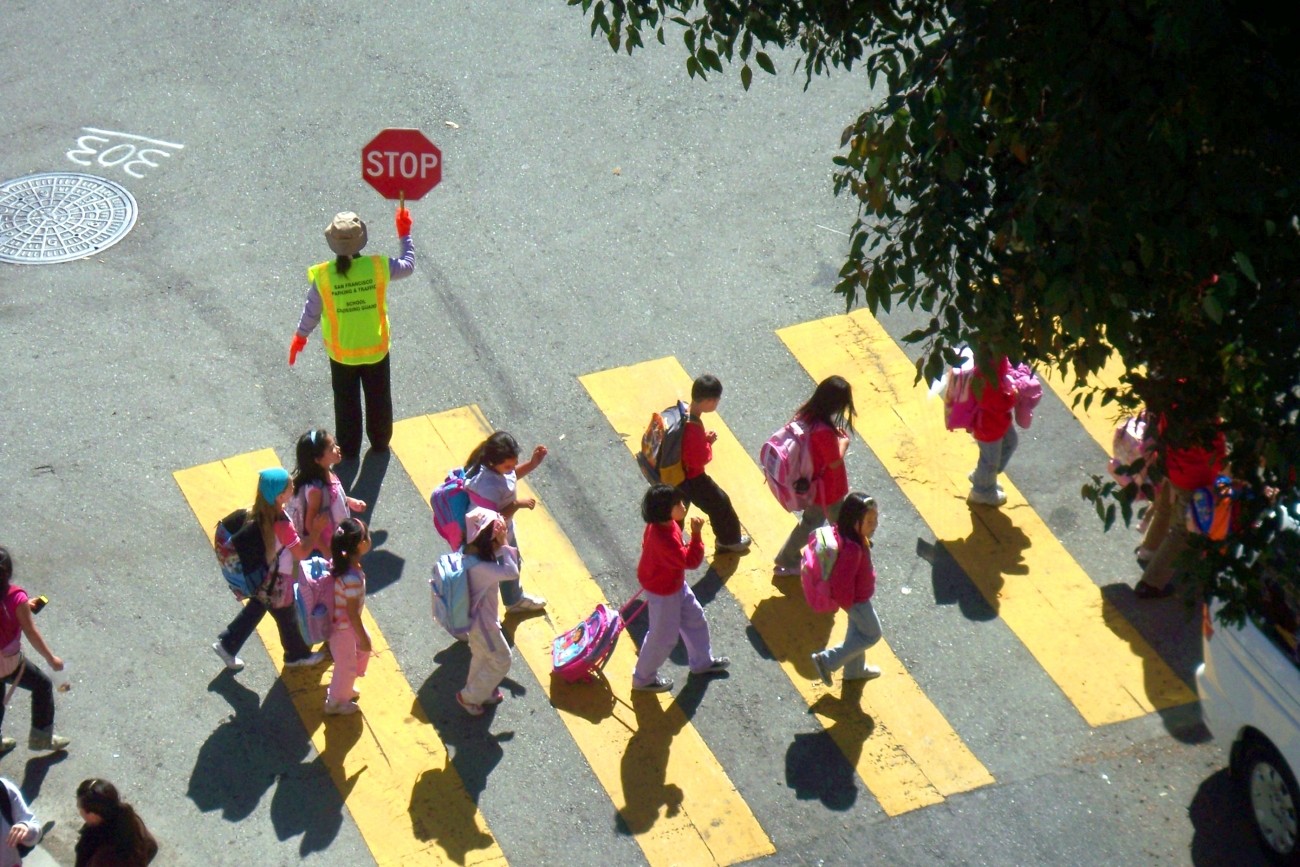
Photo by SFMTA Photography Department
This past November, the Transportation Authority Board held its last Vision Zero hearing of 2022, featuring presentations by the San Francisco Vision Zero Task Force co-leads, the San Francisco Department of Public Health and SFMTA.
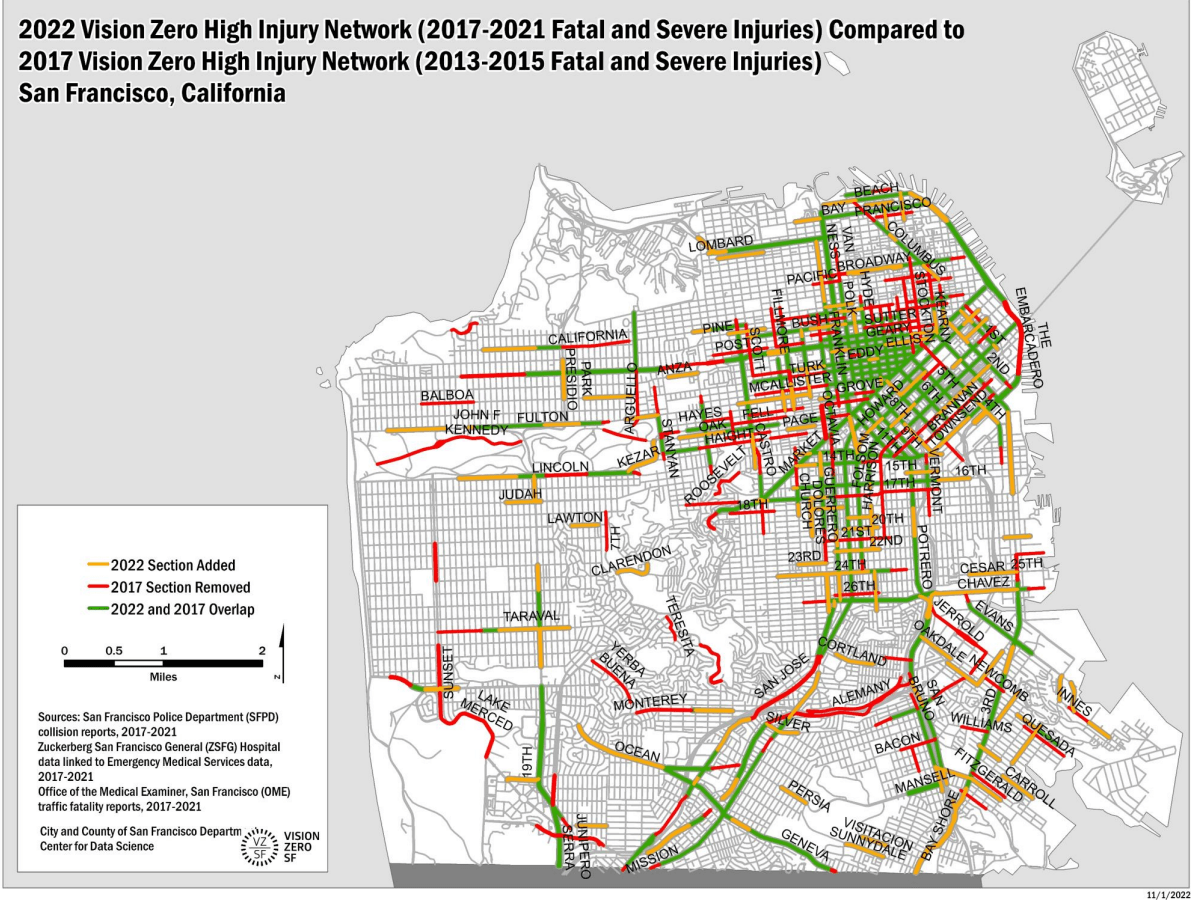
2022 Vision Zero High Injury Network
The San Francisco Department of Public Health gave an update on the updated map for the 2022 Vision Zero High Injury Network. Utilizing data from 2017-2021, the new maps reflect several findings:
- An updated methodology to develop the High Injury Network given unprecedented changes in traffic patterns that occurred due to the COVID-19 pandemic. The new methodology uses five years of severe and fatal crash data instead of the three years used during the 2017 update.
- At a high level, the 2022 High Injury Network revealed that the Network represents 12% of city street miles and captures 68% of severe and fatal injuries
- 63% of the updated 2022 High Injury Network overlaps with the 2017 network.
- Pedestrians are the highest proportion of severe and fatal injuries captured on the 2022 High Injury Network (70.5%), relative to other modes
Learn more about the 2022 Vision Zero High Injury Network Methodology (PDF) and view the November 15 board presentation (PDF)
2022 Safe Streets Evaluation Program
As part of the Safe Streets Evaluation Program, SFMTA evaluates street safety project designs to assess their effectiveness in improving bicycle and pedestrian safety. Their evaluation looked at a number of quick-build and capital projects throughout the city, which include strategies such as vehicle travel lane reductions, separated bikeways, pedestrian signal improvements, and more.
Some highlights from SFMTA’s 2022 Safe Streets Evaluation Program presentation report include:
- Vehicle collisions decreased by 18%, among the evaluated projects with at least three years of police report data
- Street design changes are decreasing bike collision rates by 33% and pedestrian-related collision rates by 32%
- Bicycle volumes are up significantly on the two streets that had no bike facilities at all before the projects (2nd Street and Masonic Avenue)
- Overall, the seven intersections piloted in early 2021 for left-turn traffic safety treatments resulted in an approximately 17% reduction in average speed (1.7 mph slower) and a 71% reduction in the likelihood of a car turning left at speeds over 15 mph.
Learn more about the 2022 Safe Streets Evaluation Program findings, methodology, and tools at SFMTA’s website and view the November 15 board presentation (PDF)
WalkSF also shared a presentation on ways to make San Francisco a “Safe Speeds City.” Tools include:
- Setting lower speed limits
- Reducing, reconfiguring, and narrowing lanes
- Timing traffic signals
- Reducing speed at intersections and midblock
- Vertical speed reducers (speed humps, cushions, and more)
- Speed radar signs
- Midblock solutions (chicanes, pinch points, crosswalks, and islands)
- Roundabouts and traffic circles
View the presentation (PDF) and the full report (PDF)
See “resources” below for additional Vision Zero related information.
Watch the Vision Zero related segments at the Transportation Authority Board
Resources
Vision Zero San Francisco Maps & Data
2022 Vision Zero High Injury Network Map
2022 San Francisco Traffic Fatality Notification Table
San Francisco Traffic Fatalities Map
SFMTA Vision Zero Safe Streets Quarterly Progress
Related Content