Image

The Laguna Honda Gondola Feasibility Study evaluates whether an aerial gondola could provide a safe, ADA-accessible, and reliable connection between the Forest Hill Muni Metro Station (Station) and the Laguna Honda Hospital and Rehabilitation Center (Hospital) which is being planned for future residential development. Today, steep topography, an indirect ADA accessible pedestrian route, and traffic volumes on Laguna Honda Boulevard create significant barriers for hospital staff, residents, patients, and visitors traveling between these two sites. This study was initiated at the request of Transportation Authority Chair and District 7 Commissioner Myrna Melgar to help assess mobility options to support future development.
To assess the viability of a gondola connection, the study team analyzed existing conditions that include a shuttle service provided and supported by the Hospital (with monthly ridership of ~2,500), reviewed precedent systems from elsewhere, considered future travel demand, and developed and compared six potential alignment alternatives. The feasibility analysis incorporated site visits; collision, transit, and shuttle ridership data; hospital growth plans; and information about historic resources.
For the demand analysis, the study team used Replica, an activity-based travel demand platform that applies a disaggregate travel forecasting framework to simulate individual and household daily activity patterns and derive resulting travel behavior from large-scale anonymized mobility data. The study team evaluated existing and future demand scenarios derived from transit and walking trips. The resulting potential demand is approximately 135 – 270 average weekday trips today, increasing to approximately 195 – 390 trips by 2030 with planned development on the Hospital campus. Approximately 70% of this demand is associated with the Hospital Pavilion Building, where most residents and staff are located and an additional 460 staff are expected to be located.
Six alignment alternatives were developed based on potential launch points near the Station and potential landing points at the Hospital. Alternatives were evaluated for constructability, utility conflicts, environmental constraints, accessibility, and ability to serve primary demand. The analysis identified an alignment serving the Hospital Pavilion Building as the most feasible option, offering the best balance of demand served, constructability, and minimizing conflicts with utilities, trees, and historic resources.
The study team developed rough order-of-magnitude cost estimates, informed by two ropeway manufacturers and civil infrastructure assumptions. The analysis estimates a total implementation cost of approximately $23 million in year of expenditure dollars, which is assumed to be 2028 for soft costs and 2030 for capital costs, with annual operations and maintenance costs of approximately $2 million per year, including an on-board attendant on the gondola, for 10 years, starting in 2030.
The current shuttle services have an annual cost of $300,000. Comparative analysis of the gondola system and shuttle alternative yielded the following findings:
Given the technical nature of this study, the main outreach tasks were limited to consulting hospital administrators, shuttle service providers and transportation staff at partner agencies. The study team also conducted cost research with gondola suppliers.
Following development of the gondola alignment and system concept, demand projections and capital and operating cost estimates and a conceptual evaluation of the shuttle alternative, the study team concludes that the gondola is a less cost-effective solution than developing shuttle and TDM strategies, and does not recommend further study of a gondola concept for the Laguna Honda site.
While the Study confirms that a gondola system is technically feasible, its relatively high capital and operating costs for the short distance at this location makes alternative mobility solutions — such as enhanced shuttle service paired with effective demand management programs — the more cost-effective approach to supporting future growth at the Laguna Hospital and residential development sites at this time.
While a gondola would provide twice or more the capacity of the shuttle, the shuttle service would generally have adequate capacity to serve future demand growth scenarios resulting from planned Hospital growth. Peak hour conditions under the higher-growth scenario or additional non-Hospital trip growth may strain shuttle capacity and warrant additional demand management strategies (e.g. carpool incentives) or shuttle services.
The purpose of this Laguna Honda Gondola Feasibility Study is to explore the feasibility of an aerial gondola system as a potential way to enhance ADA access and improve first- and last-mile connectivity between the Forest Hill Muni Metro Station (Station) and Laguna Honda Hospital and Rehabilitation Center (Hospital) in the Forest Hill neighborhood of San Francisco, supporting current demand and future residents and visitors as anticipated with planned growth. The proposed gondola would connect the Station — a key transit hub — with the Hospital, addressing significant accessibility challenges created by steep topography and the heavily trafficked Laguna Honda Boulevard.
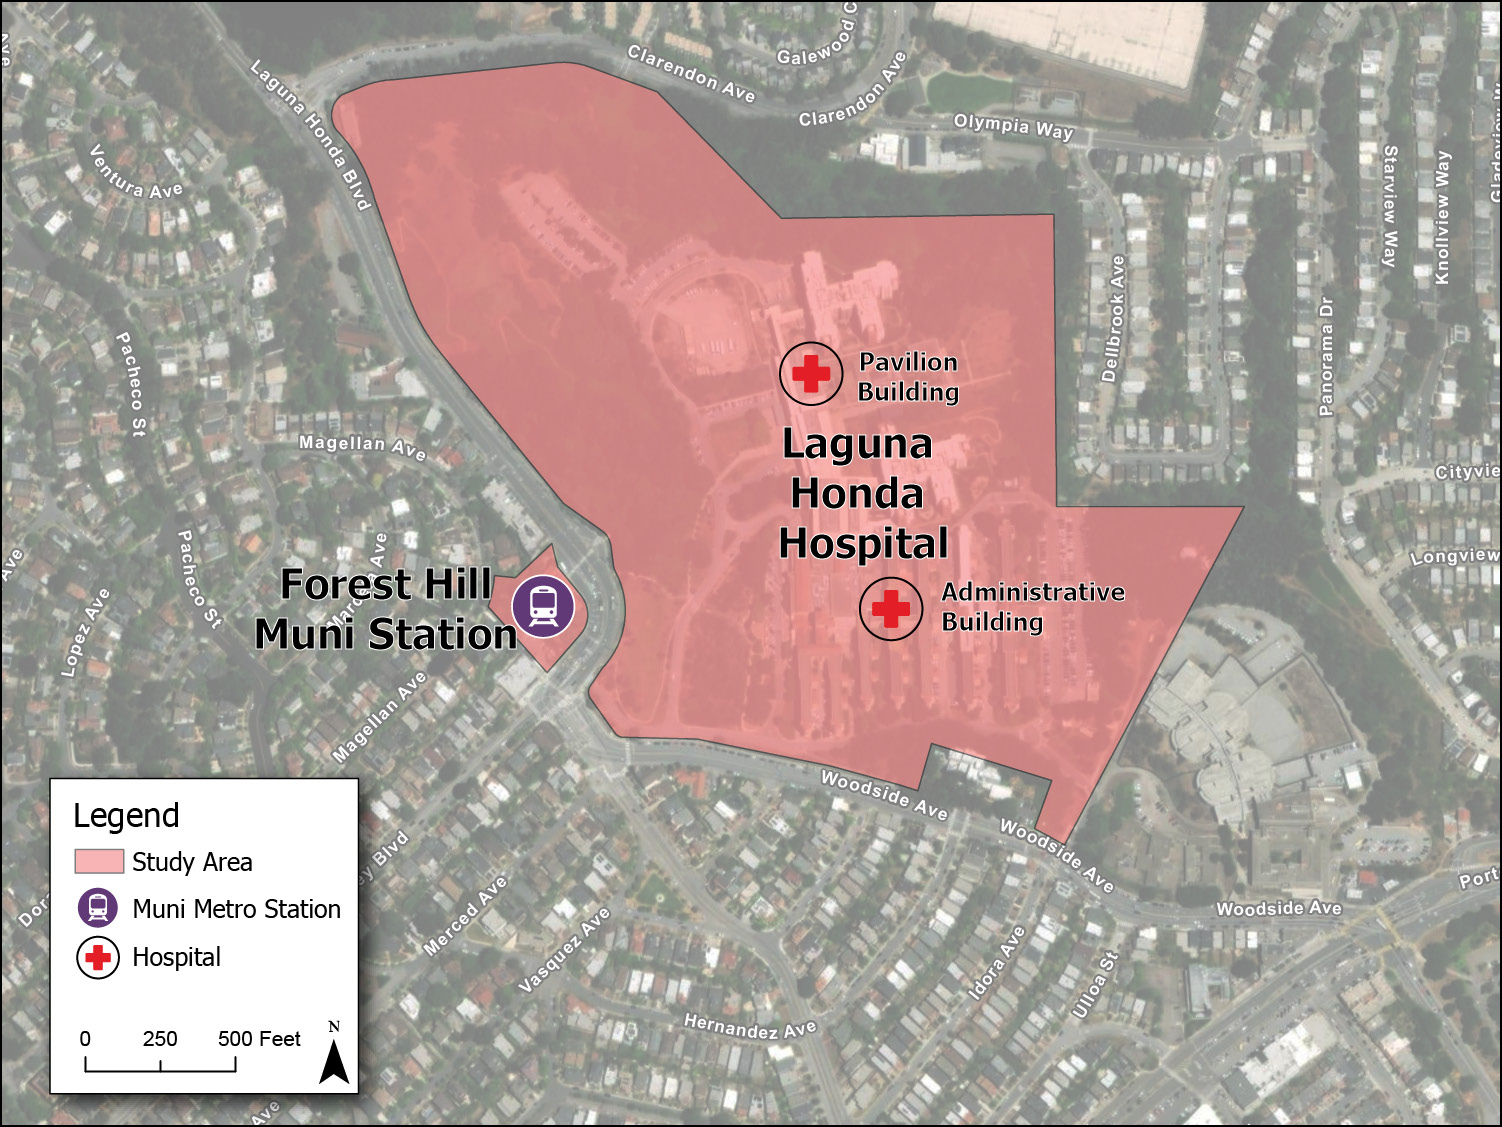
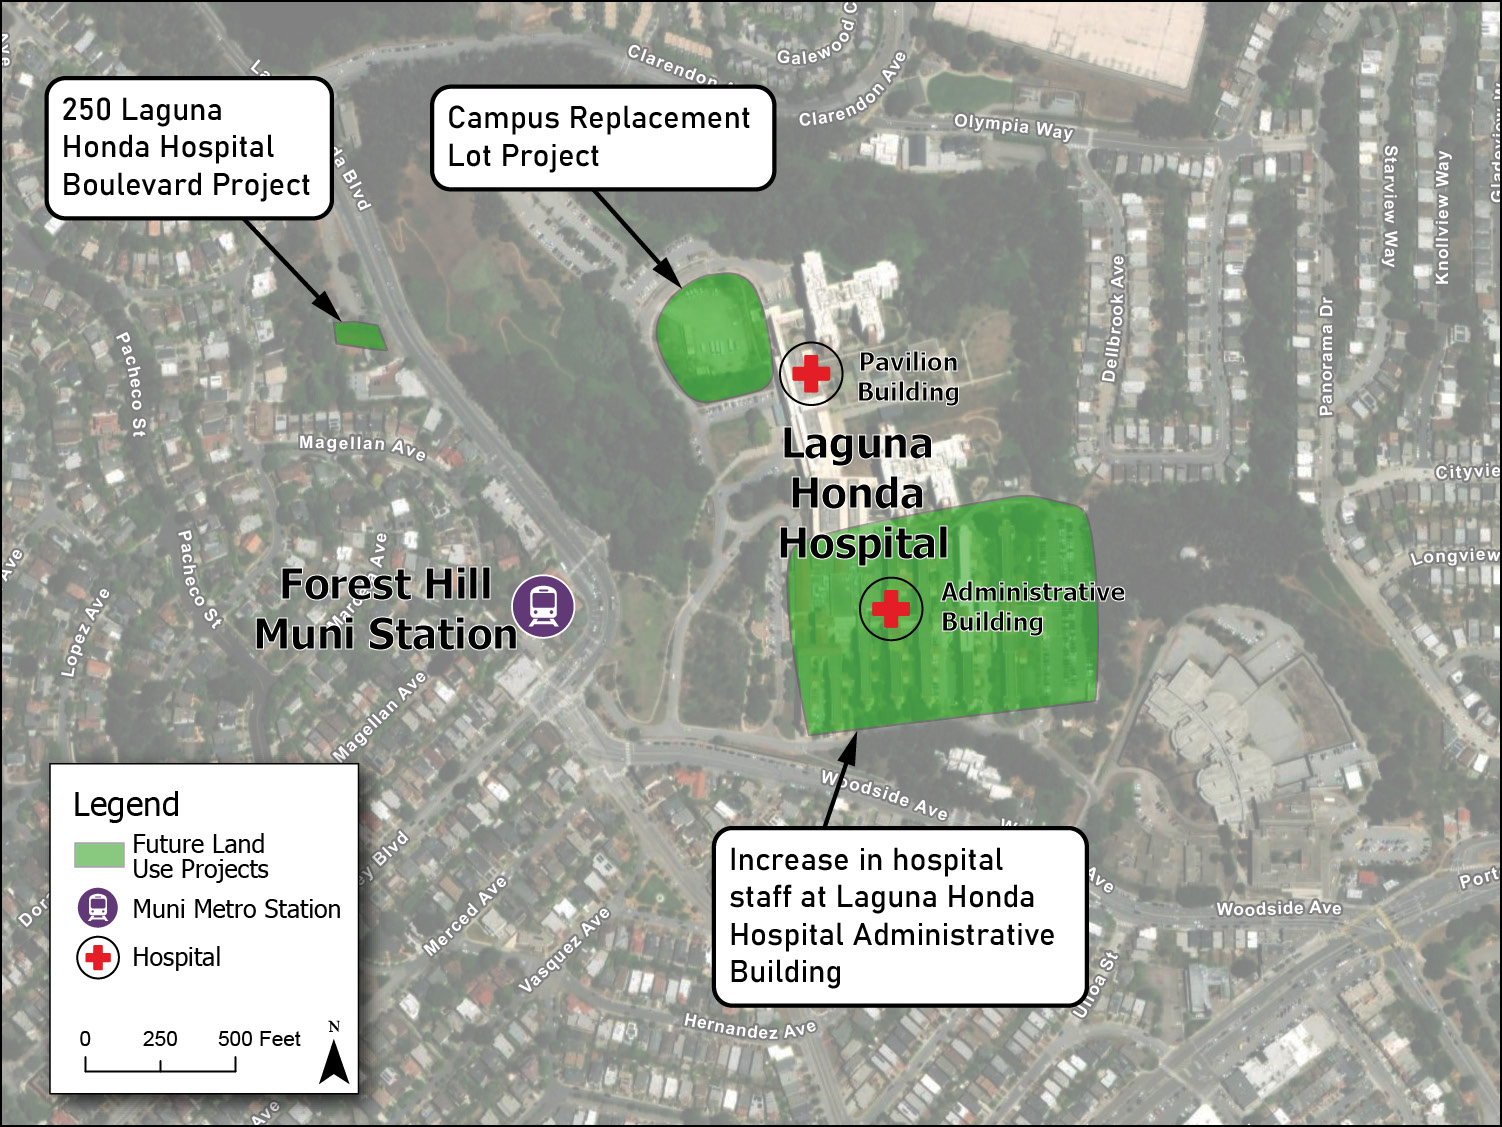
In addition to serving hospital staff, patients, and visitors, the gondola could improve access to the proposed affordable senior housing development at the Laguna Honda Hospital Campus Replacement Lot (Campus Replacement Lot Project) and 460 additional hospital staff. The Study Area includes both the Hospital parcel and the Station parcel (Figure 2-1). Figure 2-2 illustrates future land use, including the Campus Replacement Lot Project.
This Study provides a planning level evaluation of a proposed gondola system. The study team identified key constraints, opportunities, benefits, and costs associated with a gondola system. We conducted a market assessment to estimate demand, evaluated alignment alternatives to determine the most feasible option based on mobility needs and site constraints, developed conceptual horizontal and vertical alignments for the most feasible alternative, and incorporated cost estimates from two ropeway suppliers.
Several aerial gondola and ropeway systems operate in urban environments worldwide to address steep terrain, physical barriers, and first- and last-mile connectivity. As part of this Study, we reviewed the following precedent projects to understand how similar systems function in practice, including system length, vertical rise, connectivity to transit, operational characteristics, and costs, the details of which are provided in Appendix A:
These precedent systems highlight both transportation-focused systems and smaller-scale applications relevant to the Study context and demonstrate that gondolas can function either as localized access solutions or as integrated components of a broader transit network, depending on system scale, alignment, and connectivity.
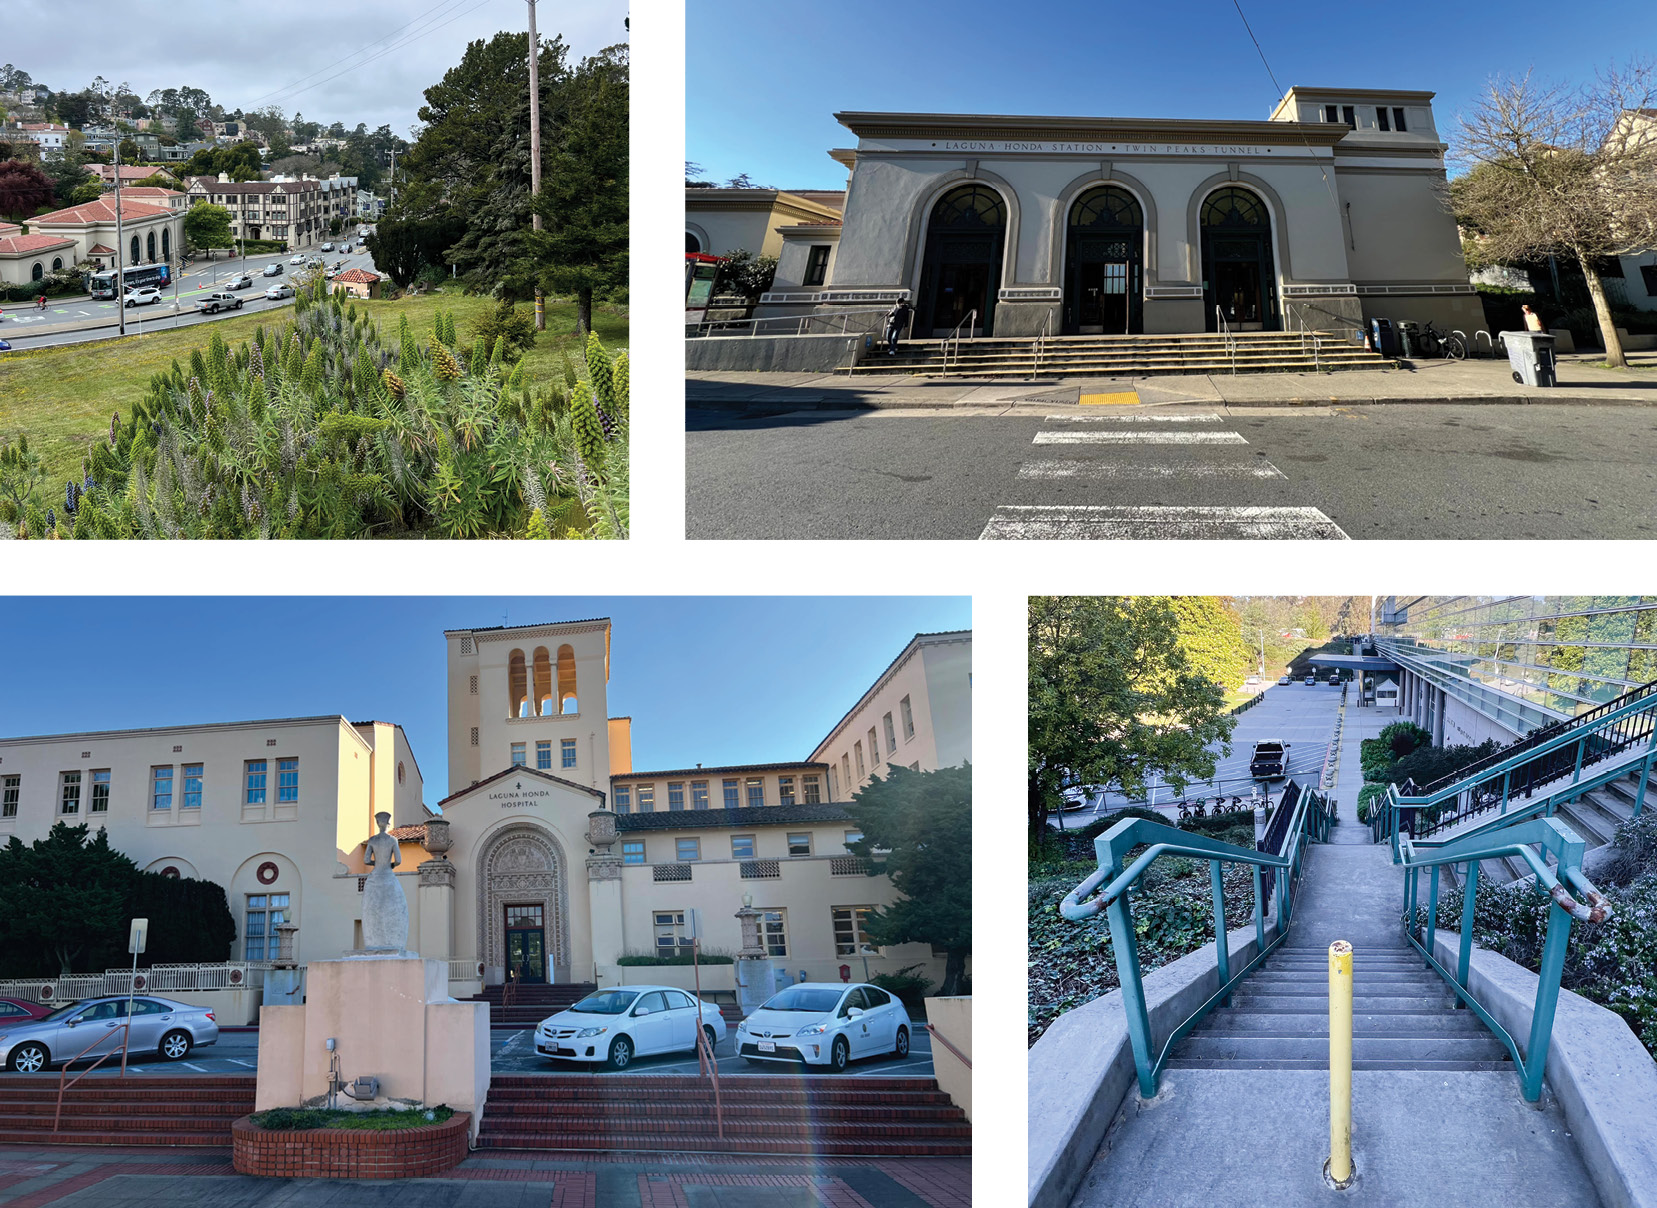
On April 23, 2025, the study team conducted a site visit of the Study Area with Transportation Authority and San Francisco Department of Public Health (SFDPH) staff. The study team documented existing pedestrian pathways, site grading, and general site characteristics. Figure 4-1 includes photographs from the site visit.
The Team collected data from a variety of sources to document the Study Area’s collision history, travel patterns, and hospital staffing. The Team considered the following data to understand existing conditions:
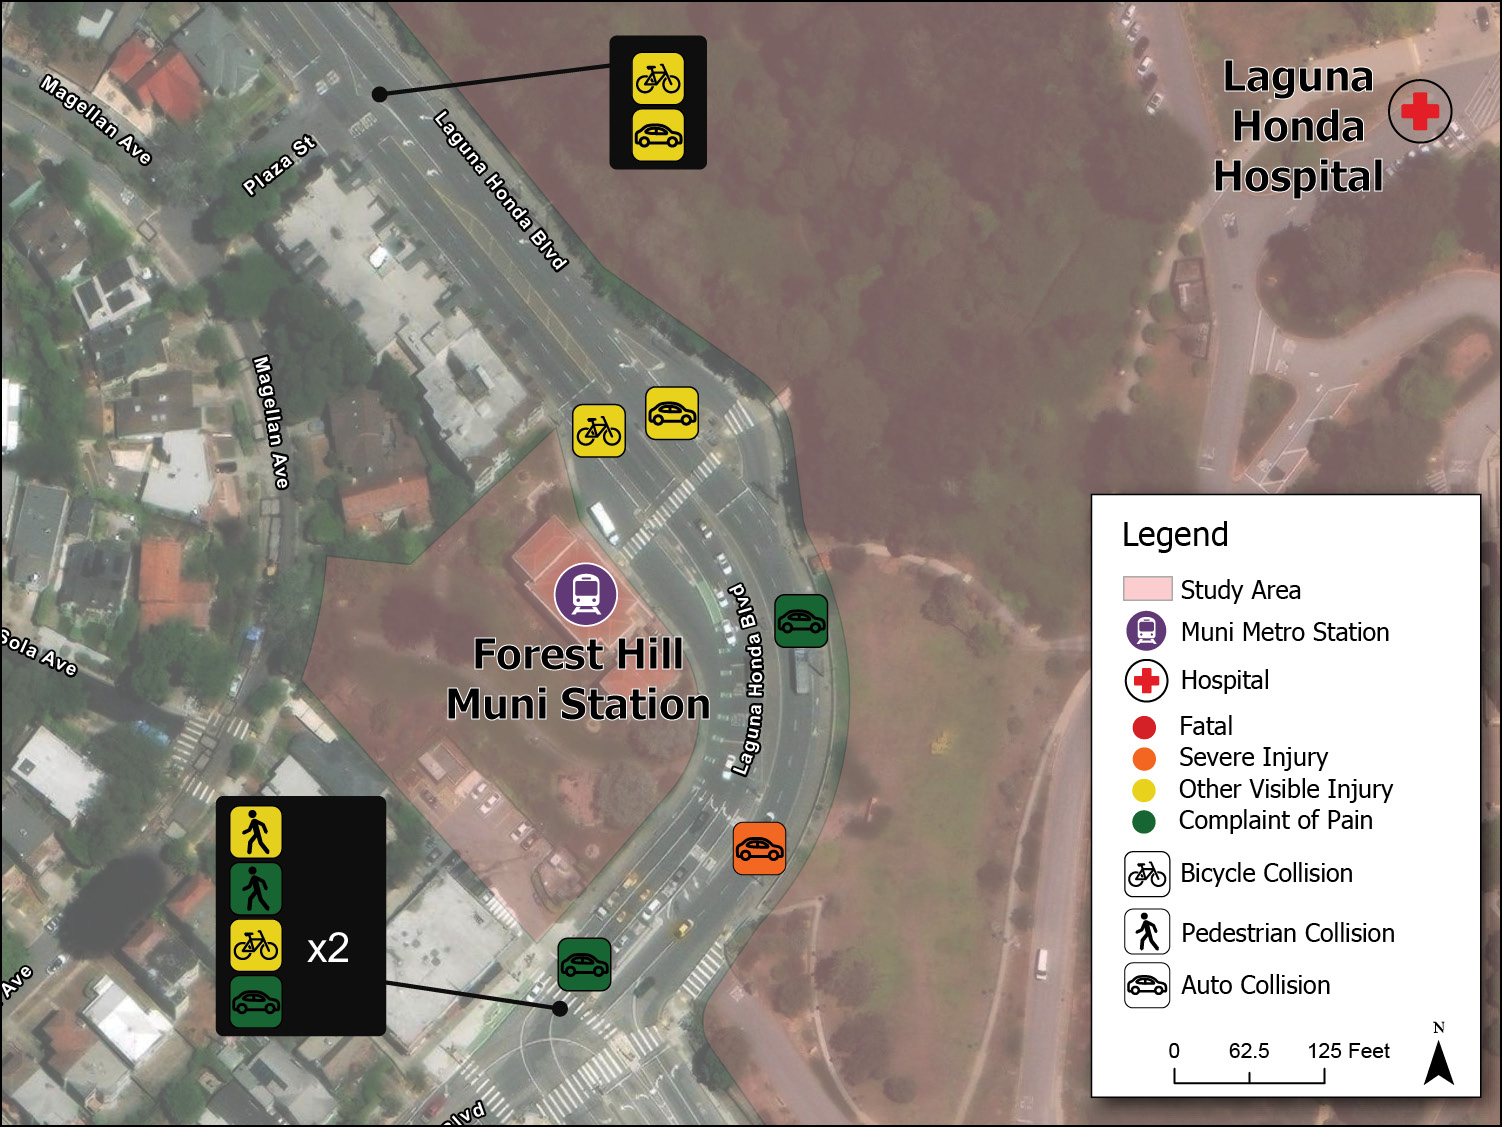
The Team collected collision data from the City of San Francisco’s Open Data portal for a 10-year period from 2015 – 2024. The analysis identified 12 collisions within the Study Area, including six collisions involving cyclists or pedestrians. Of the 12 crashes, one involving two vehicles resulted in a severe injury. Figure 4-2 maps Study Area crashes by mode and severity.
Laguna Honda Hospital and TransMetro currently operate weekday shuttle service between the Hospital and Station. SFDPH provided ridership data showing average monthly ridership (April 2025 – June 2025) of 719 for the TransMetro shuttle and 1,745 for the Laguna Honda Hospital shuttle.
San Francisco Municipal Transportation Agency (SFMTA) provided transit ridership data for the Station, which the K, L, and M Muni lines serve. SFMTA also provided ridership data for the bus stops adjacent to the Station served by routes 36, 43, 44, and 52. The data included inbound and outbound boardings and alightings.
The data provided included both trips that begin or end in the Study Area as well as transfer trips at the Station. Transfer trips (e.g.: between Muni lines or between a bus and Muni line) are counted twice — as an alighting from one service and a boarding of another service.
SFDPH provided the number of residents and employees in each Hospital building for May 2025, along with the number of visitors to the Hospital during July 2025. Table 4-2 summarizes the number of residents, staff, and visitors.
|
Pavilion |
Admin |
Total |
|
|---|---|---|---|
|
*Existing number of residents; can go up to 649 |
|||
|
Residents |
508* |
N/A |
508 |
|
Staff |
737 |
540 |
1,277 |
|
Monthly Visitors |
459 |
||
The Team used Replica, an activity-based travel demand model, to analyze trips with an origin or destination within the Study Area, defined as the Laguna Honda Hospital parcel and Forest Hill Muni Station parcel shown in Figure 2-1. Trips that merely pass through the Study Area without beginning or ending within the Study Area were excluded from the analysis. A ‘trip’ is defined as “a movement by a person between places. A trip begins when a person leaves a place and ends when a person stops to do a non-travel activity in a place.”Defined from Replica’s methodology The model estimates approximately 6,200 daily trips to and from the Study Area. Replica data indicates that 60% of trips (3,719 trips) occur within San Francisco, primarily to and from areas north of the Study Area.
In addition to the number of trips taken to and from the Study Area, Replica was used to estimate the number of people traveling to and from the Study Area. The model estimates approximately 1,660 people arriving and 2,110 people departing the Study Area on a typical weekday.
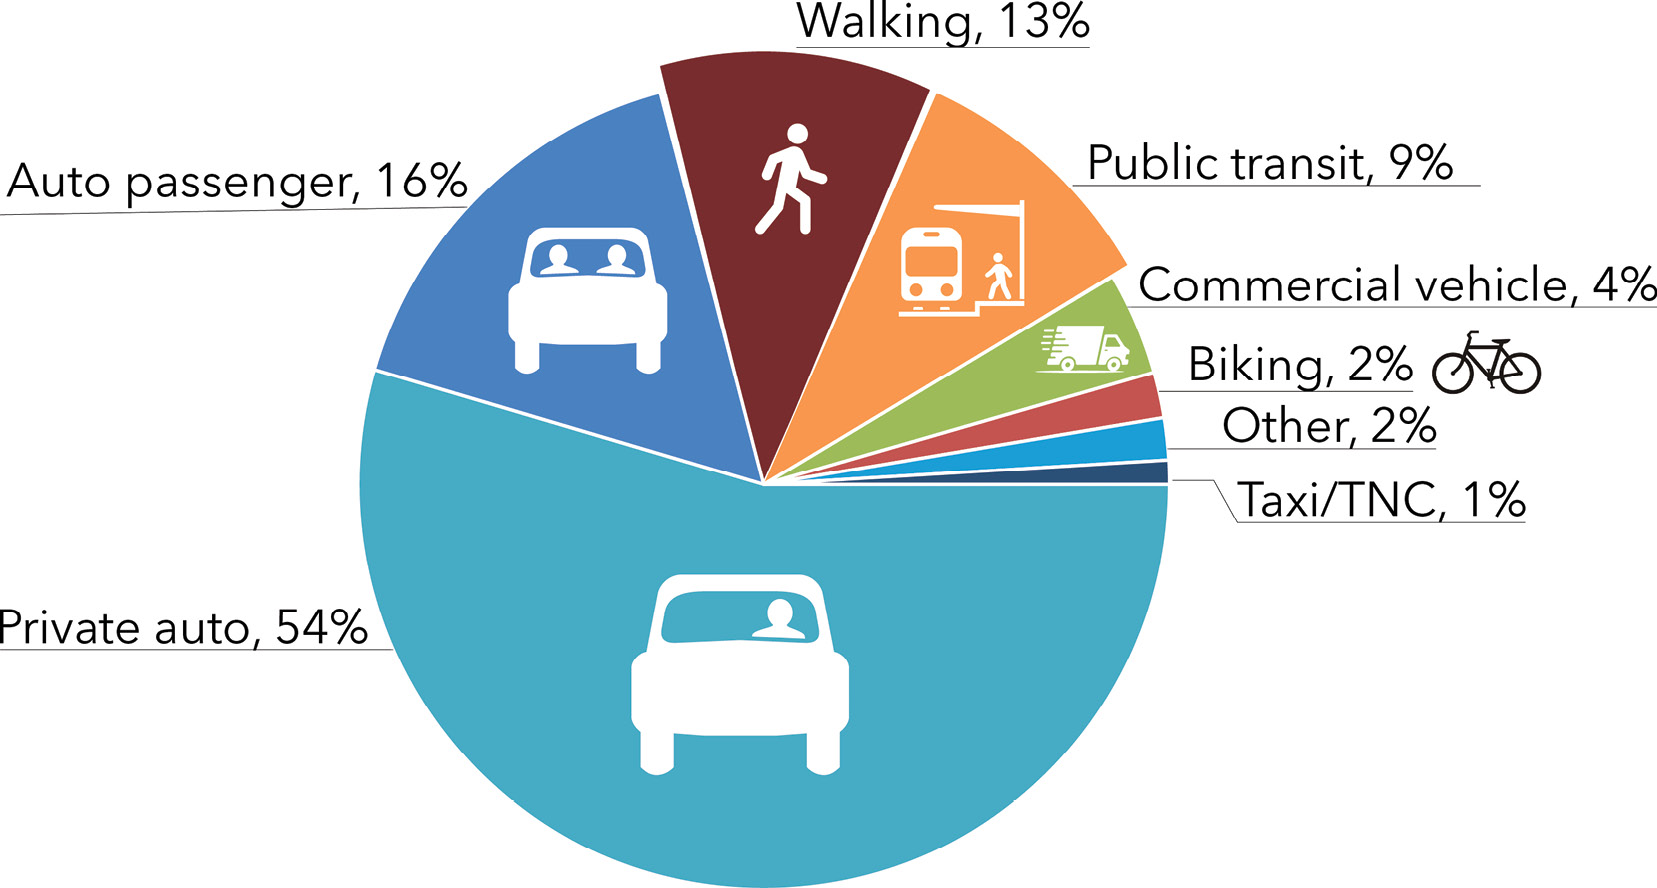
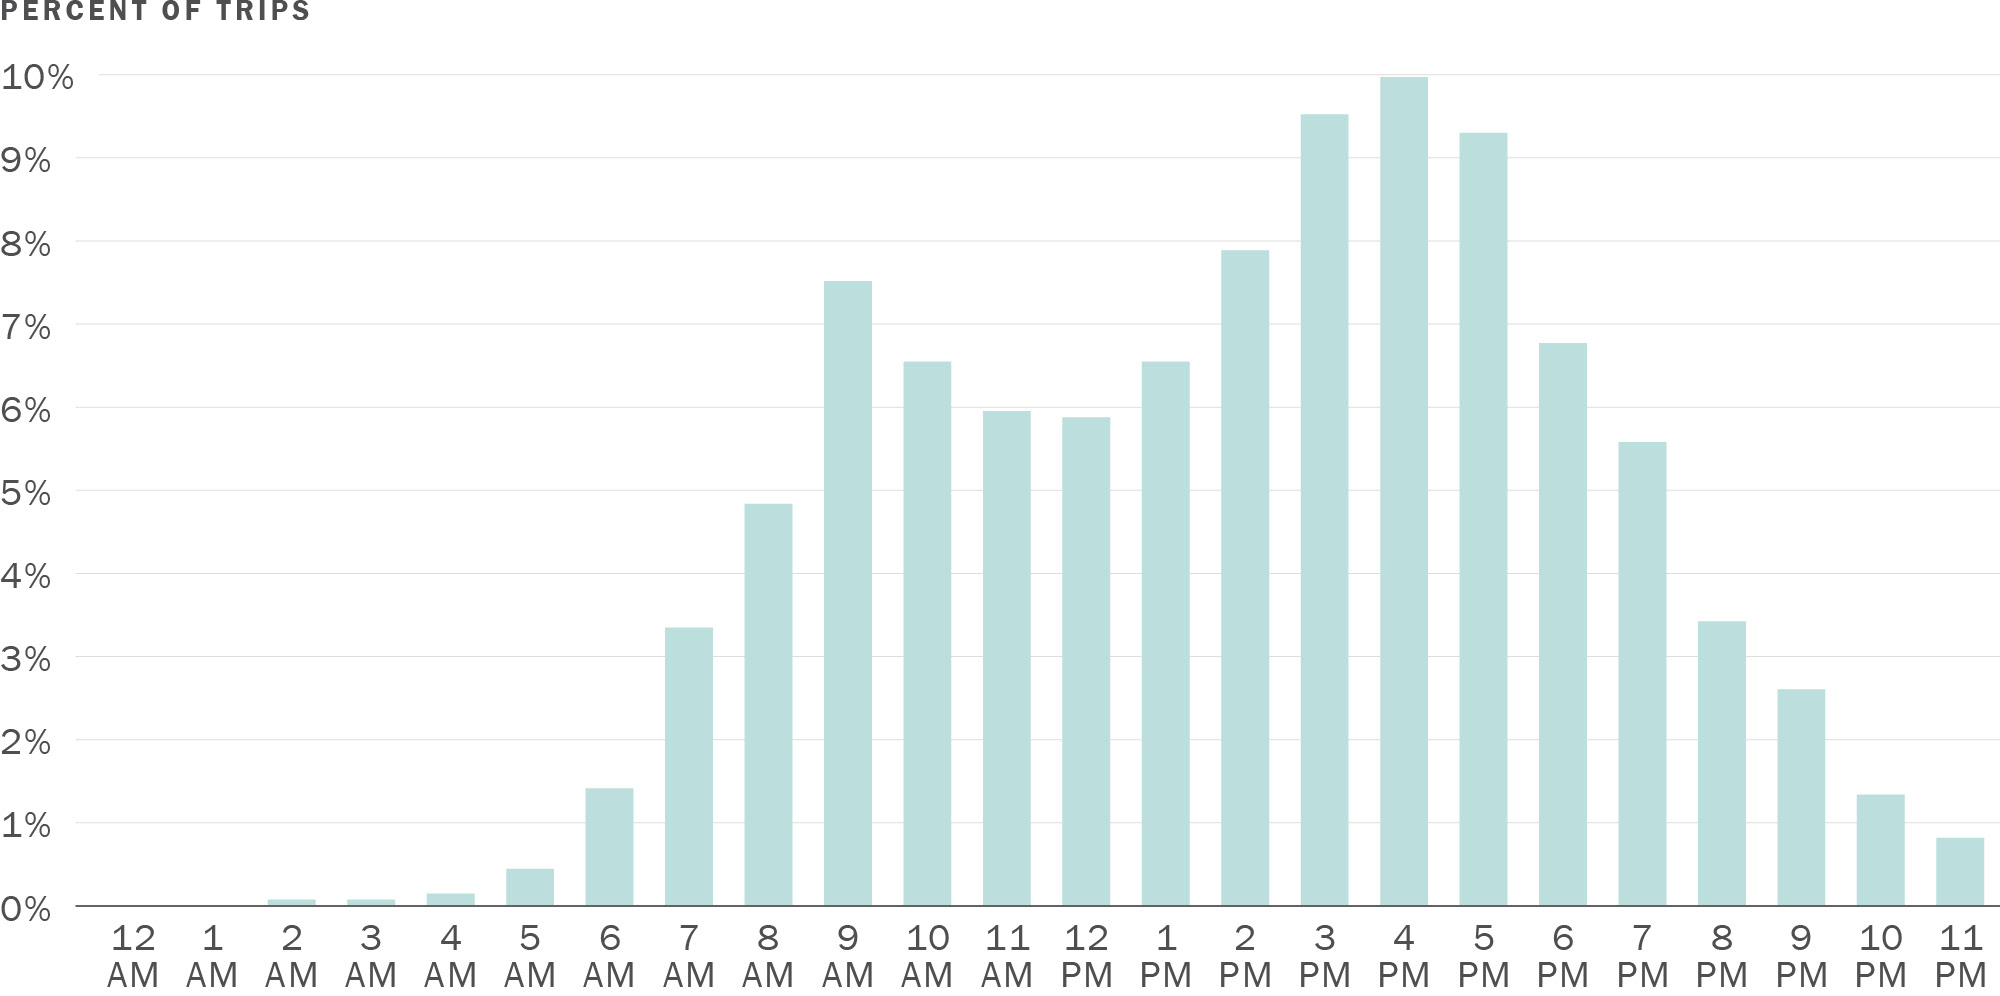
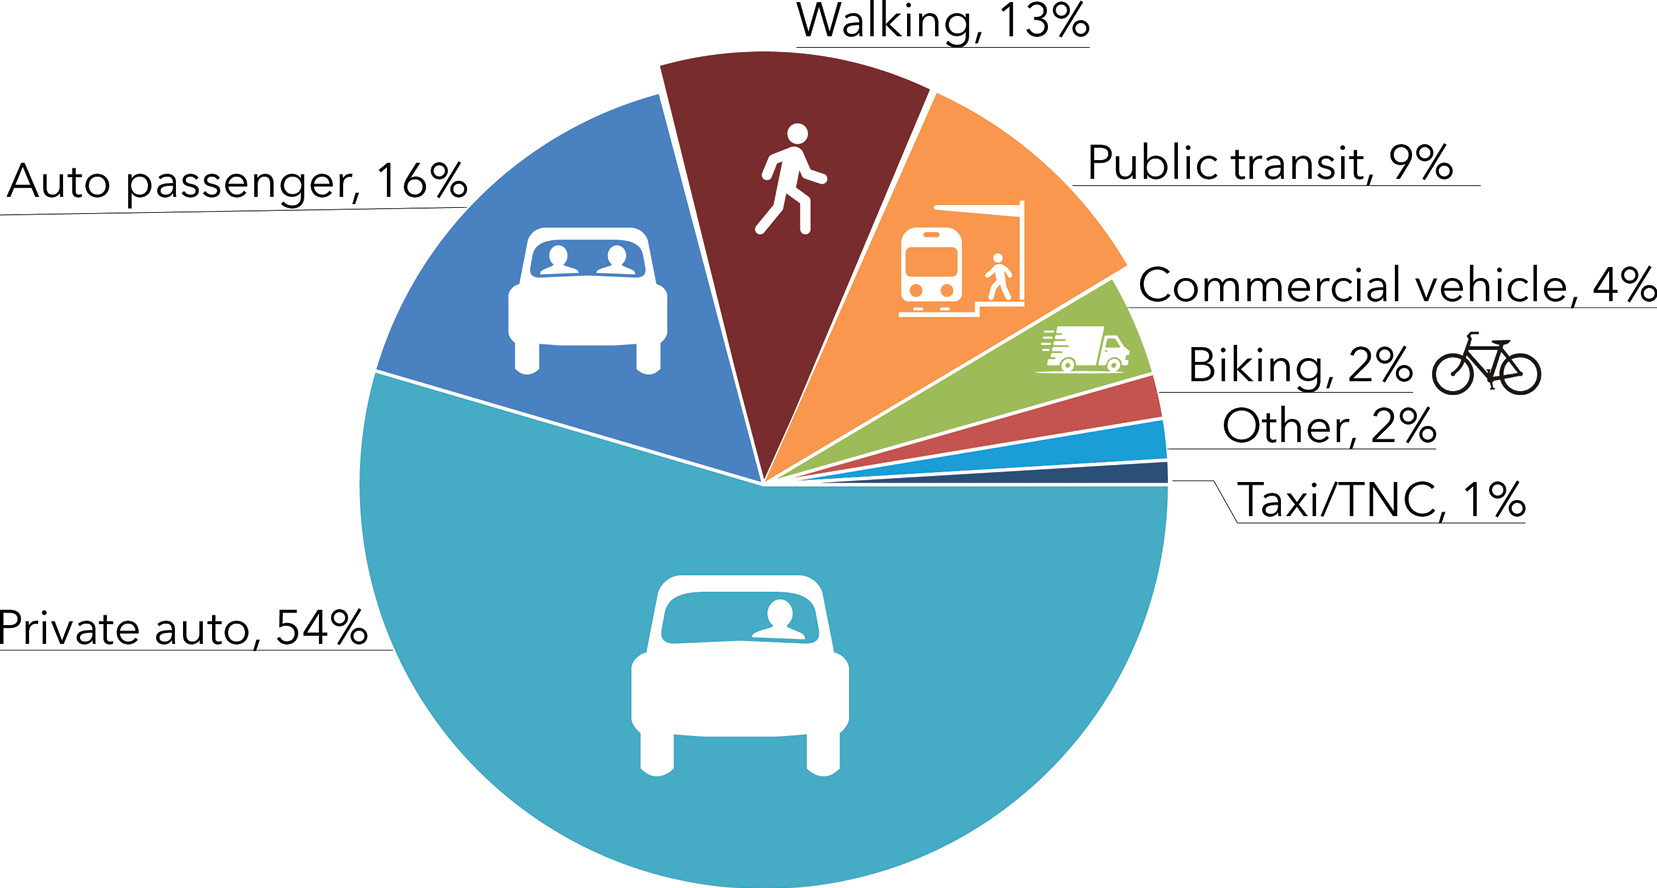
Replica also shows that peak walking and transit activity occurs between 4 p.m. and 5 p.m. when approximately 10% of daily walking and transit trips take place. Figure 4-3 shows the percentage of trips by mode and Figure 4-4 shows trip distribution by time of day.
The Team used Replica data to estimate potential gondola demand, as described in Section 5.
Download chart data (CSV)
Download chart data (CSV)
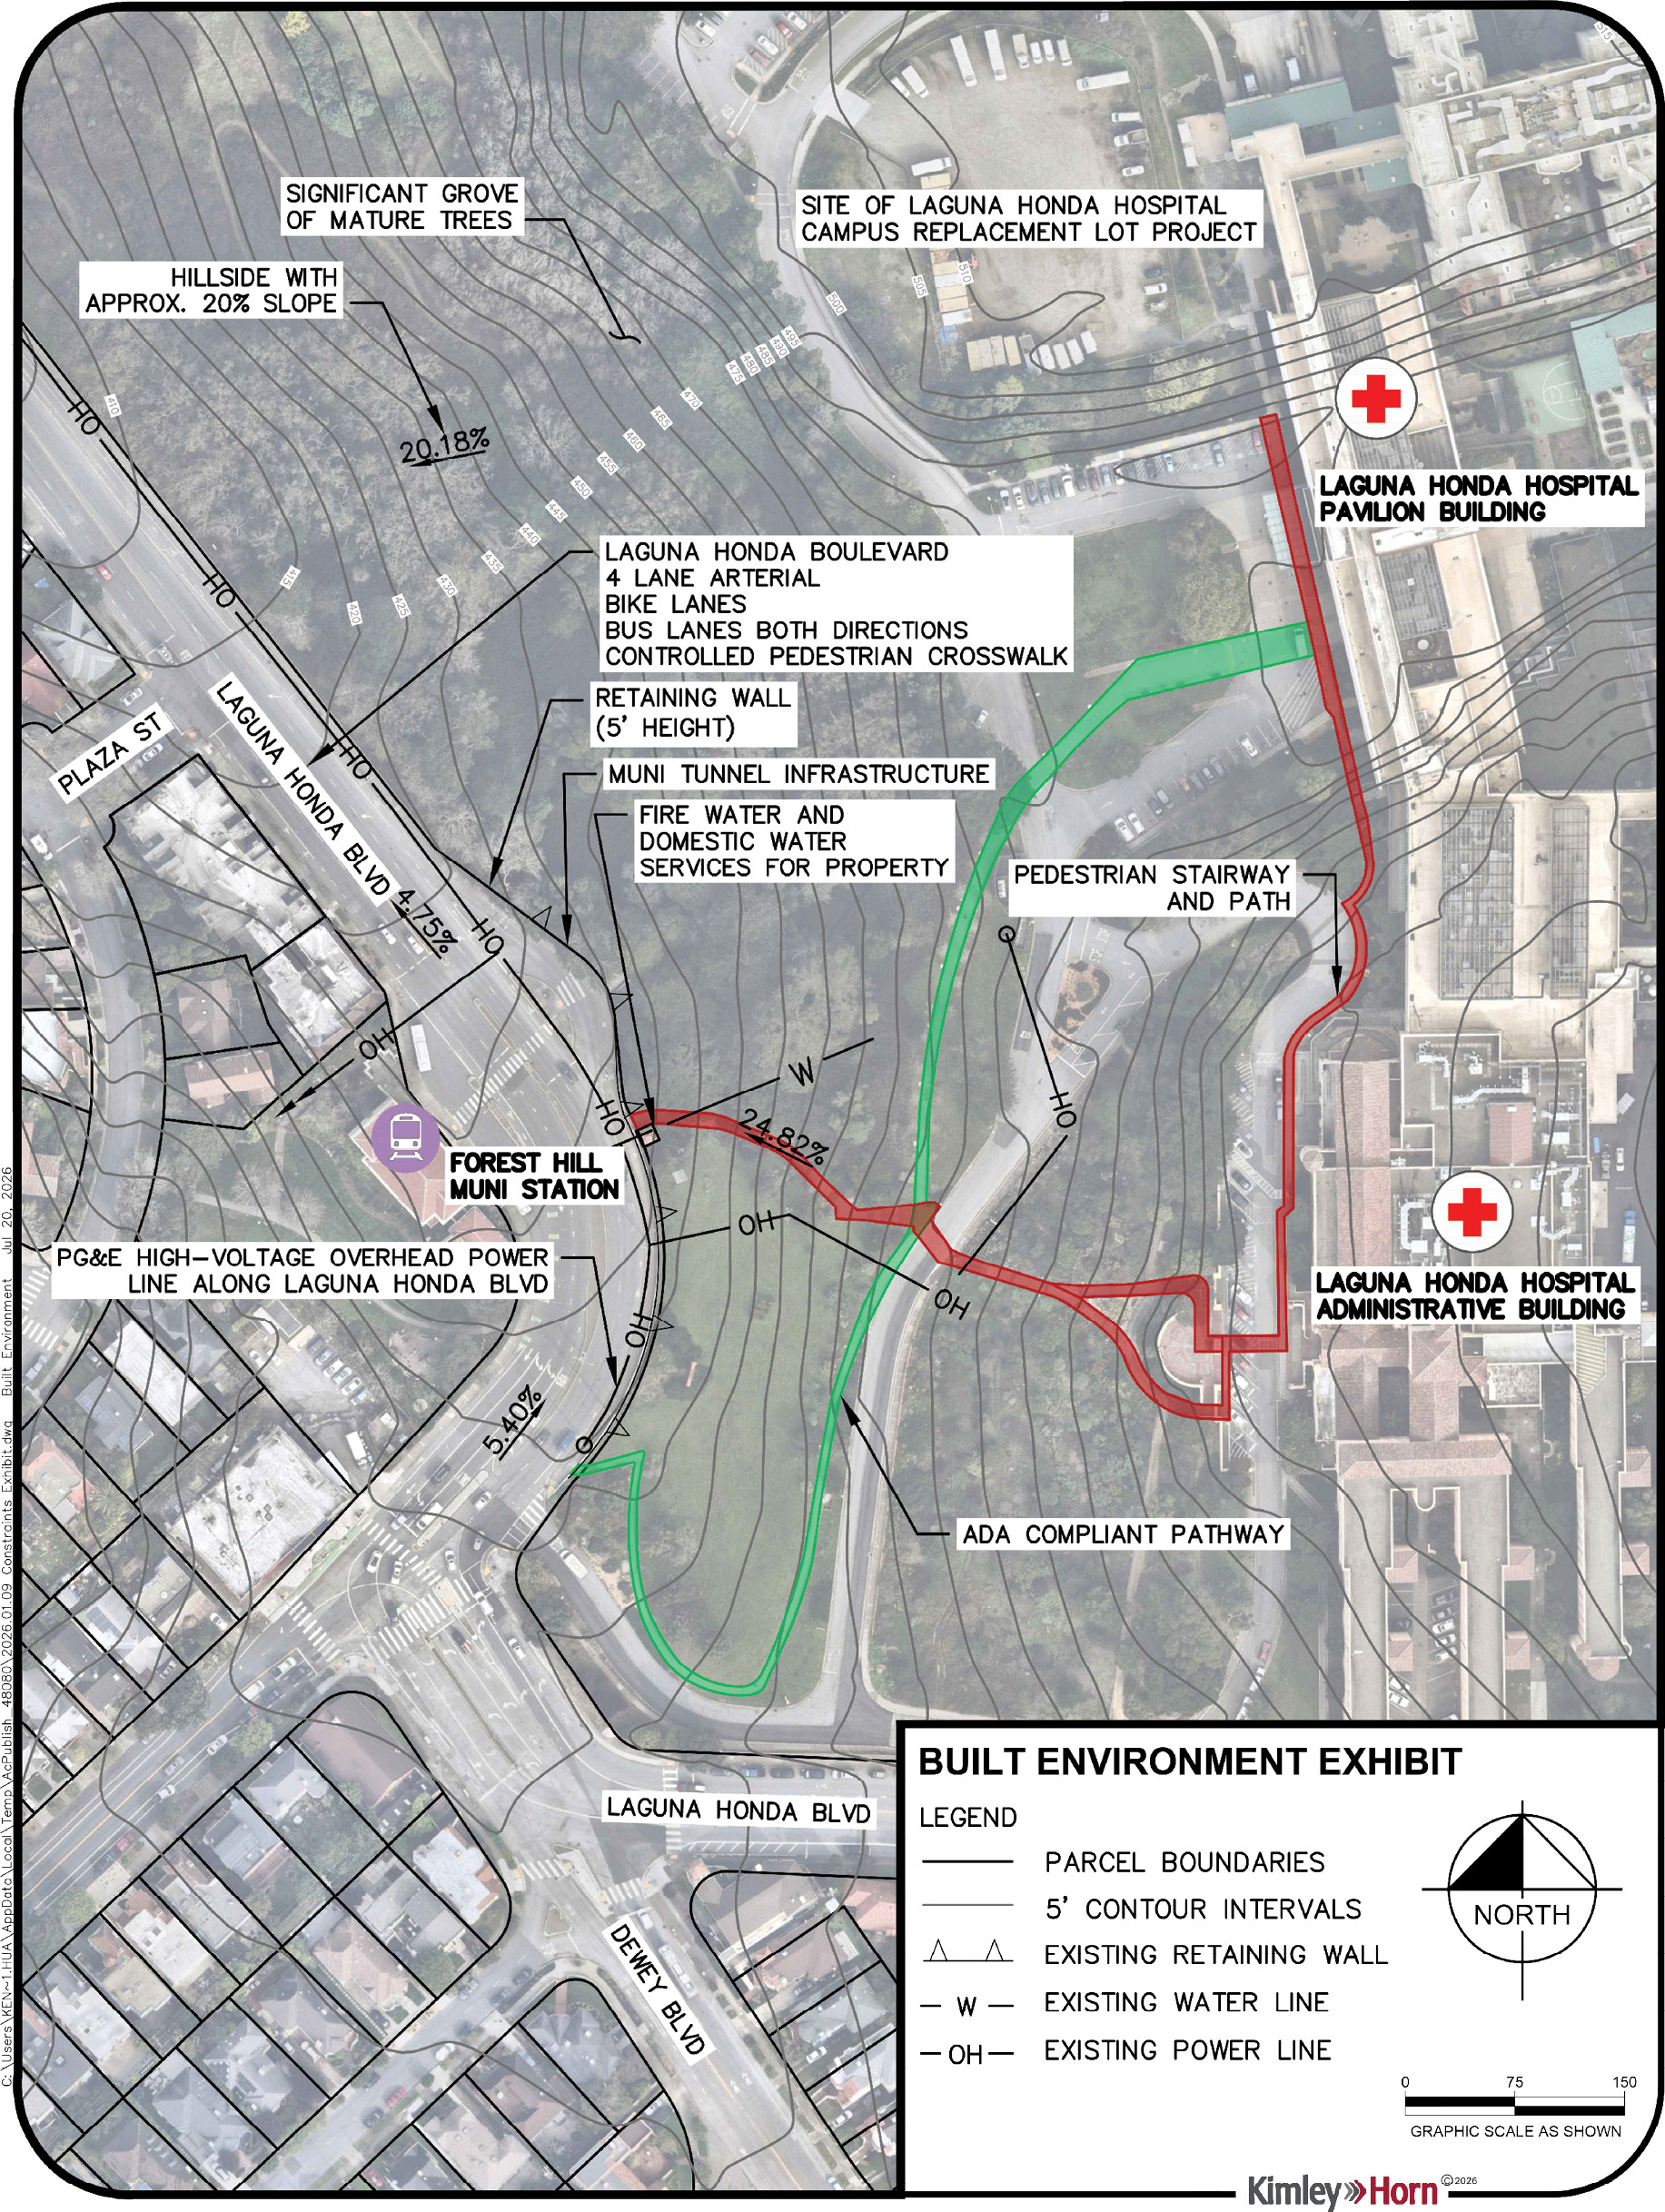
The Team created a site map to document key features of the Study Area based on the site visit and existing conditions analysis. Figure 4-5 shows both the ADA accessible route between the Station and Hospital (in green) and a more direct route with stairs (in red). The ADA accessible route is approximately 100 feet longer than the route with stairs.
Other key features shown on the map include:
The Team identified key physical, operational, and regulatory factors that could influence the feasibility of a gondola connection between the Station and Hospital. Building on the existing conditions analysis and site visit observations, the Team evaluated topography, utilities, roadway conditions, historic resources, and pedestrian access within the Study Area. This assessment identified locations where a gondola alignment may be feasible and areas where design, permitting, or cost challenges may arise.
The following maps and descriptions summarize the primary opportunities and constraints that informed the development and evaluation of the alignment alternatives.
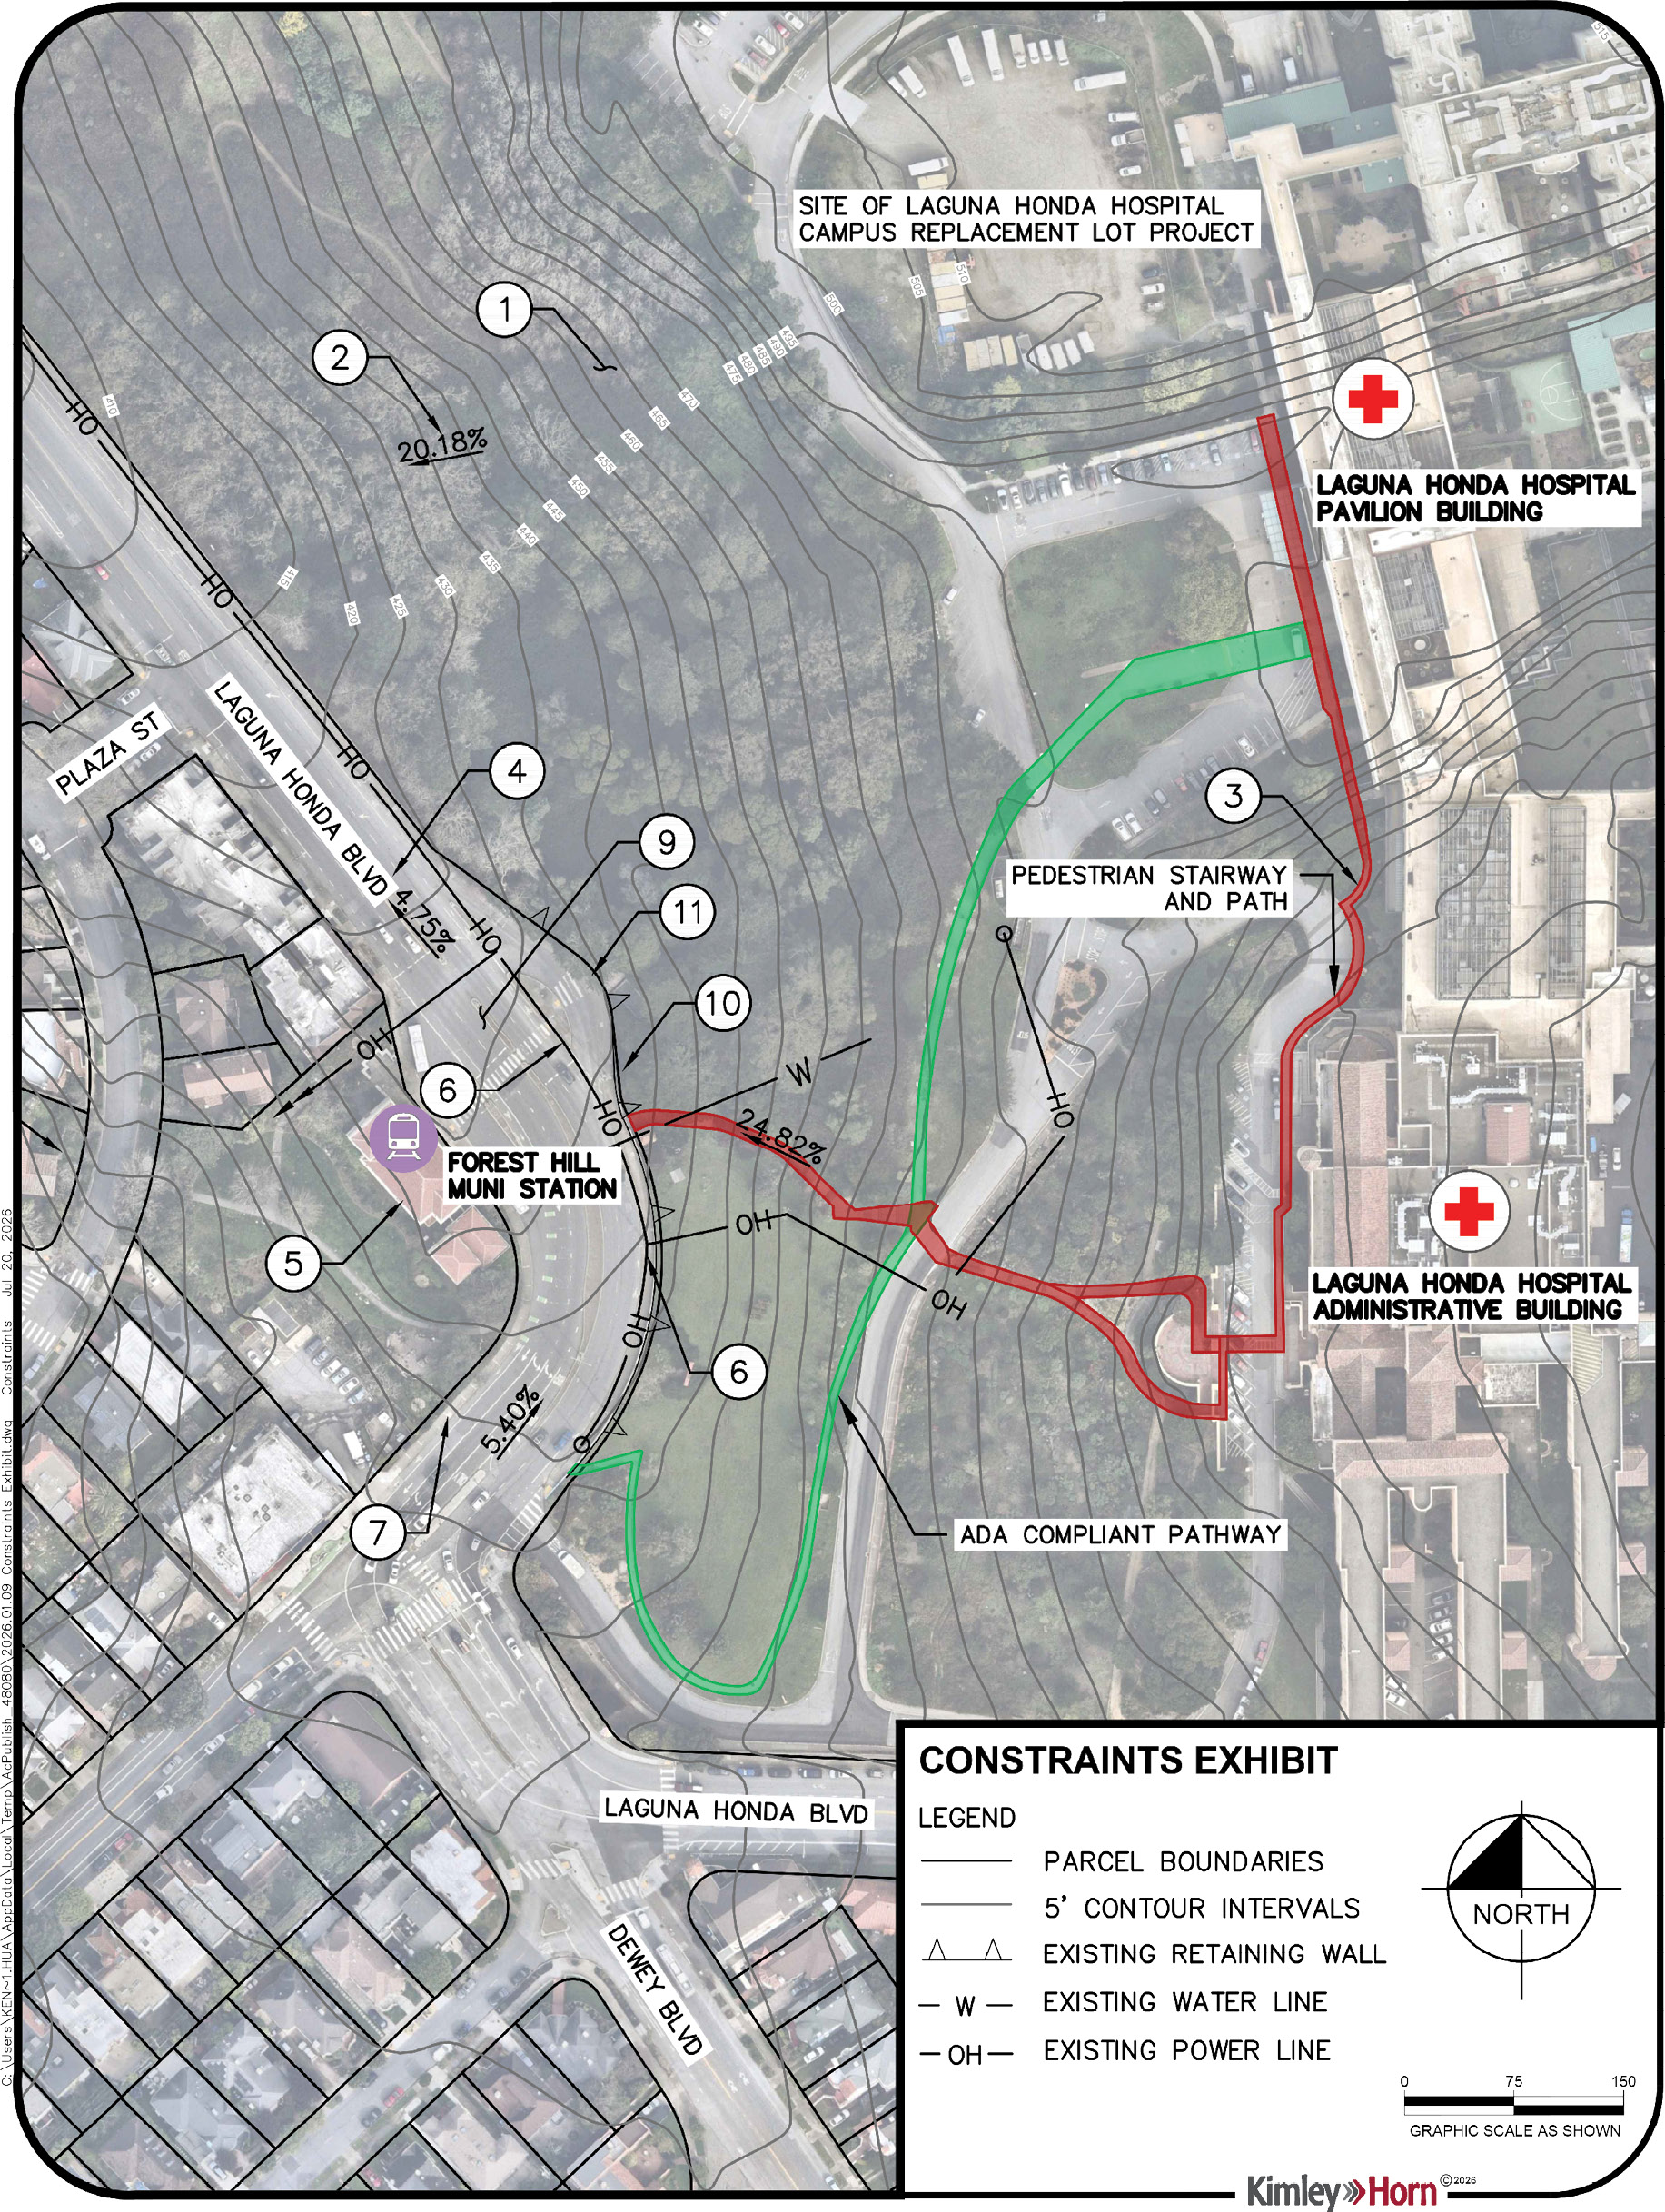
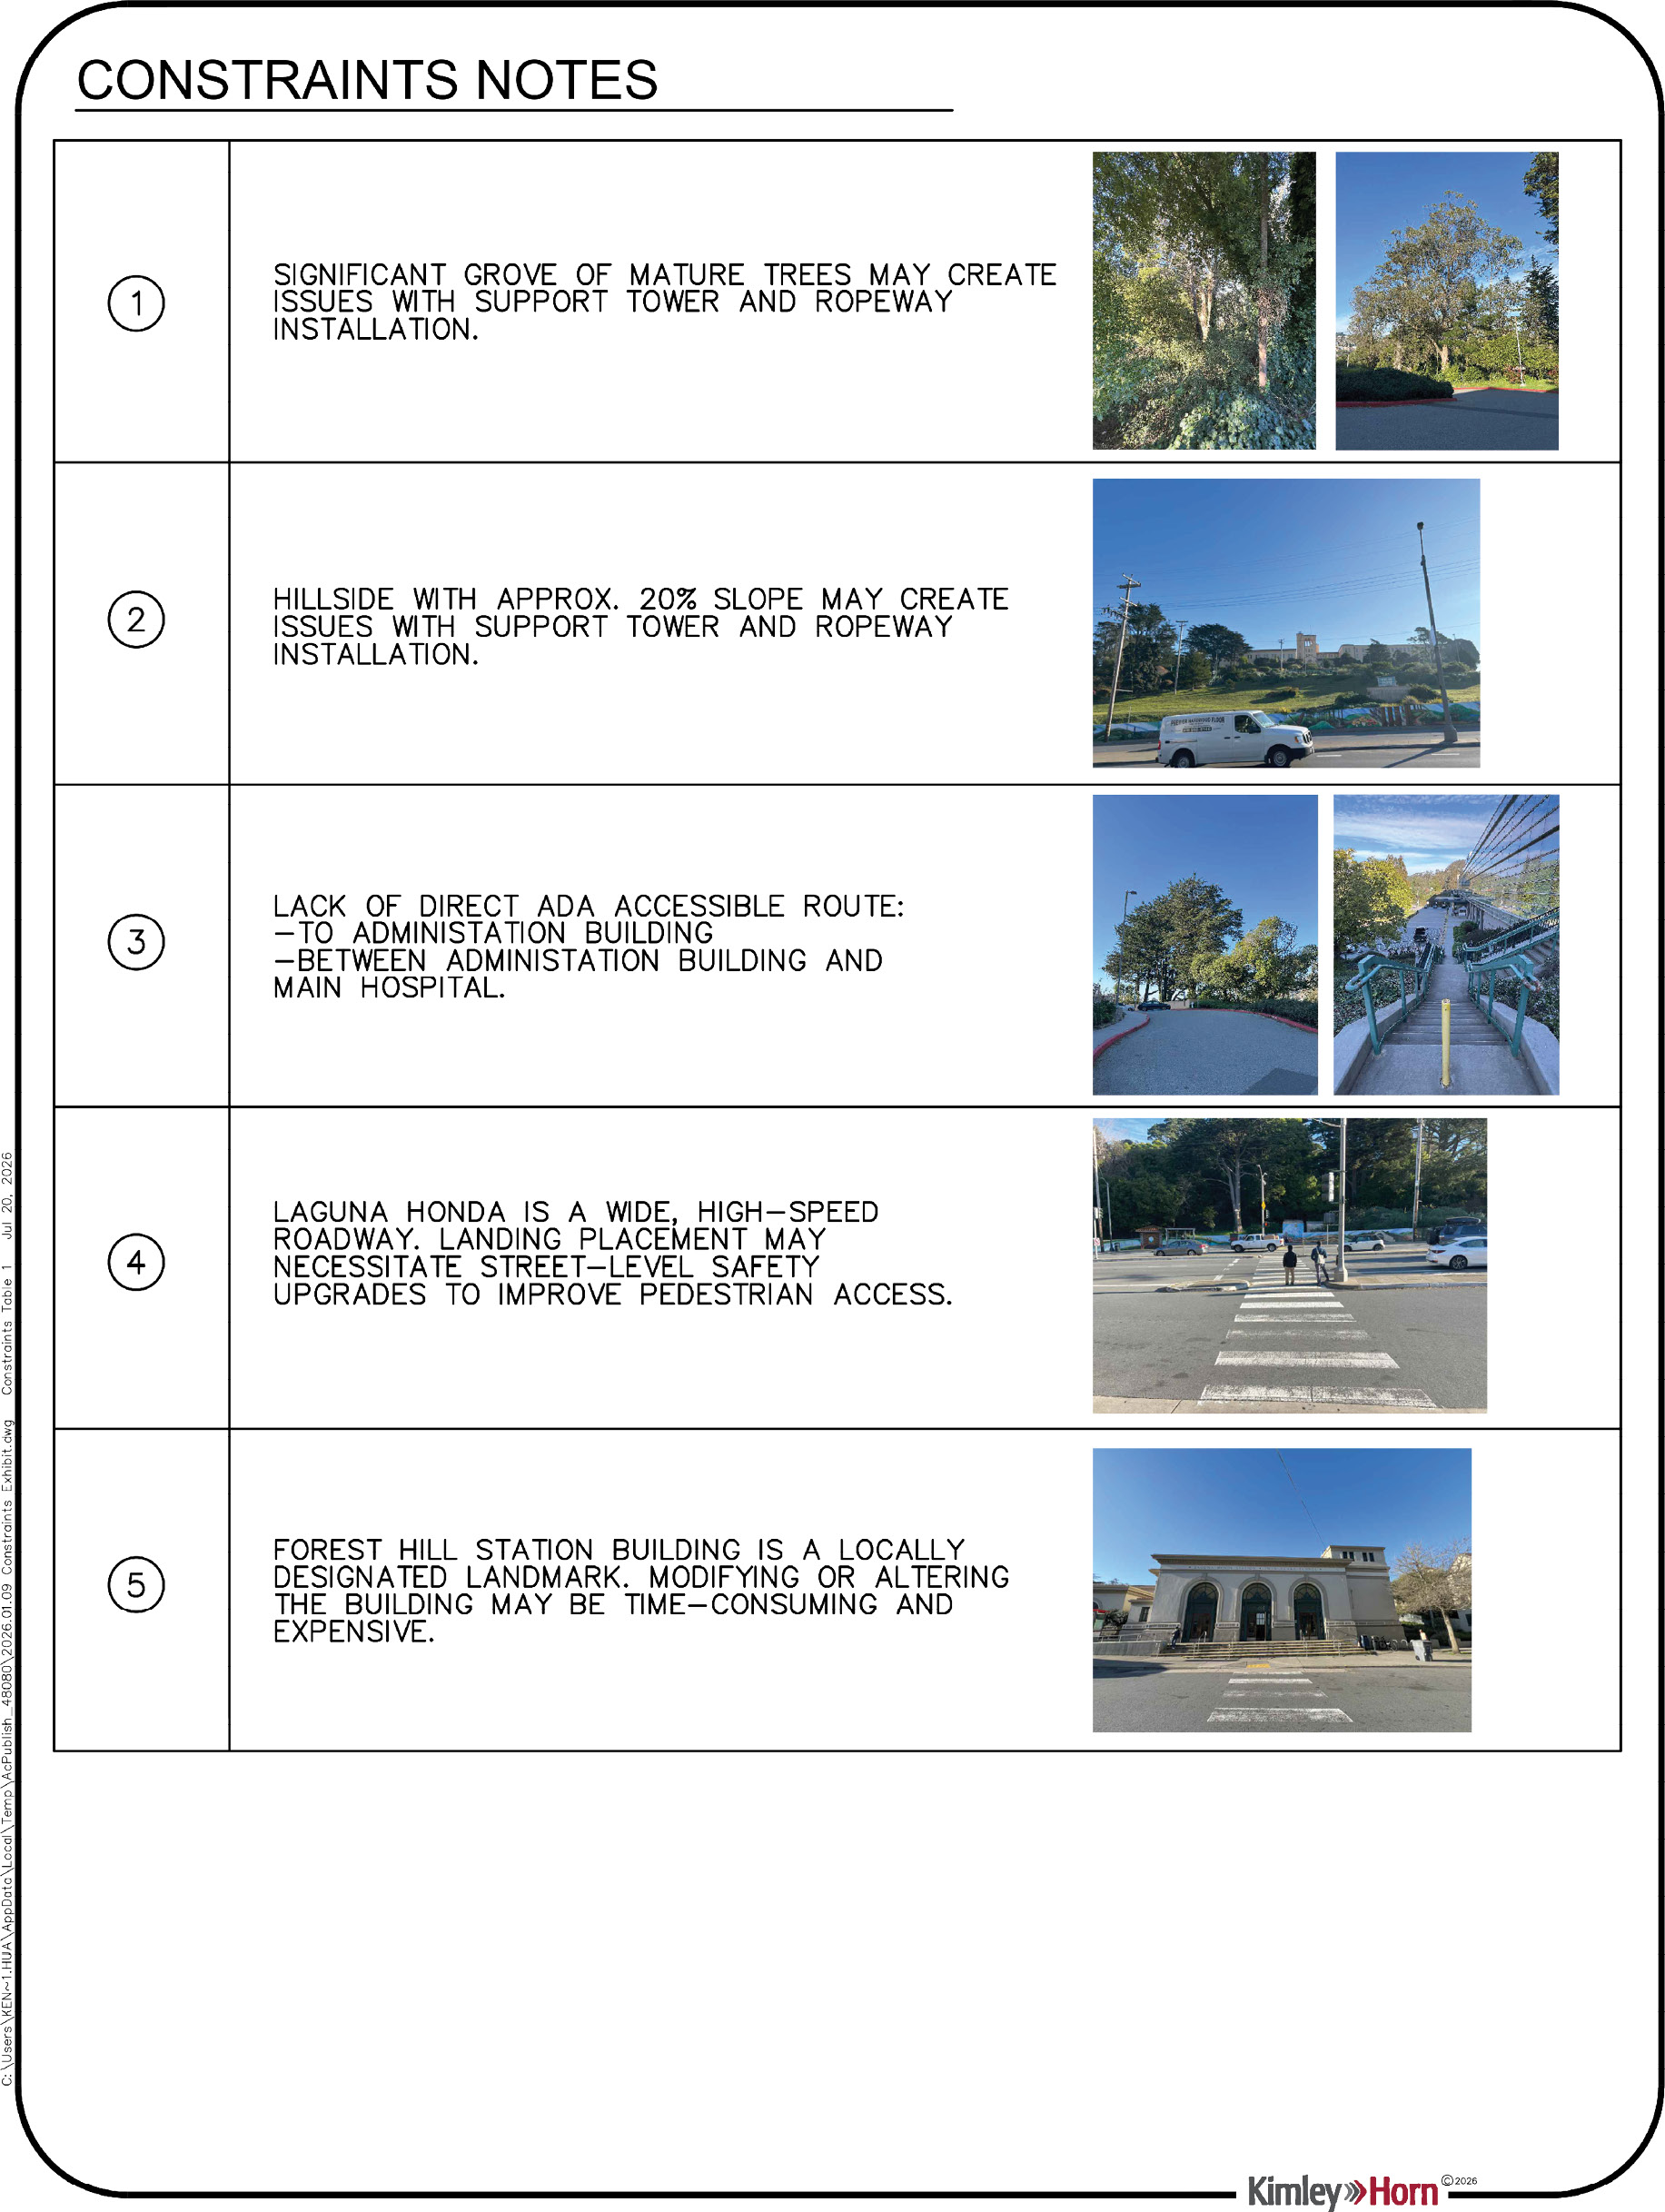
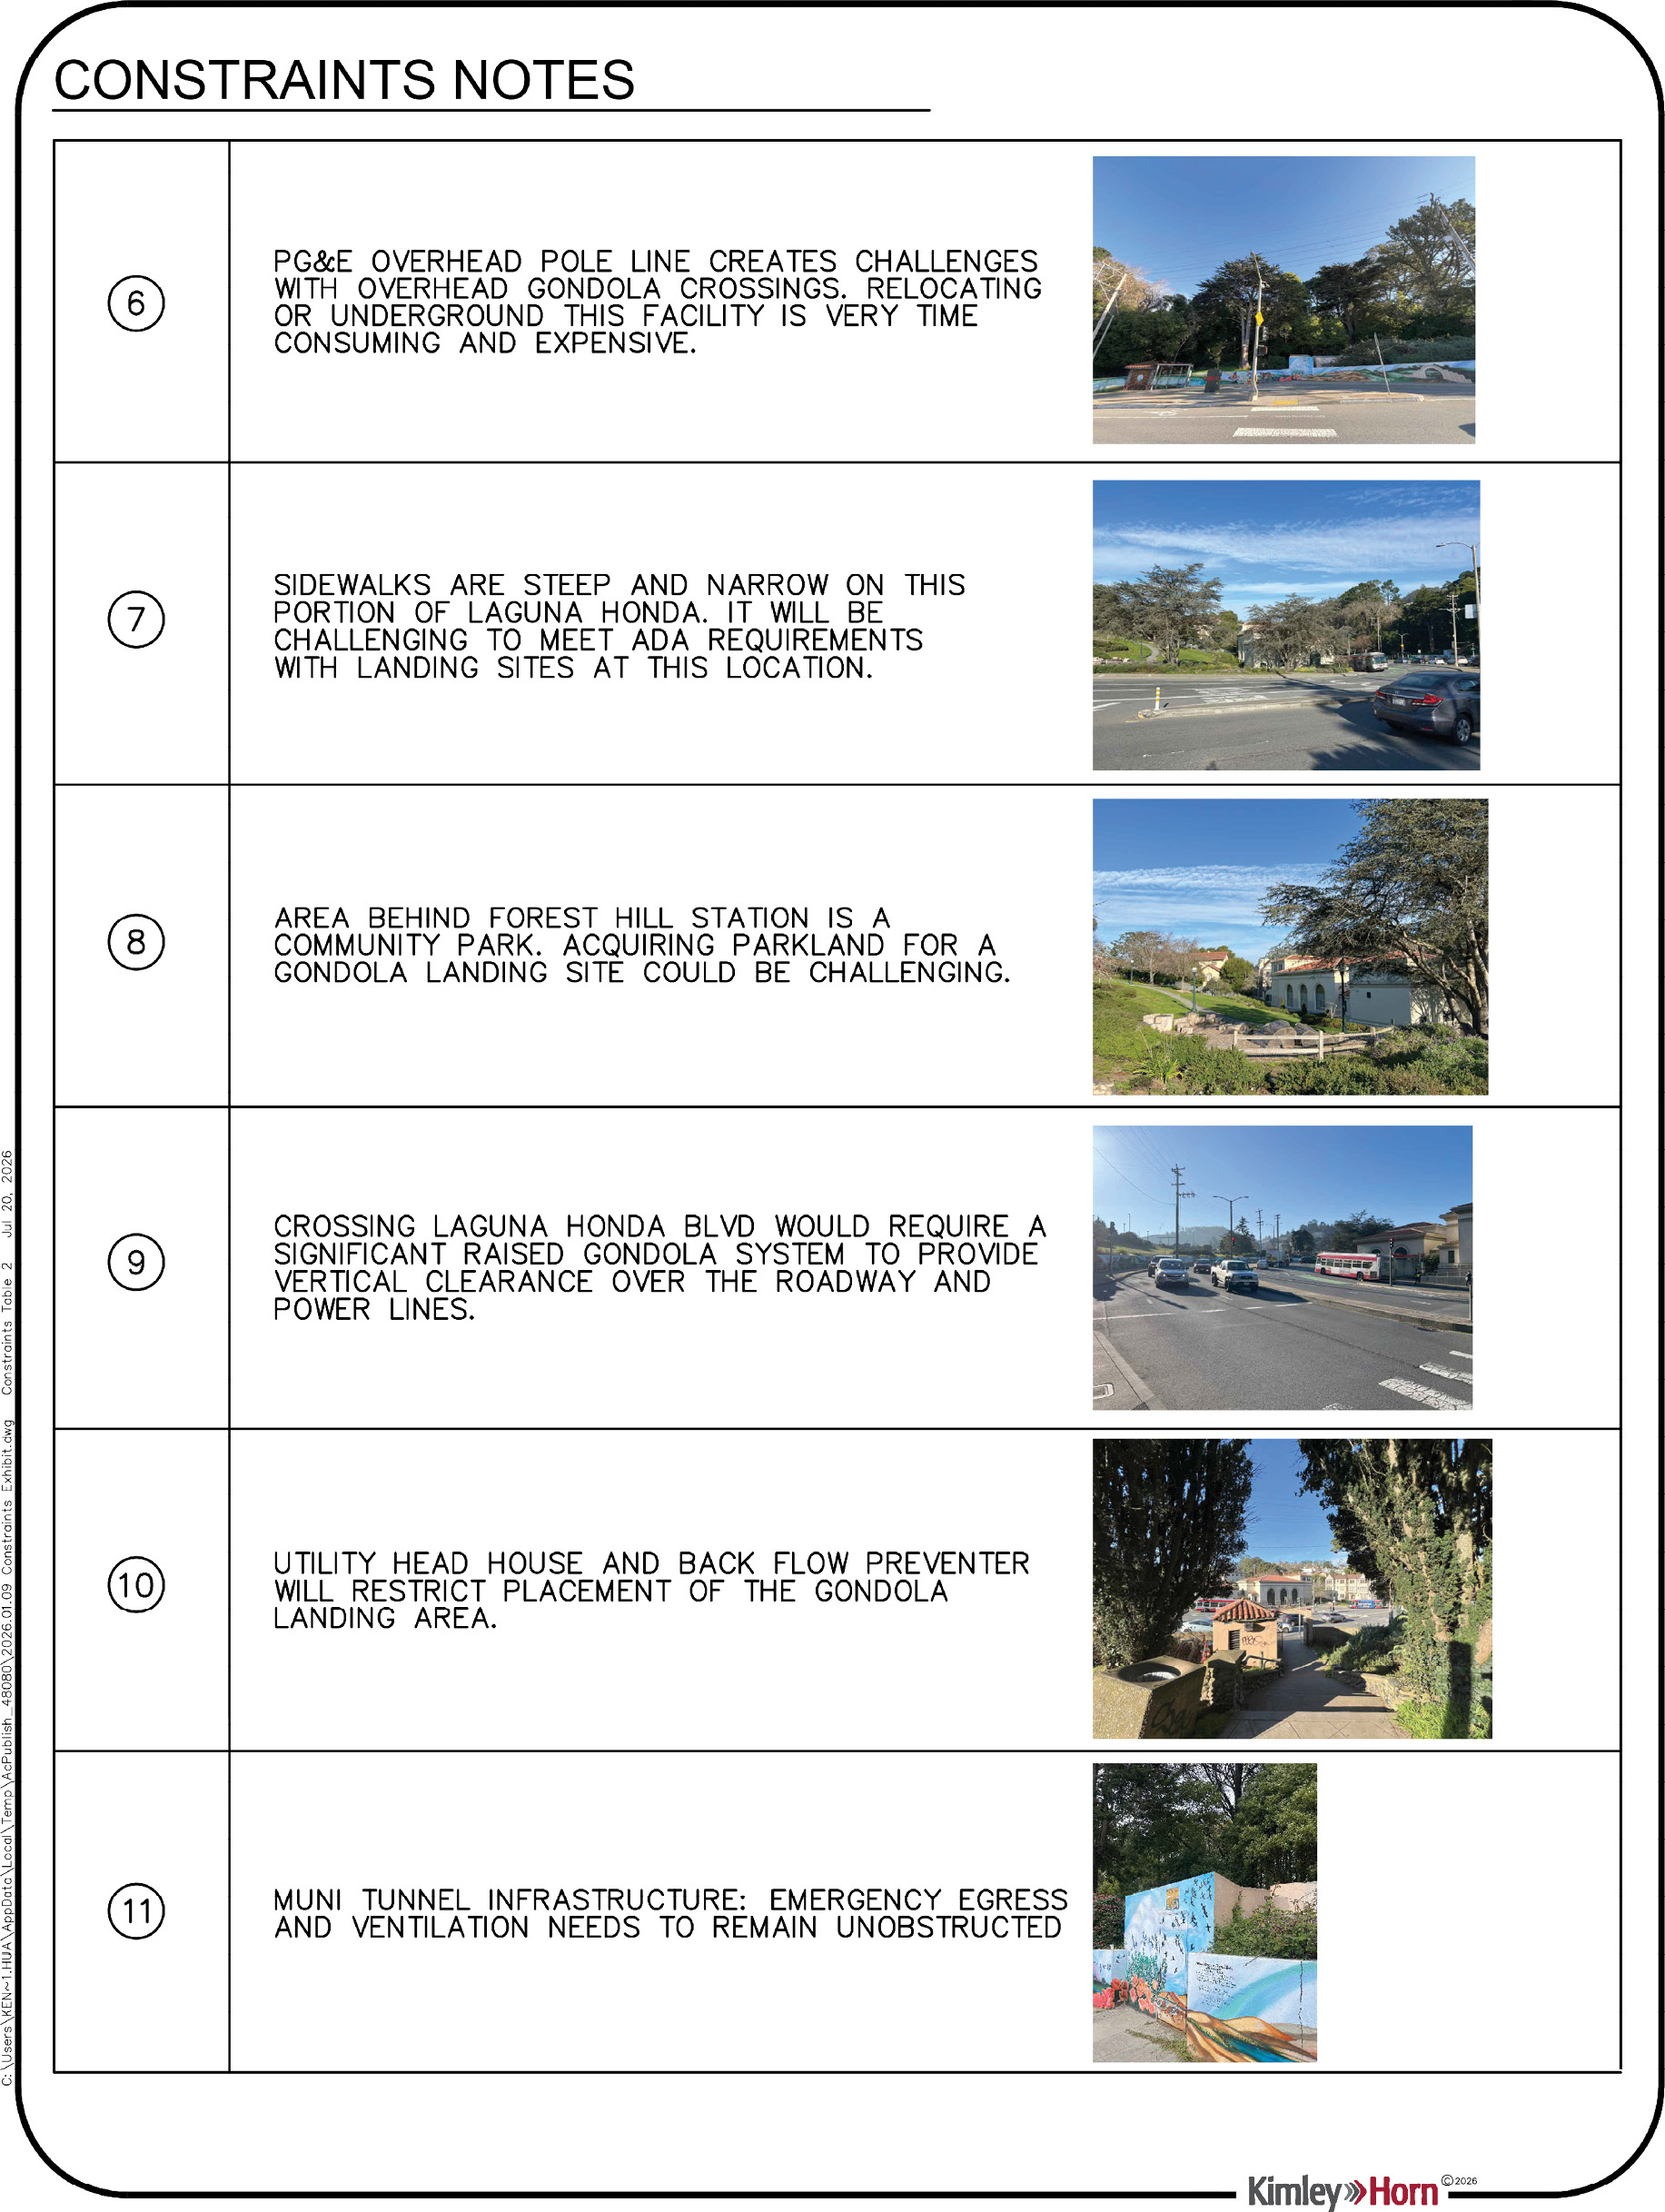
As part of the Study, the Team conducted a Market Assessment to evaluate potential demand for a gondola system. The Market Assessment considered both existing and future demand (2035 for sketch/feasibility planning purposes), with existing demand driven by current hospital staff, residents, and visitors and future demand driven by projected growth in Hospital staffing and planned developments. The Team identified the potential market for the gondola system to inform key decisions related to alignment alternatives, system capacity, and project viability.
Existing demand and future demand were estimated using different but complementary data sources. Existing demand was estimated using Replica travel demand data because it reflects observed travel patterns to and from the Study Area. Future demand was estimated using standard Institute of Transportation Engineers (ITE) trip generation methodologies because future land uses and staffing increases do not yet exist and therefore cannot be represented in Replica. The future demand analysis applies the same transit and walking travel patterns observed in Replica to the additional trips generated by planned development and staffing growth.
Using Replica data introduced in Section 4.2, the Team estimated both the number of vehicle and person trips and the number of people traveling to and from the Study Area by mode, where transit and walking trips accounted for 22% of all trips. The Team evaluated two scenarios — an existing demand scenario assumes that approximately 10% of transit and walking trips would use the gondola, reflecting current shuttle ridership patterns.
Based on this methodology, the Team estimated existing demand at approximately 134. This corresponds to the current weekday shuttle ridership.
Future demand was estimated by applying 10% and 20% shares to future transit/walking trips, where overall future travel demand was estimated by first identifying planned developments and staffing increases at the Hospital. The Institute of Transportation Engineers (ITE) Trip Generation Manual (11th Edition) was then used to estimate the additional daily trips generated by these future land uses. The analysis estimated approximately 2,768 additional daily trips associated with the Campus Replacement Lot Project and increased hospital staffing after removing land uses not expected to generate meaningful gondola demand. The transit and walking mode shares observed in Replica (9% transit and 13% walking) were applied to these additional trips, resulting in approximately 609 additional transit and walking trips. Finally, the gondola captures an estimated 61 to 122 trips per weekday. Adding these trips to the existing demand results in a future demand estimate of approximately 195 to 391 weekday gondola trips. Of these, approximately 10% (20 to 39 trips) would occur during the peak hour.
Using Hospital occupancy data provided by SFDPH, the Team distributed estimated gondola trips between the Pavilion and Administrative Buildings. This analysis indicated that approximately 70% of trips would serve the Pavilion Building and 30% would serve the Administrative Building, reflecting the distribution of residents and staff across the Hospital campus.
The demand estimation process is summarized below and the results are provided in Table 5-1. For full analysis description and results, the Market Assessment is included in Appendix B.
This Section describes the alignment alternatives considered for a potential gondola system between the Station and the Hospital. The Team developed six alternatives and evaluated them based on key considerations, including utility conflicts, ability to serve primary demand, site constraints, environmental impacts, and access and circulation. Table 6-1 summarizes how each alternative performs across these criteria and informs the identification of the most feasible option.
In Alternative 1A, shown in Figure 6-1, the proposed launch point for the gondola is adjacent to the Station and the terminus is located at the Hospital Administrative Building. This alternative also provides the opportunity to extend to the Hospital Pavilion Building.
Key considerations include:
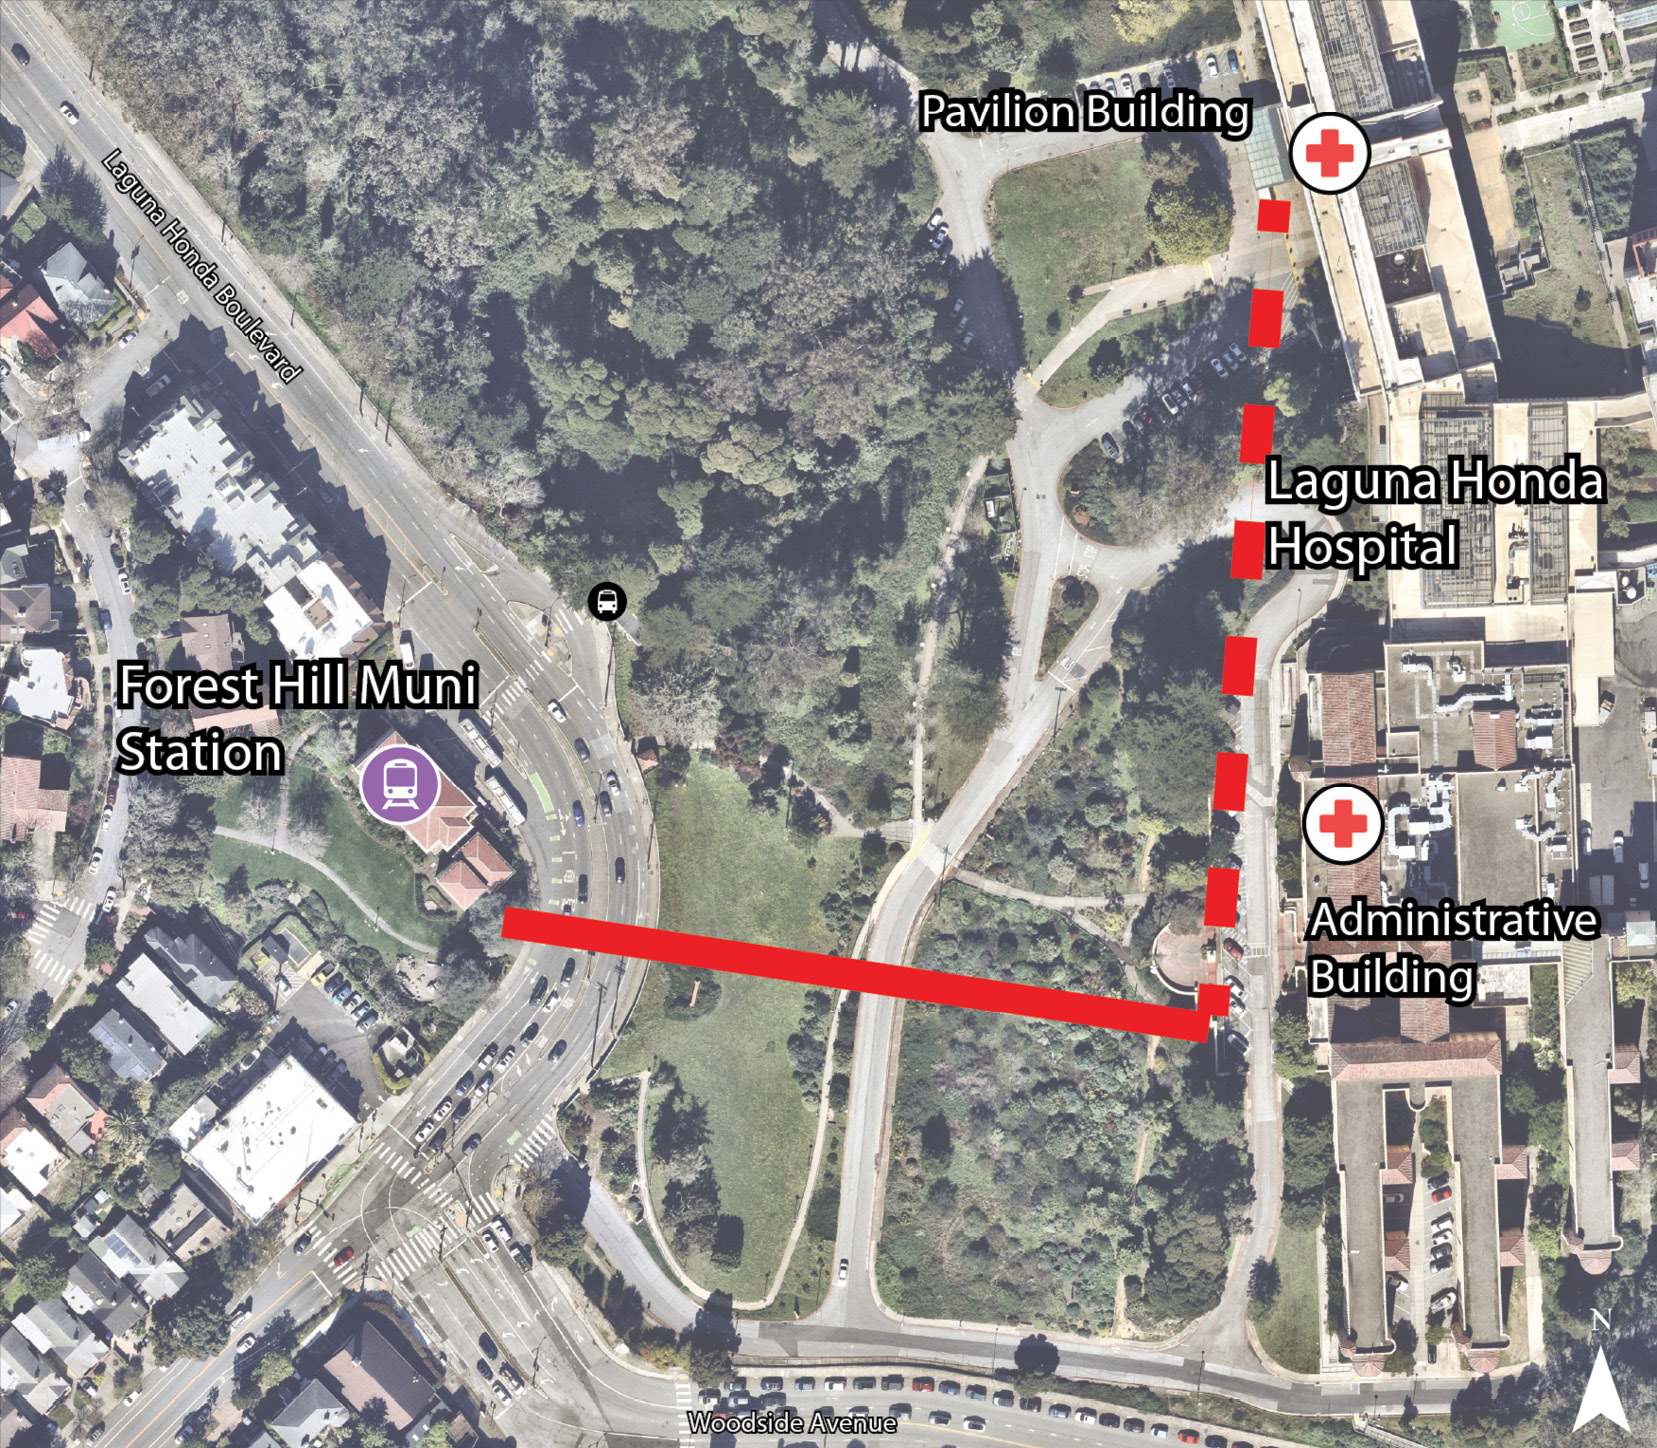
Alternative 1B, shown in Figure 6-2, is similar to Alternative 1A, however the gondola directly serves the Hospital Pavilion Building, for which there is more demand.
Key considerations include:
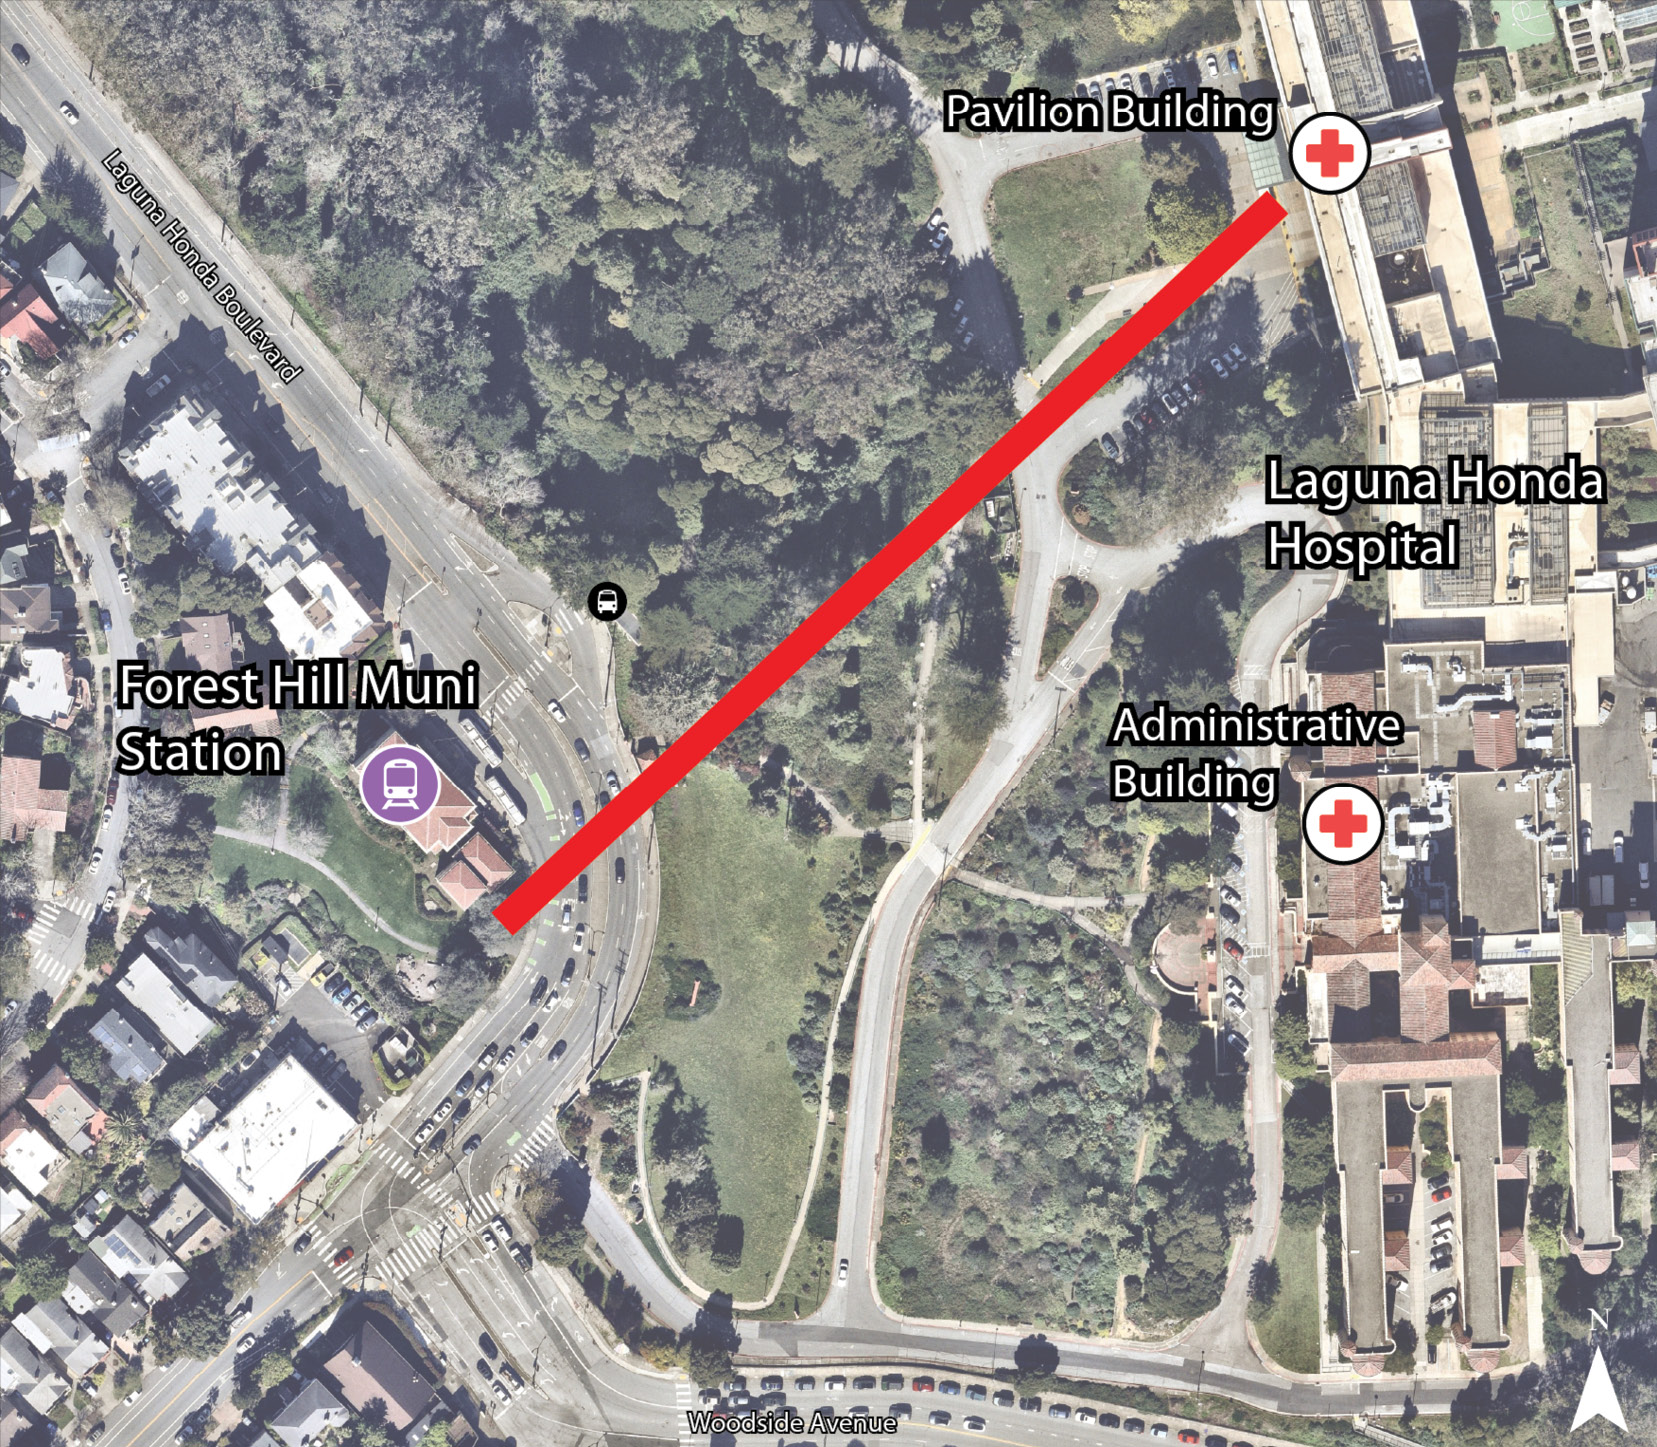
Alternative 2A, shown in Figure 6-3, has a launch point near Woodside Avenue, across Laguna Honda Boulevard from the Station. With this launch point, utility impacts adjacent to the Station are avoided, and access across Laguna Honda Boulevard is facilitated with an overhead bridge connecting the Station to the launch point. The terminus for this alternative is the Hospital Administrative Building, and like Alternative 1A, this alternative provides the opportunity to extend to the Hospital Pavilion Building.
Key considerations include:
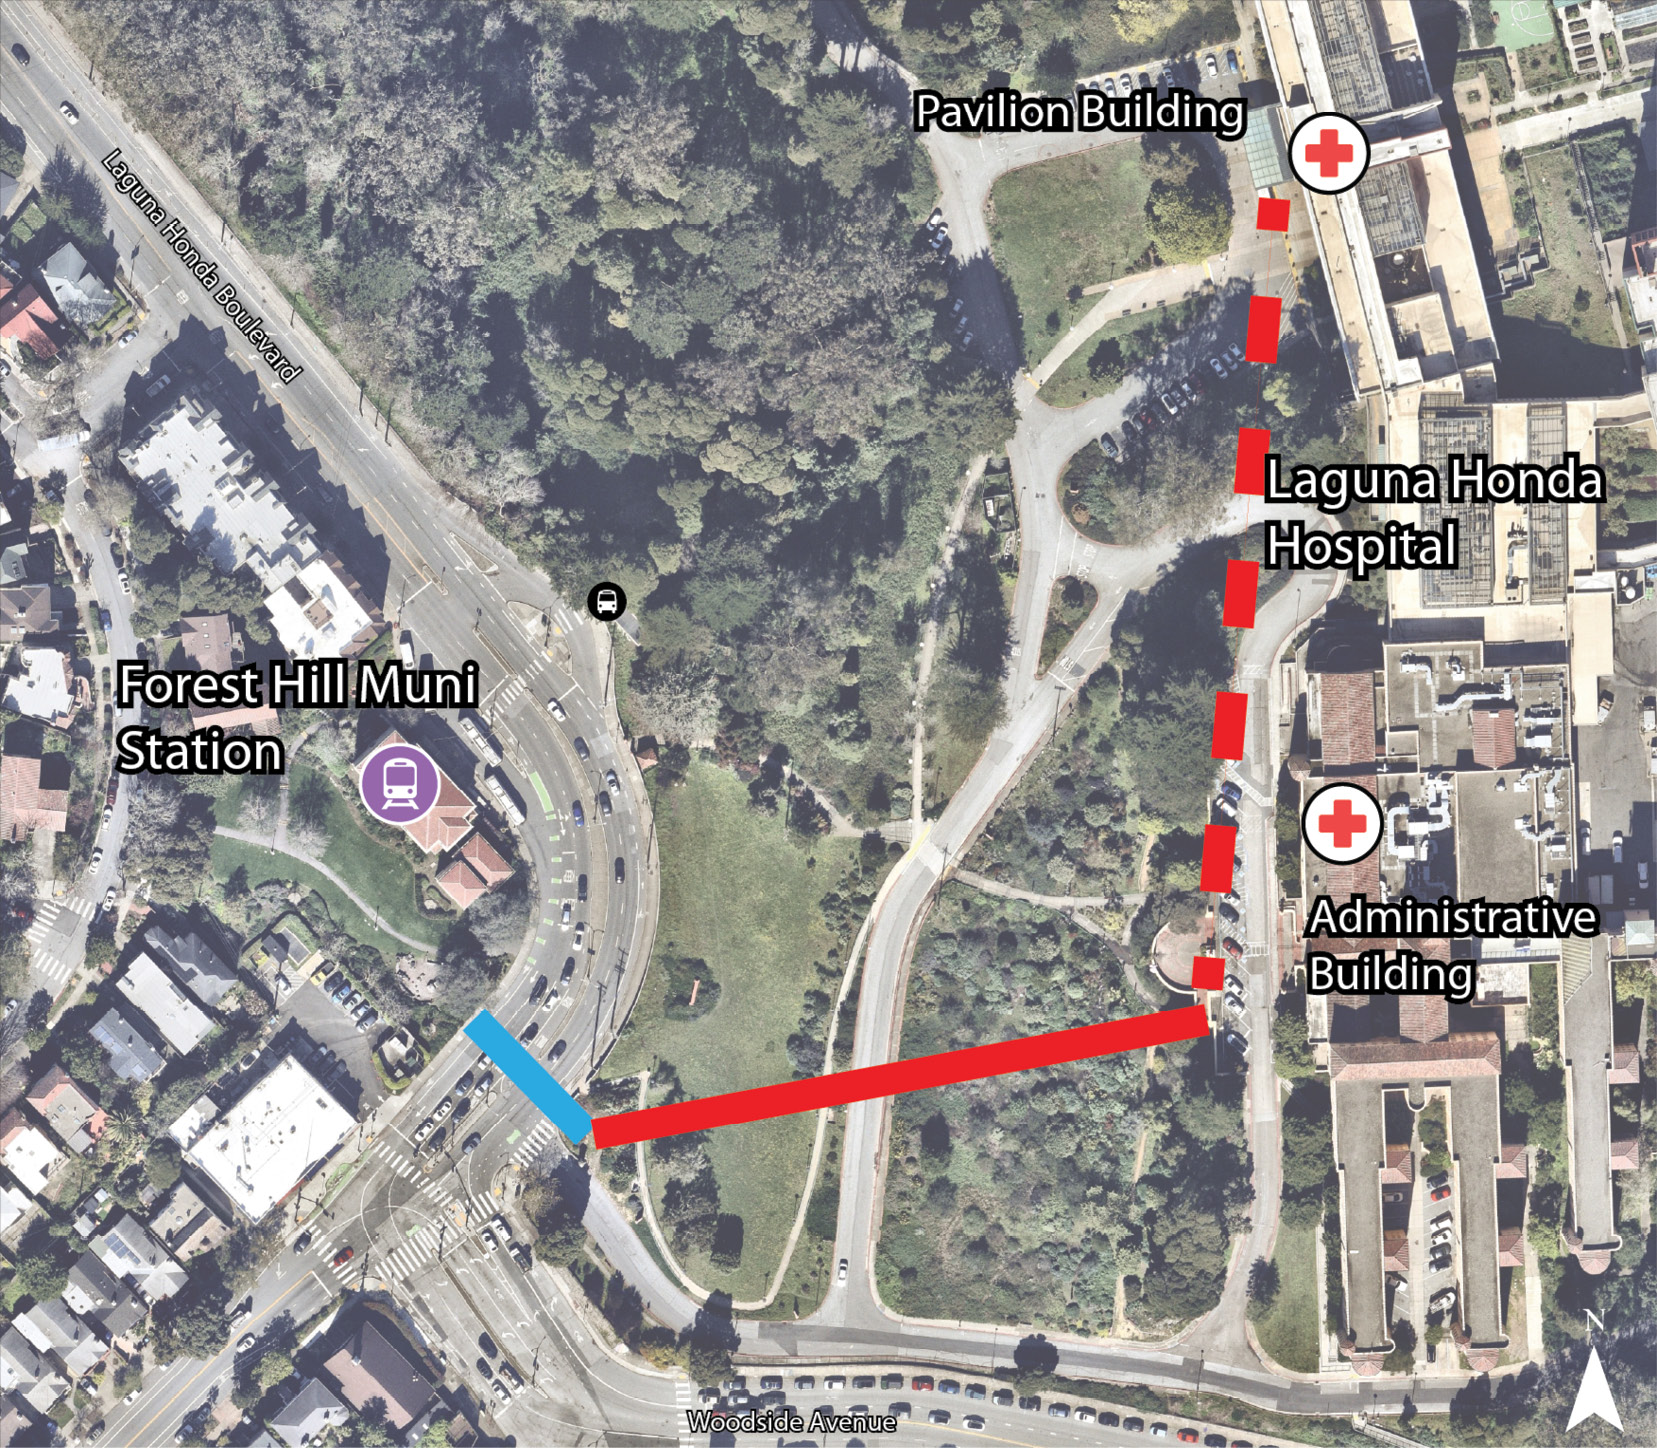
The launch point for Alternative 2B, shown in Figure 6-4, is at the Hospital Trail Access Point across Laguna Honda Boulevard from the Station. This launch point avoids utility impacts but requires pedestrians to use the existing crossing in front of the Station to cross Laguna Honda Boulevard. Like other alternatives, Alternative 2B serves the Hospital Administrative Building, for which there is less demand, but provides the opportunity to extend to the Hospital Pavilion Building.
Key considerations include:
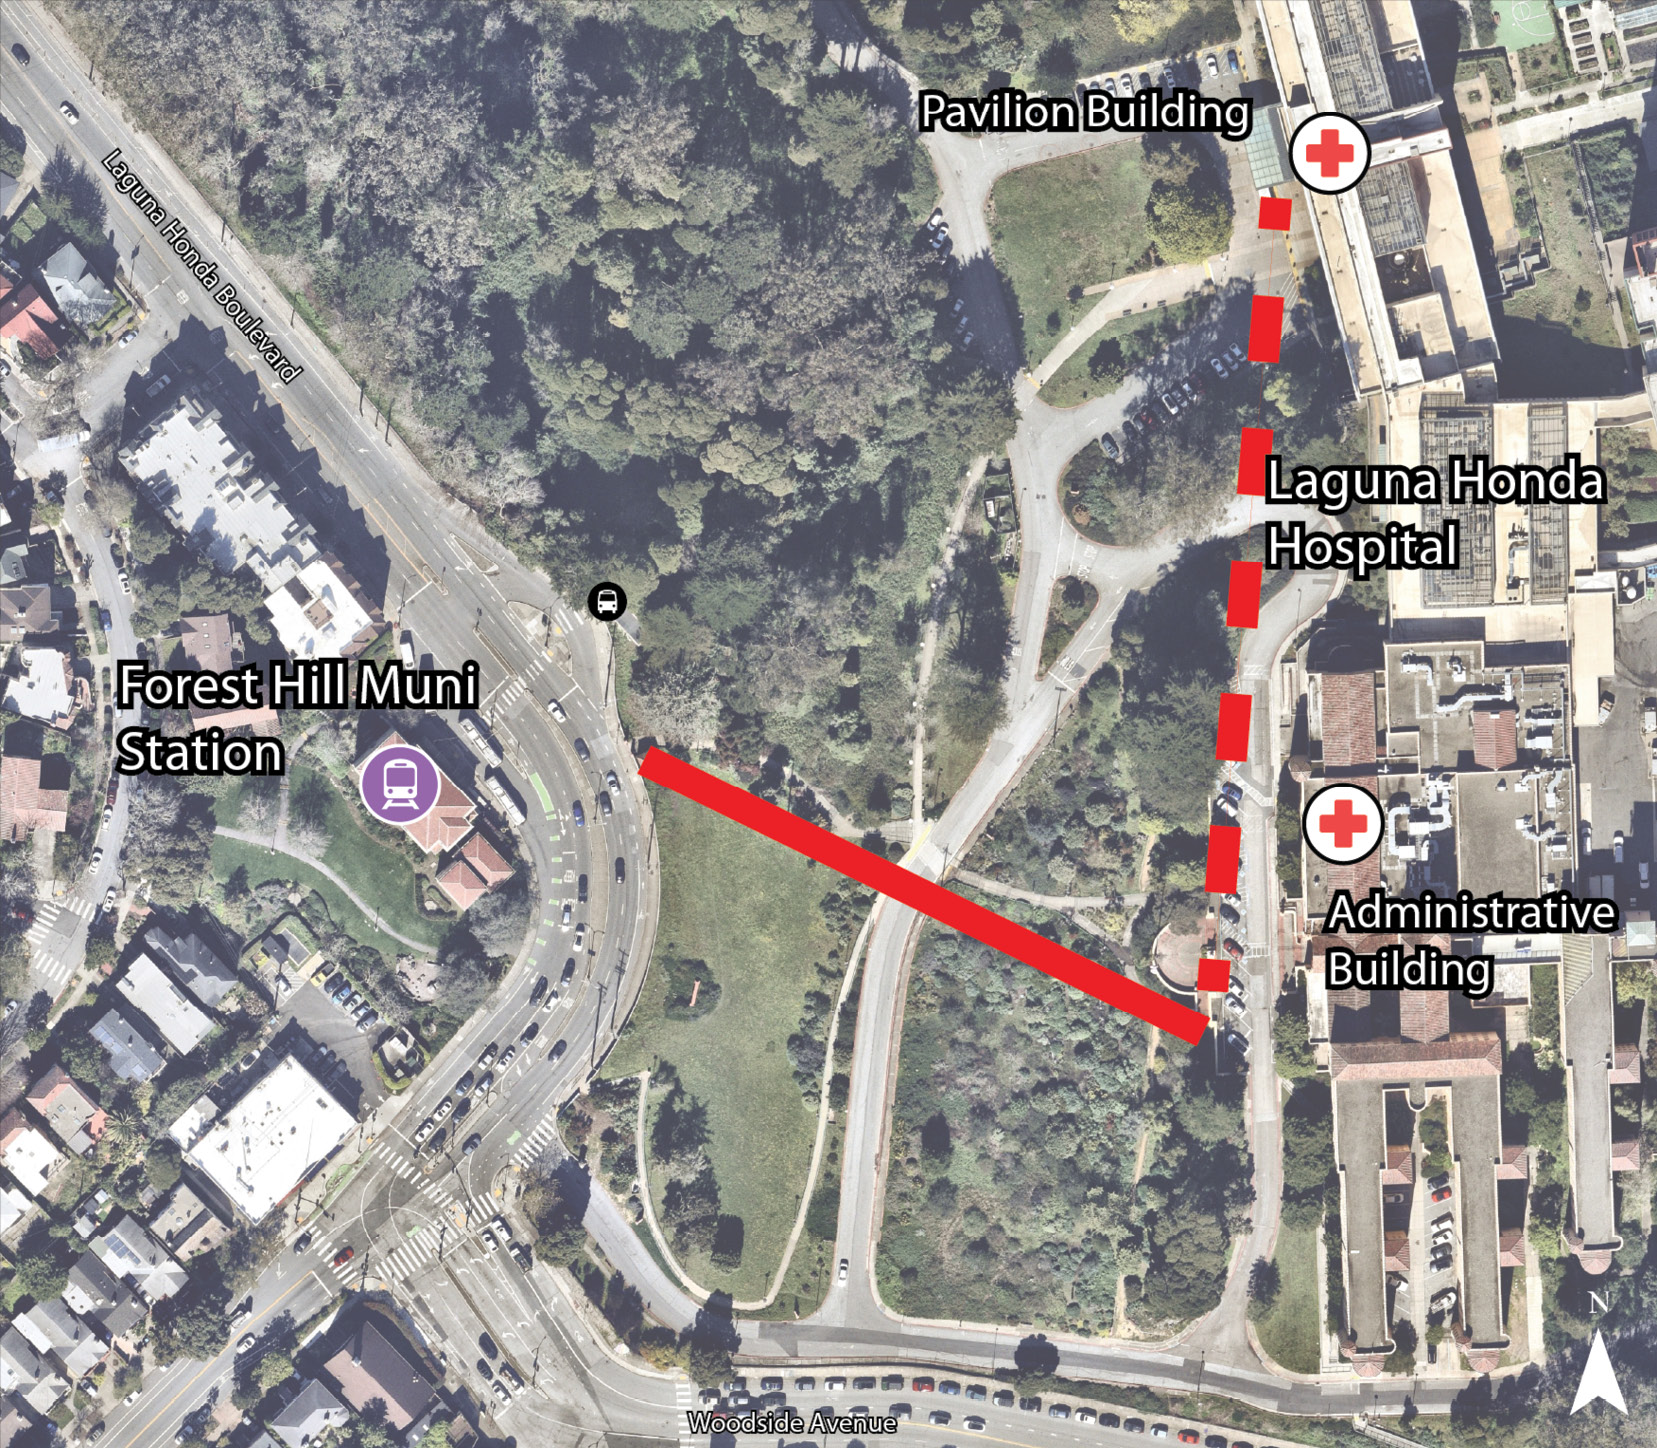
Alternative 2C, shown in Figure 6-5, is similar to Alternative 2B, however the gondola directly serves the Hospital Pavilion Building, for which there is more demand. Due to the similar launch point as Alternative 2B, across Laguna Honda Boulevard from the Station, this alternative avoids utility conflicts but requires pedestrians to cross Laguna Honda Boulevard via the existing crosswalk in front of the Station.
Key considerations include:
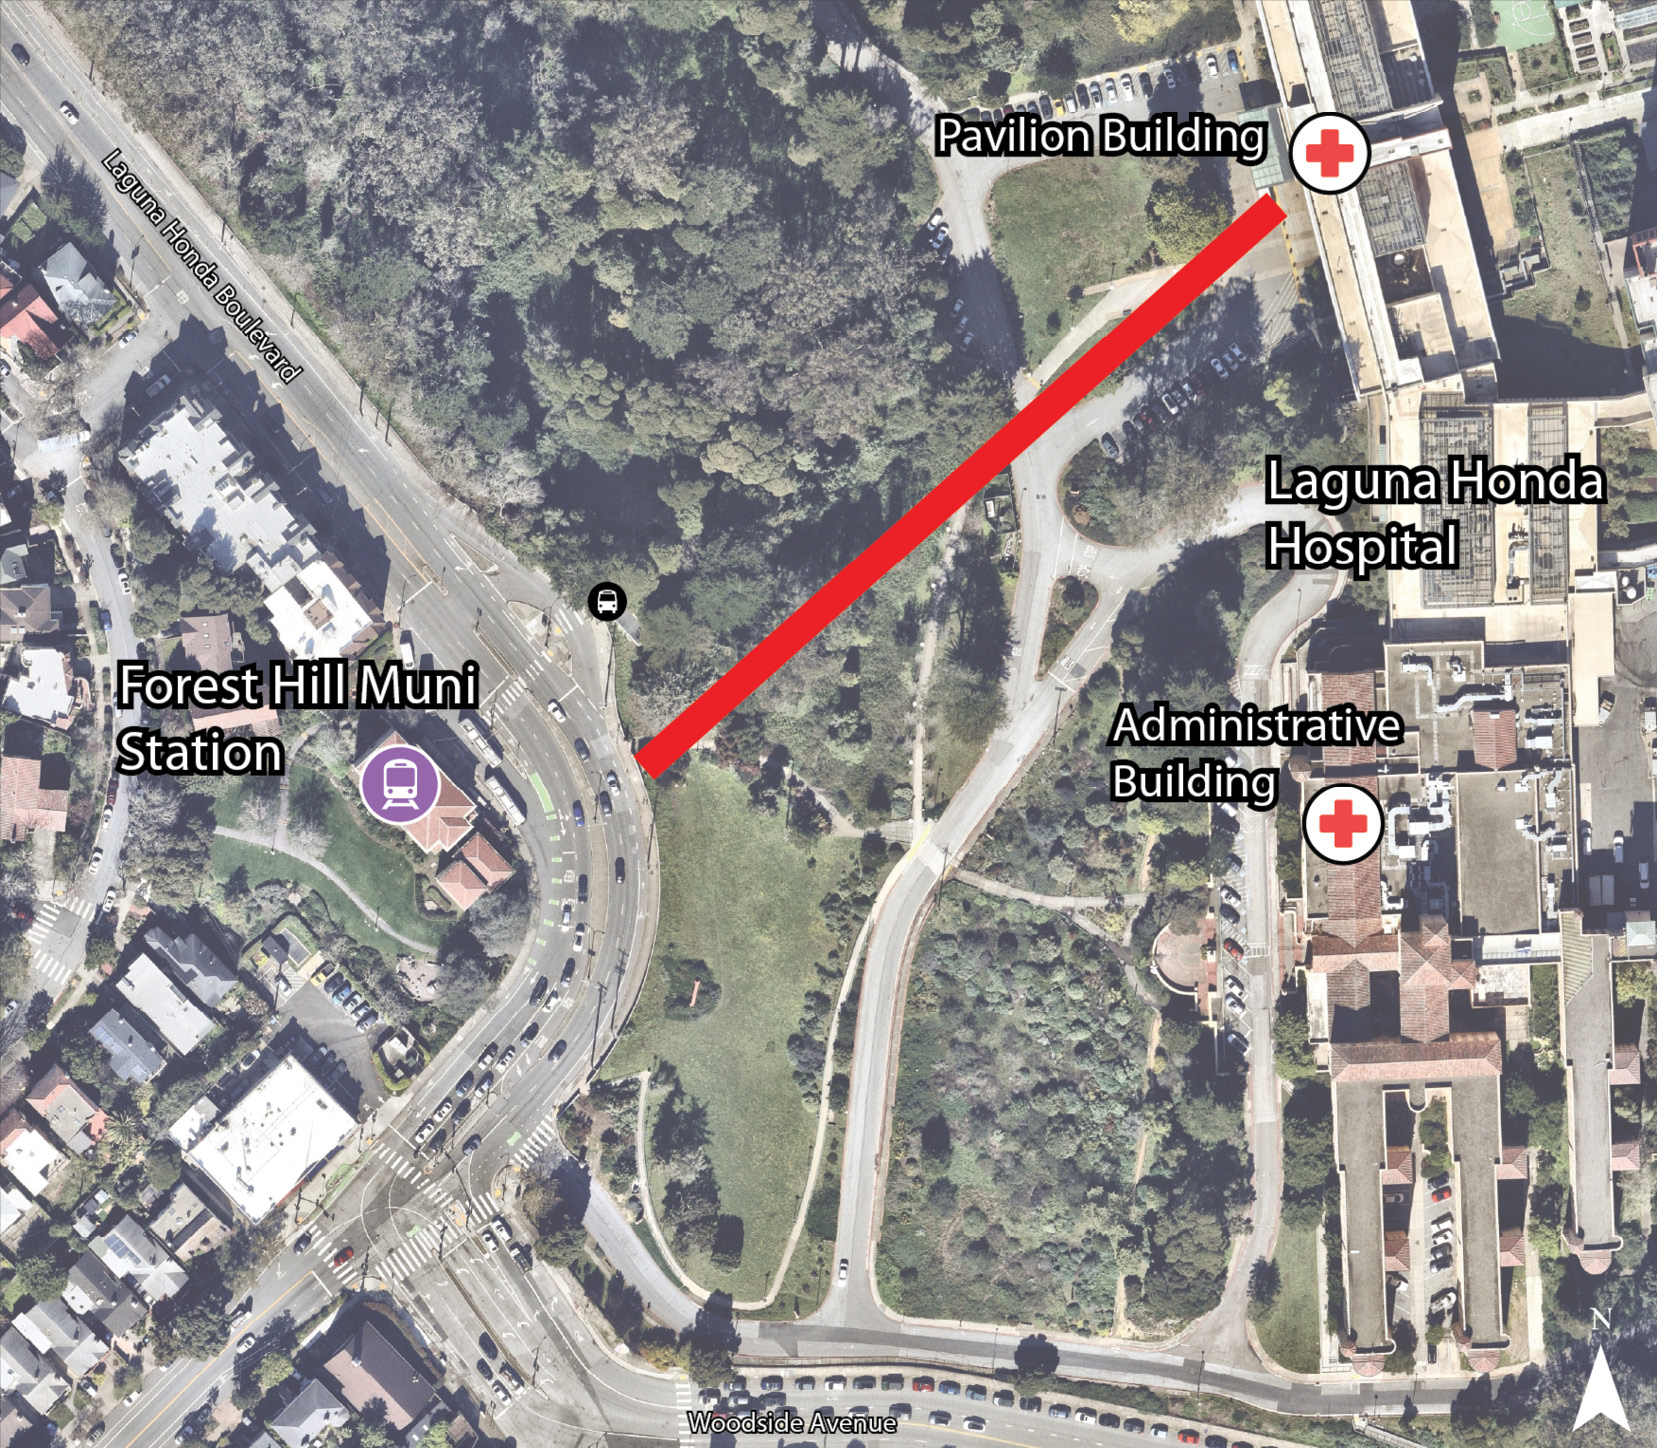
Alternative 2D, shown in Figure 6-6, is similar to Alternative 2C, however the launch point is located at the existing bus stop across from the Station instead of the Hospital Trail Access Point. This alternative avoids utility conflicts but requires pedestrians to cross Laguna Honda Boulevard via the existing crosswalk in front of the Station. This alternative serves the Hospital Pavilion Building only.
Key considerations include:
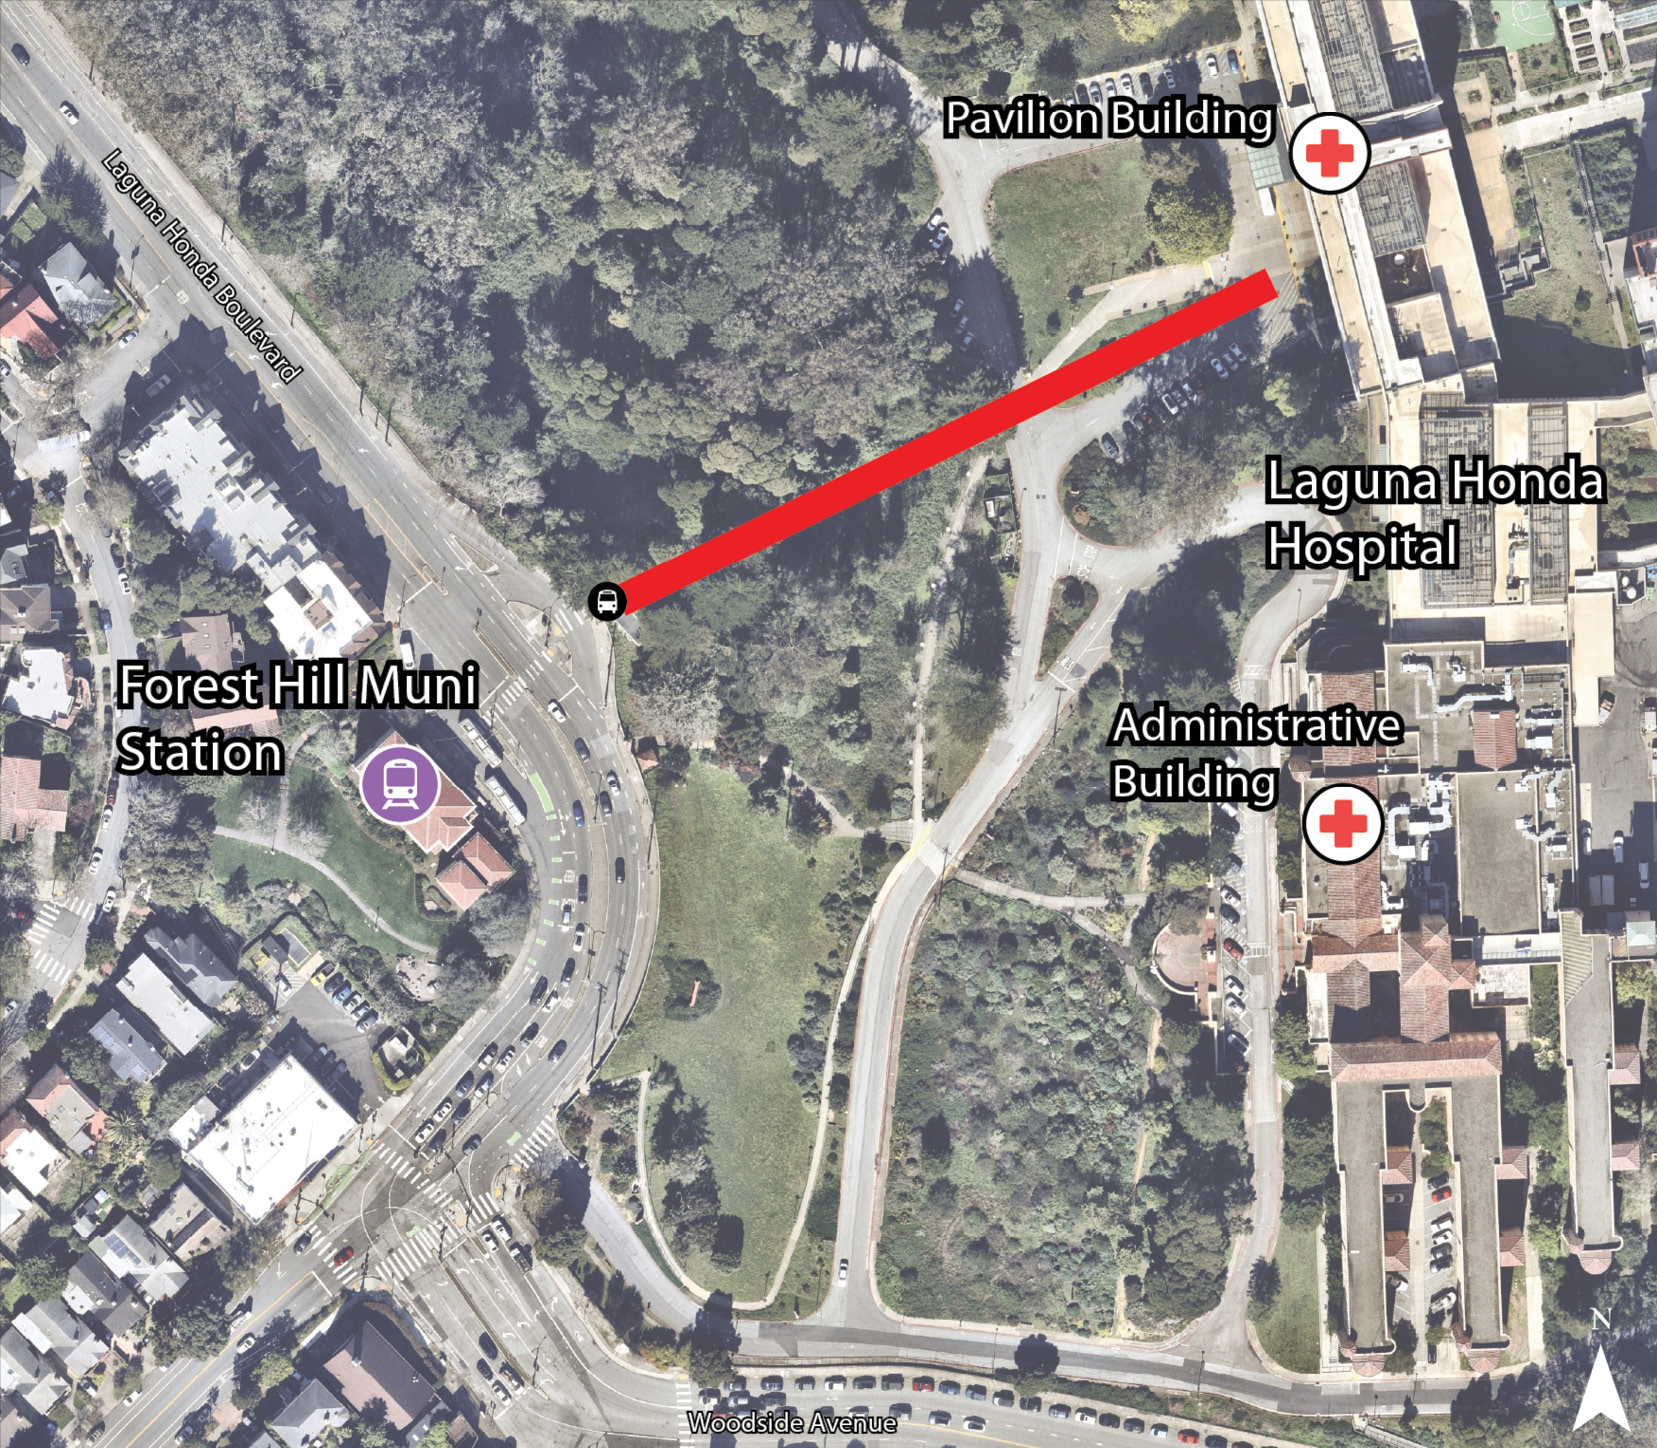
For each of the six alternatives, a future extension from the Hospital Pavilion Building to the new senior housing development planned as part of the Campus Replacement Lot Project was considered. The alignment for the possible future extension is shown in Figure 6-7.
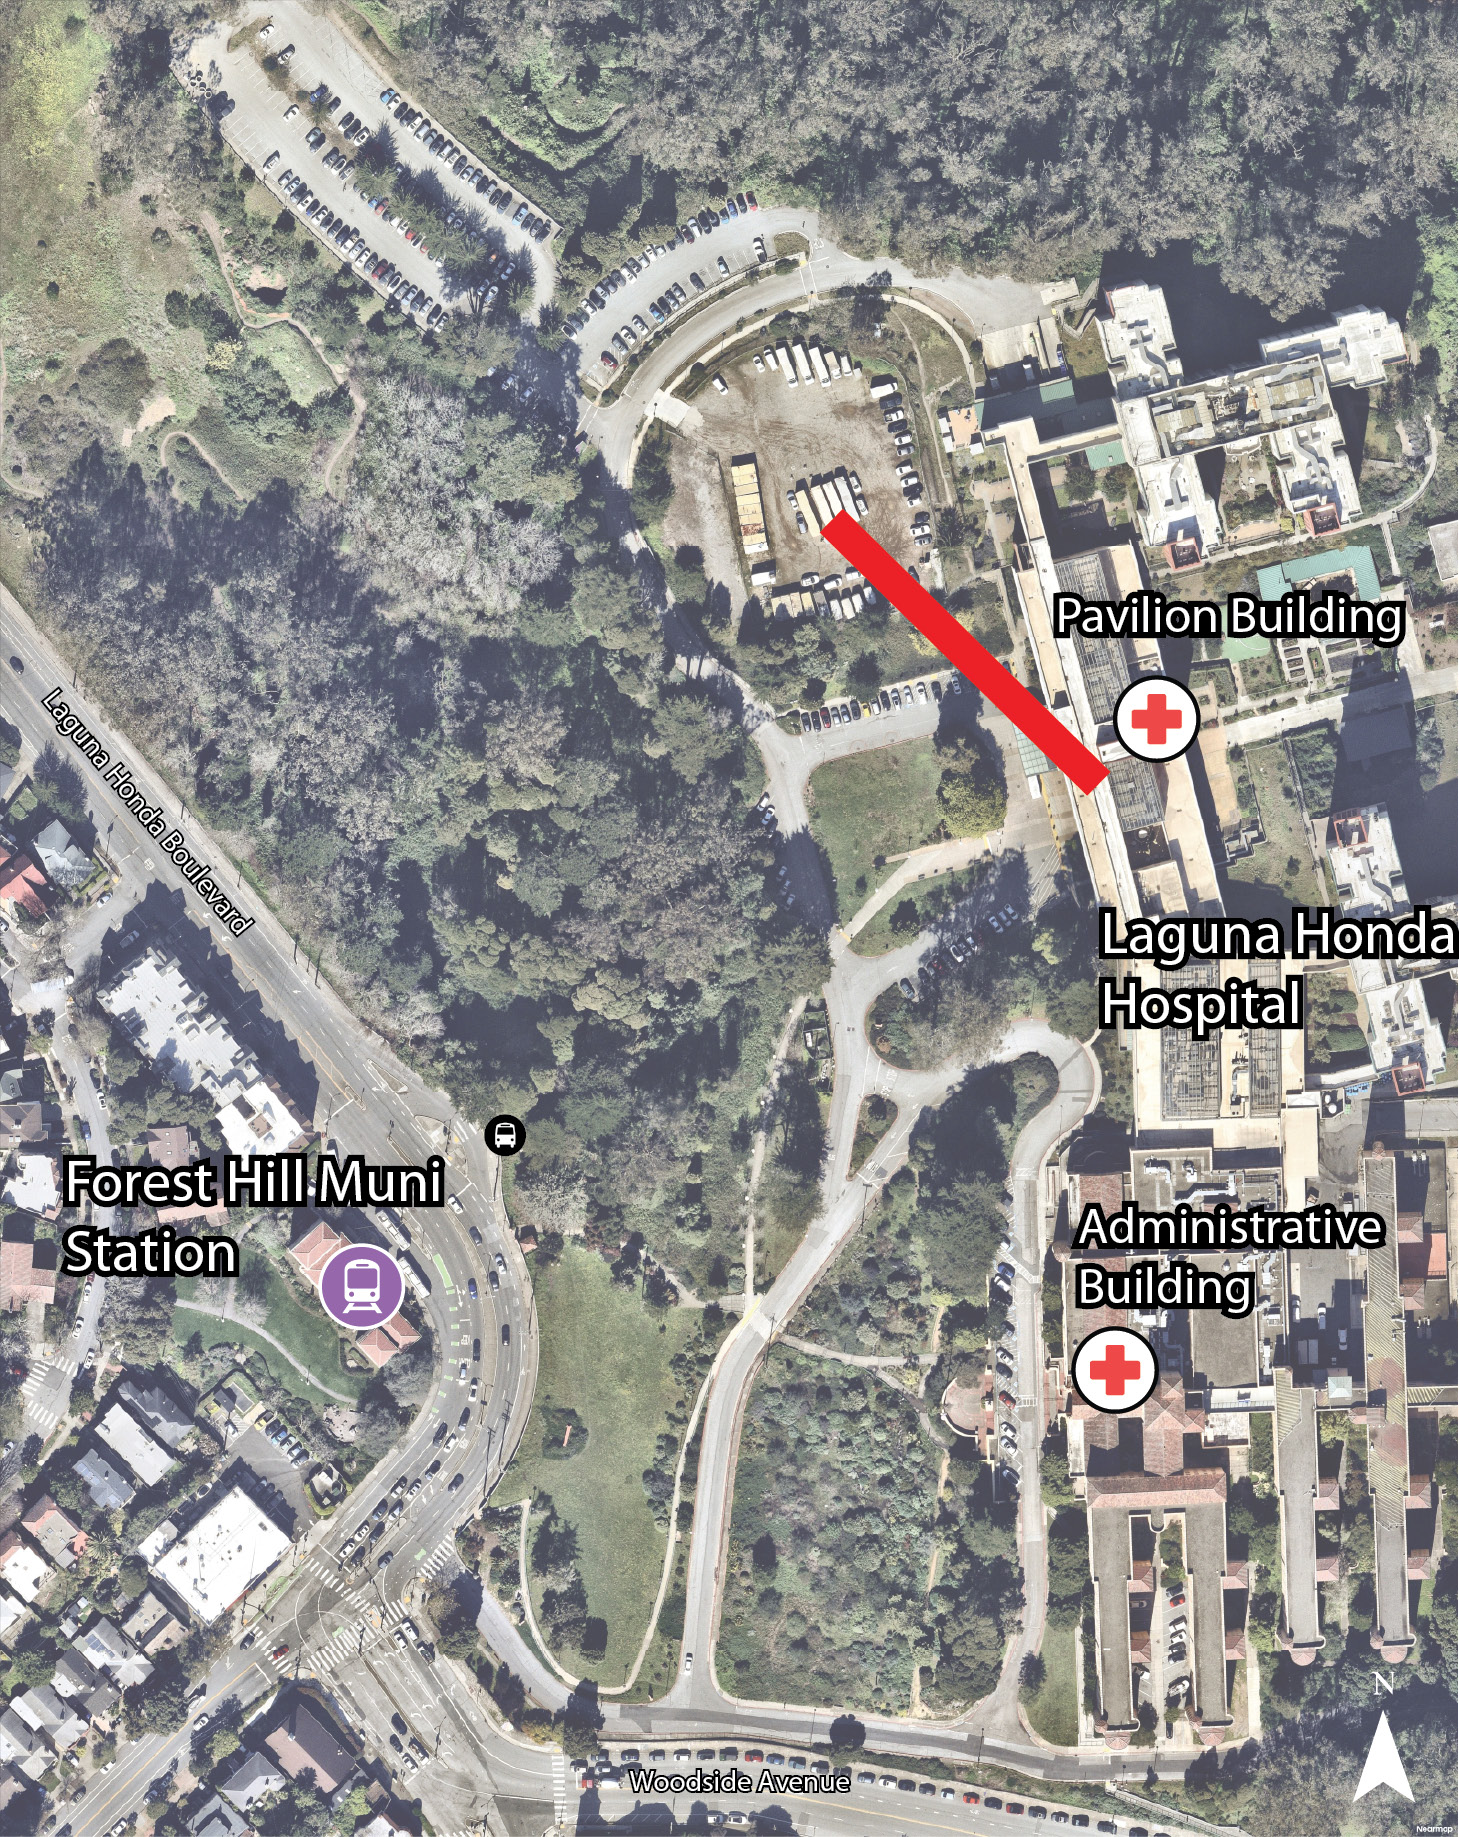
The Team evaluated each alignment alternative based on key considerations, including demand served, utility conflicts, space and constructability, environmental and site impacts, and access and circulation. These considerations were applied consistently across all alternatives and reflect the primary factors influencing feasibility. Table 6-1 summarizes the relative performance of each alternative across these criteria.
As shown in Table 6-1, alternatives that directly serve the Pavilion Building and minimize utility conflicts and site constraints perform most favorably. Alternative 2C provides the best overall balance across these criteria.
The evaluation summarized in Table 6-1 identifies Alternative 2C as the most feasible alternative.
Alternative 2C provides the best overall balance across the evaluation criteria. This alignment directly serves the Hospital Pavilion Building, which accounts for the majority of demand, while avoiding major utility conflicts and minimizing constraints associated with the Station site. In addition, Alternative 2C does not require a pedestrian bridge or other major supporting infrastructure, improving overall constructability.
While Alternative 2C would require consideration of tree and vegetation impacts, these impacts are manageable compared to the utility, space, and access constraints associated with other alternatives. Alternatives that serve the Administrative Building do not align with the primary demand patterns identified in the Market Assessment, and alternatives that originate at or adjacent to the Station introduce significant constraints related to limited space and historic designation.
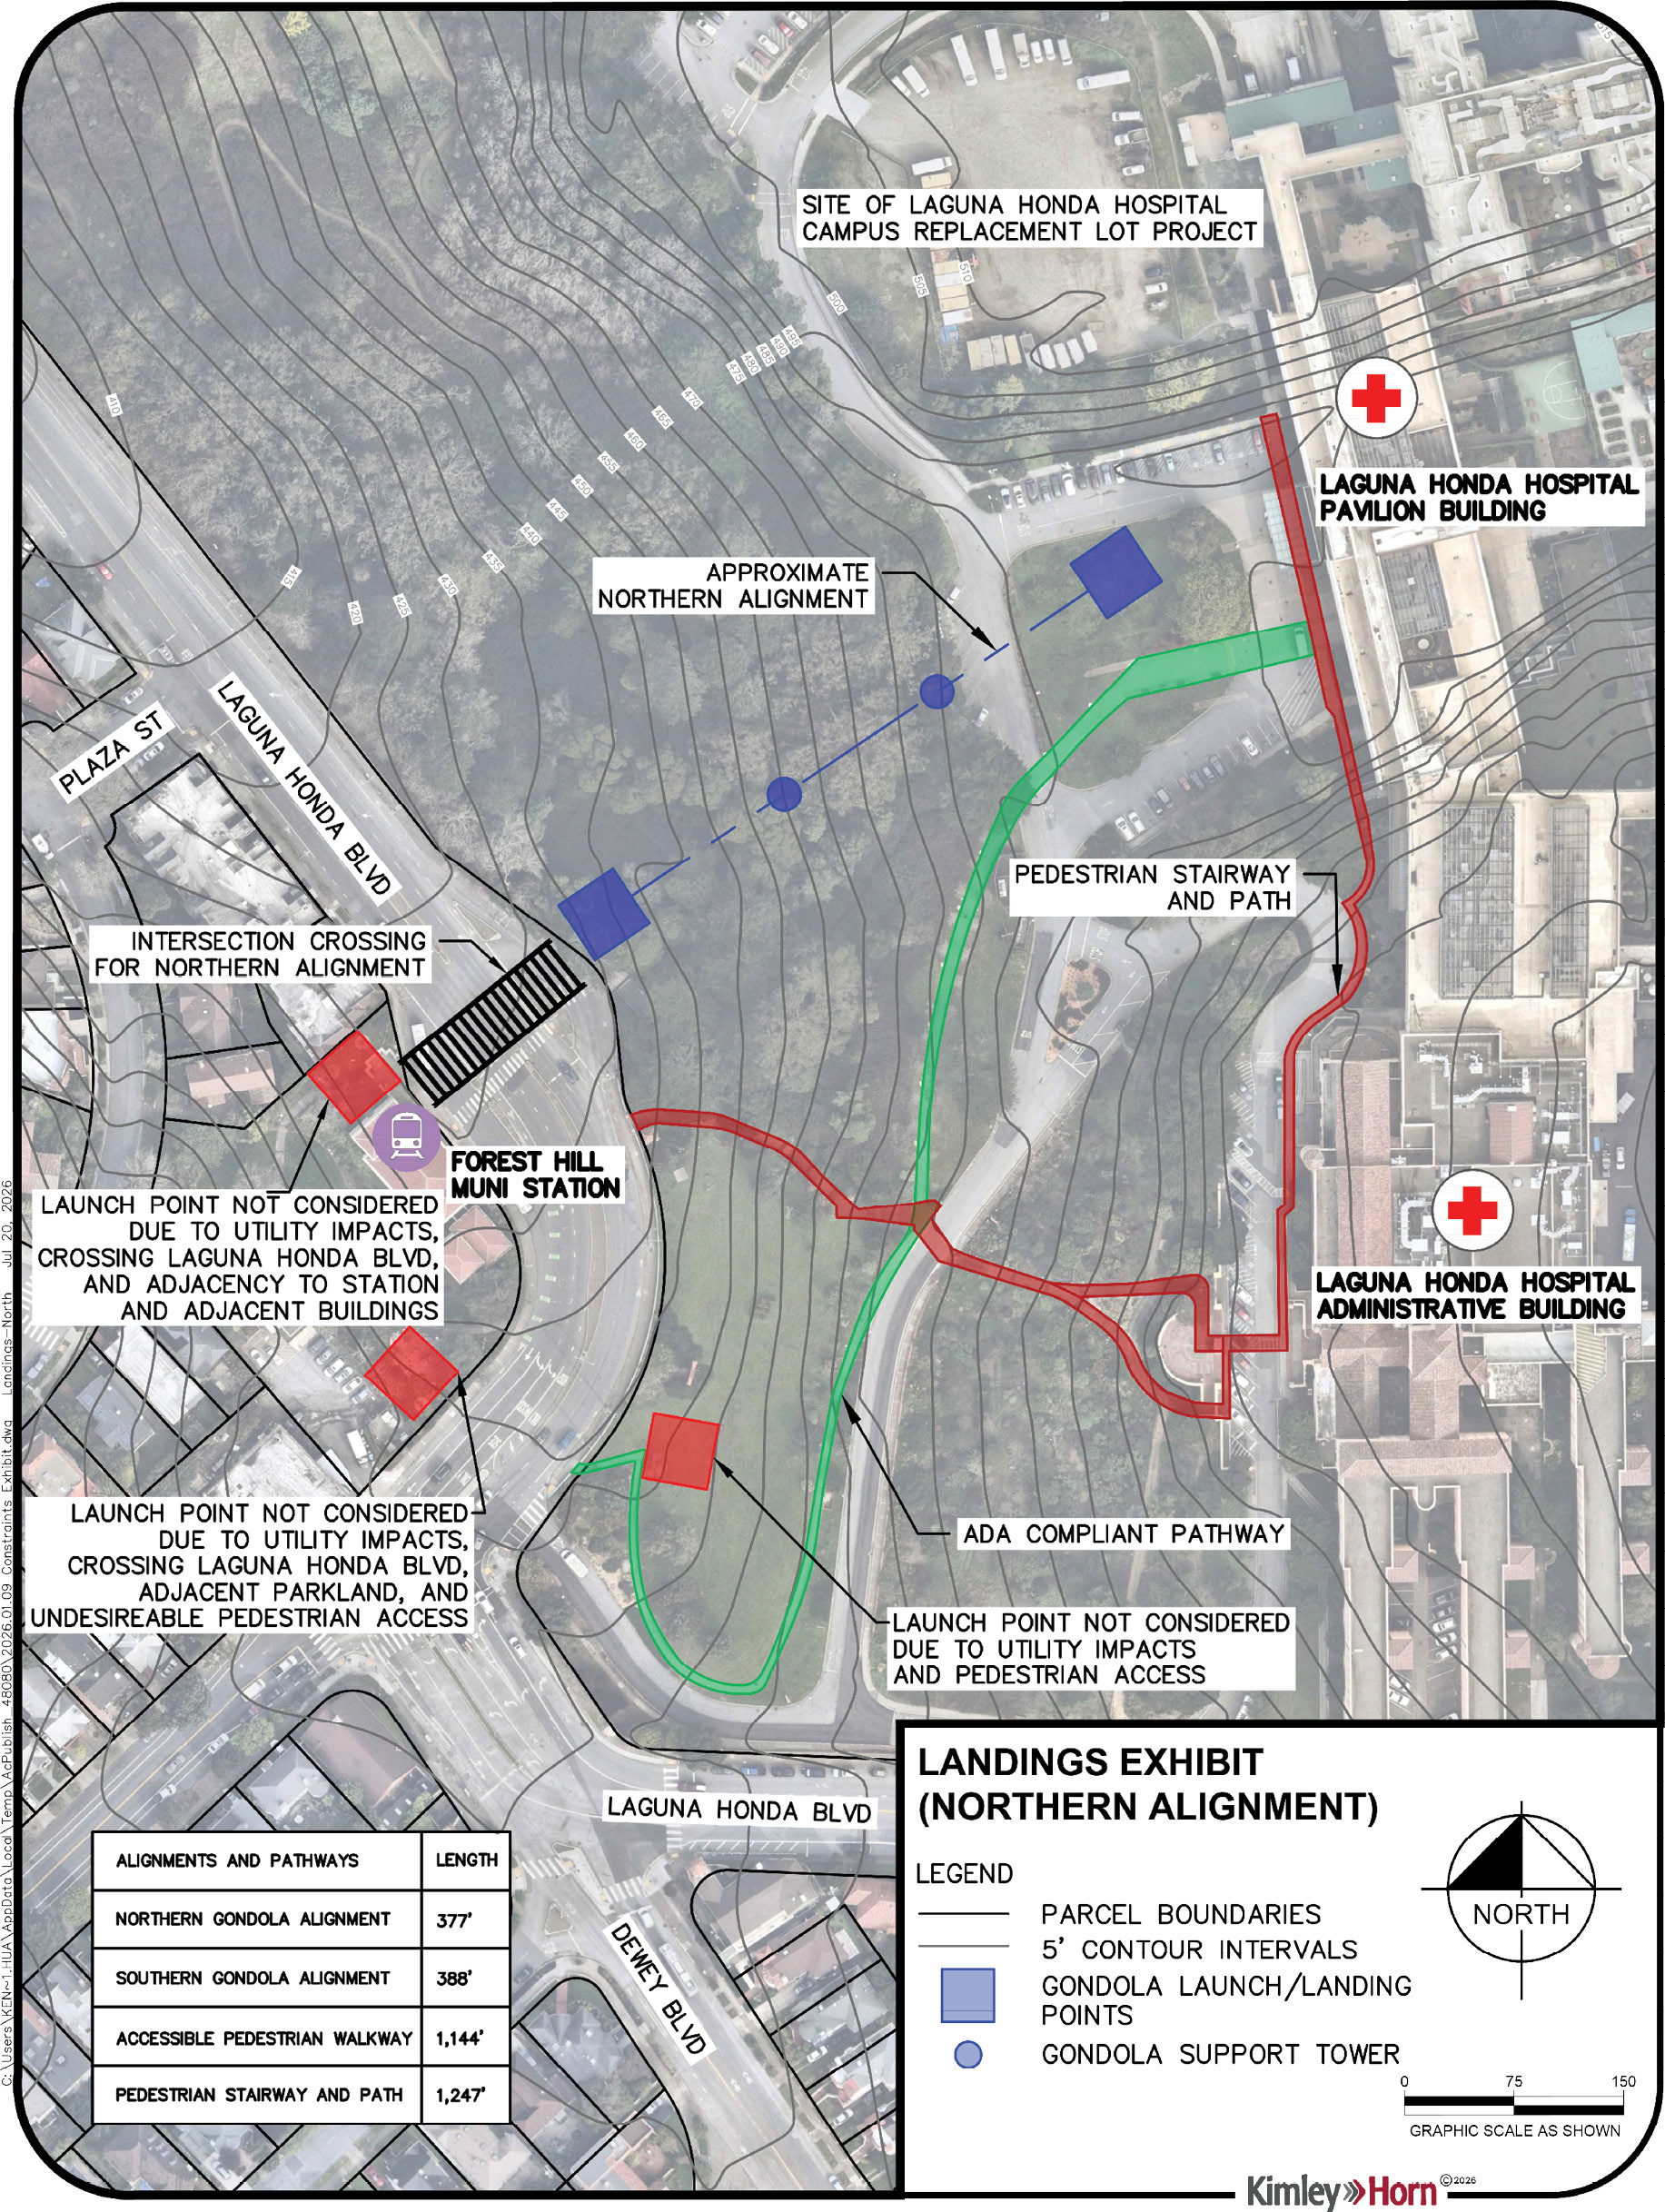
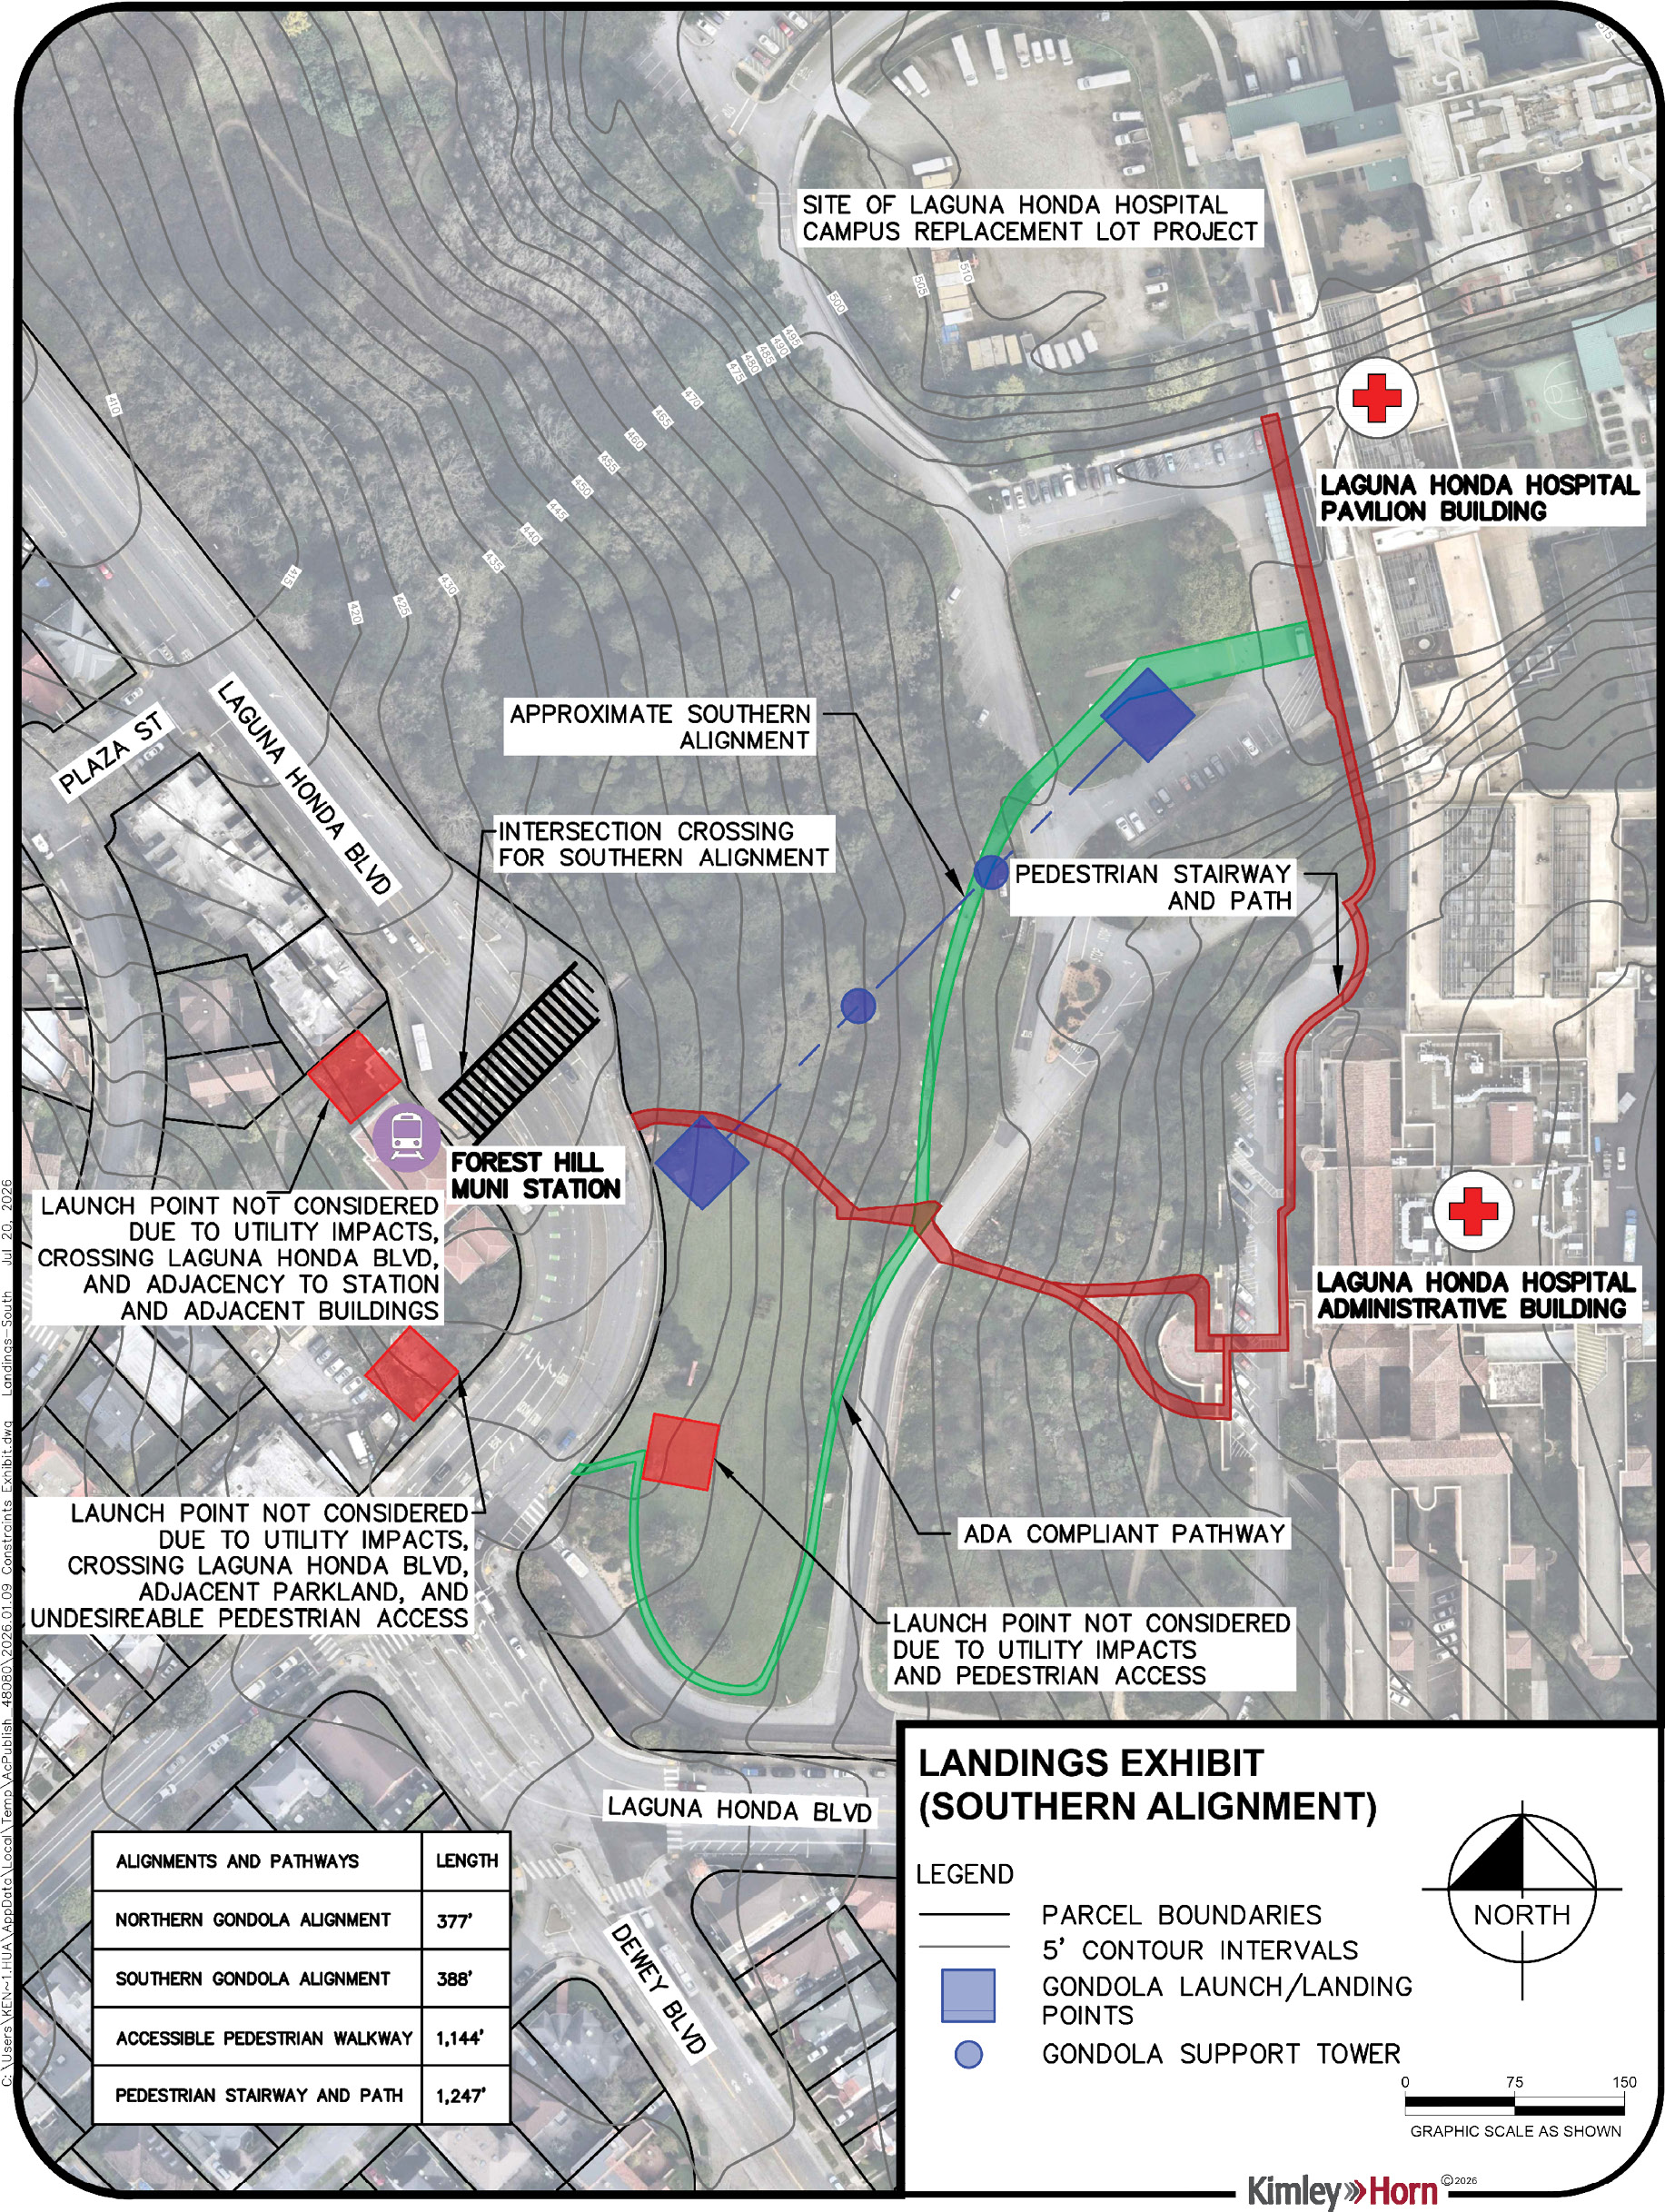
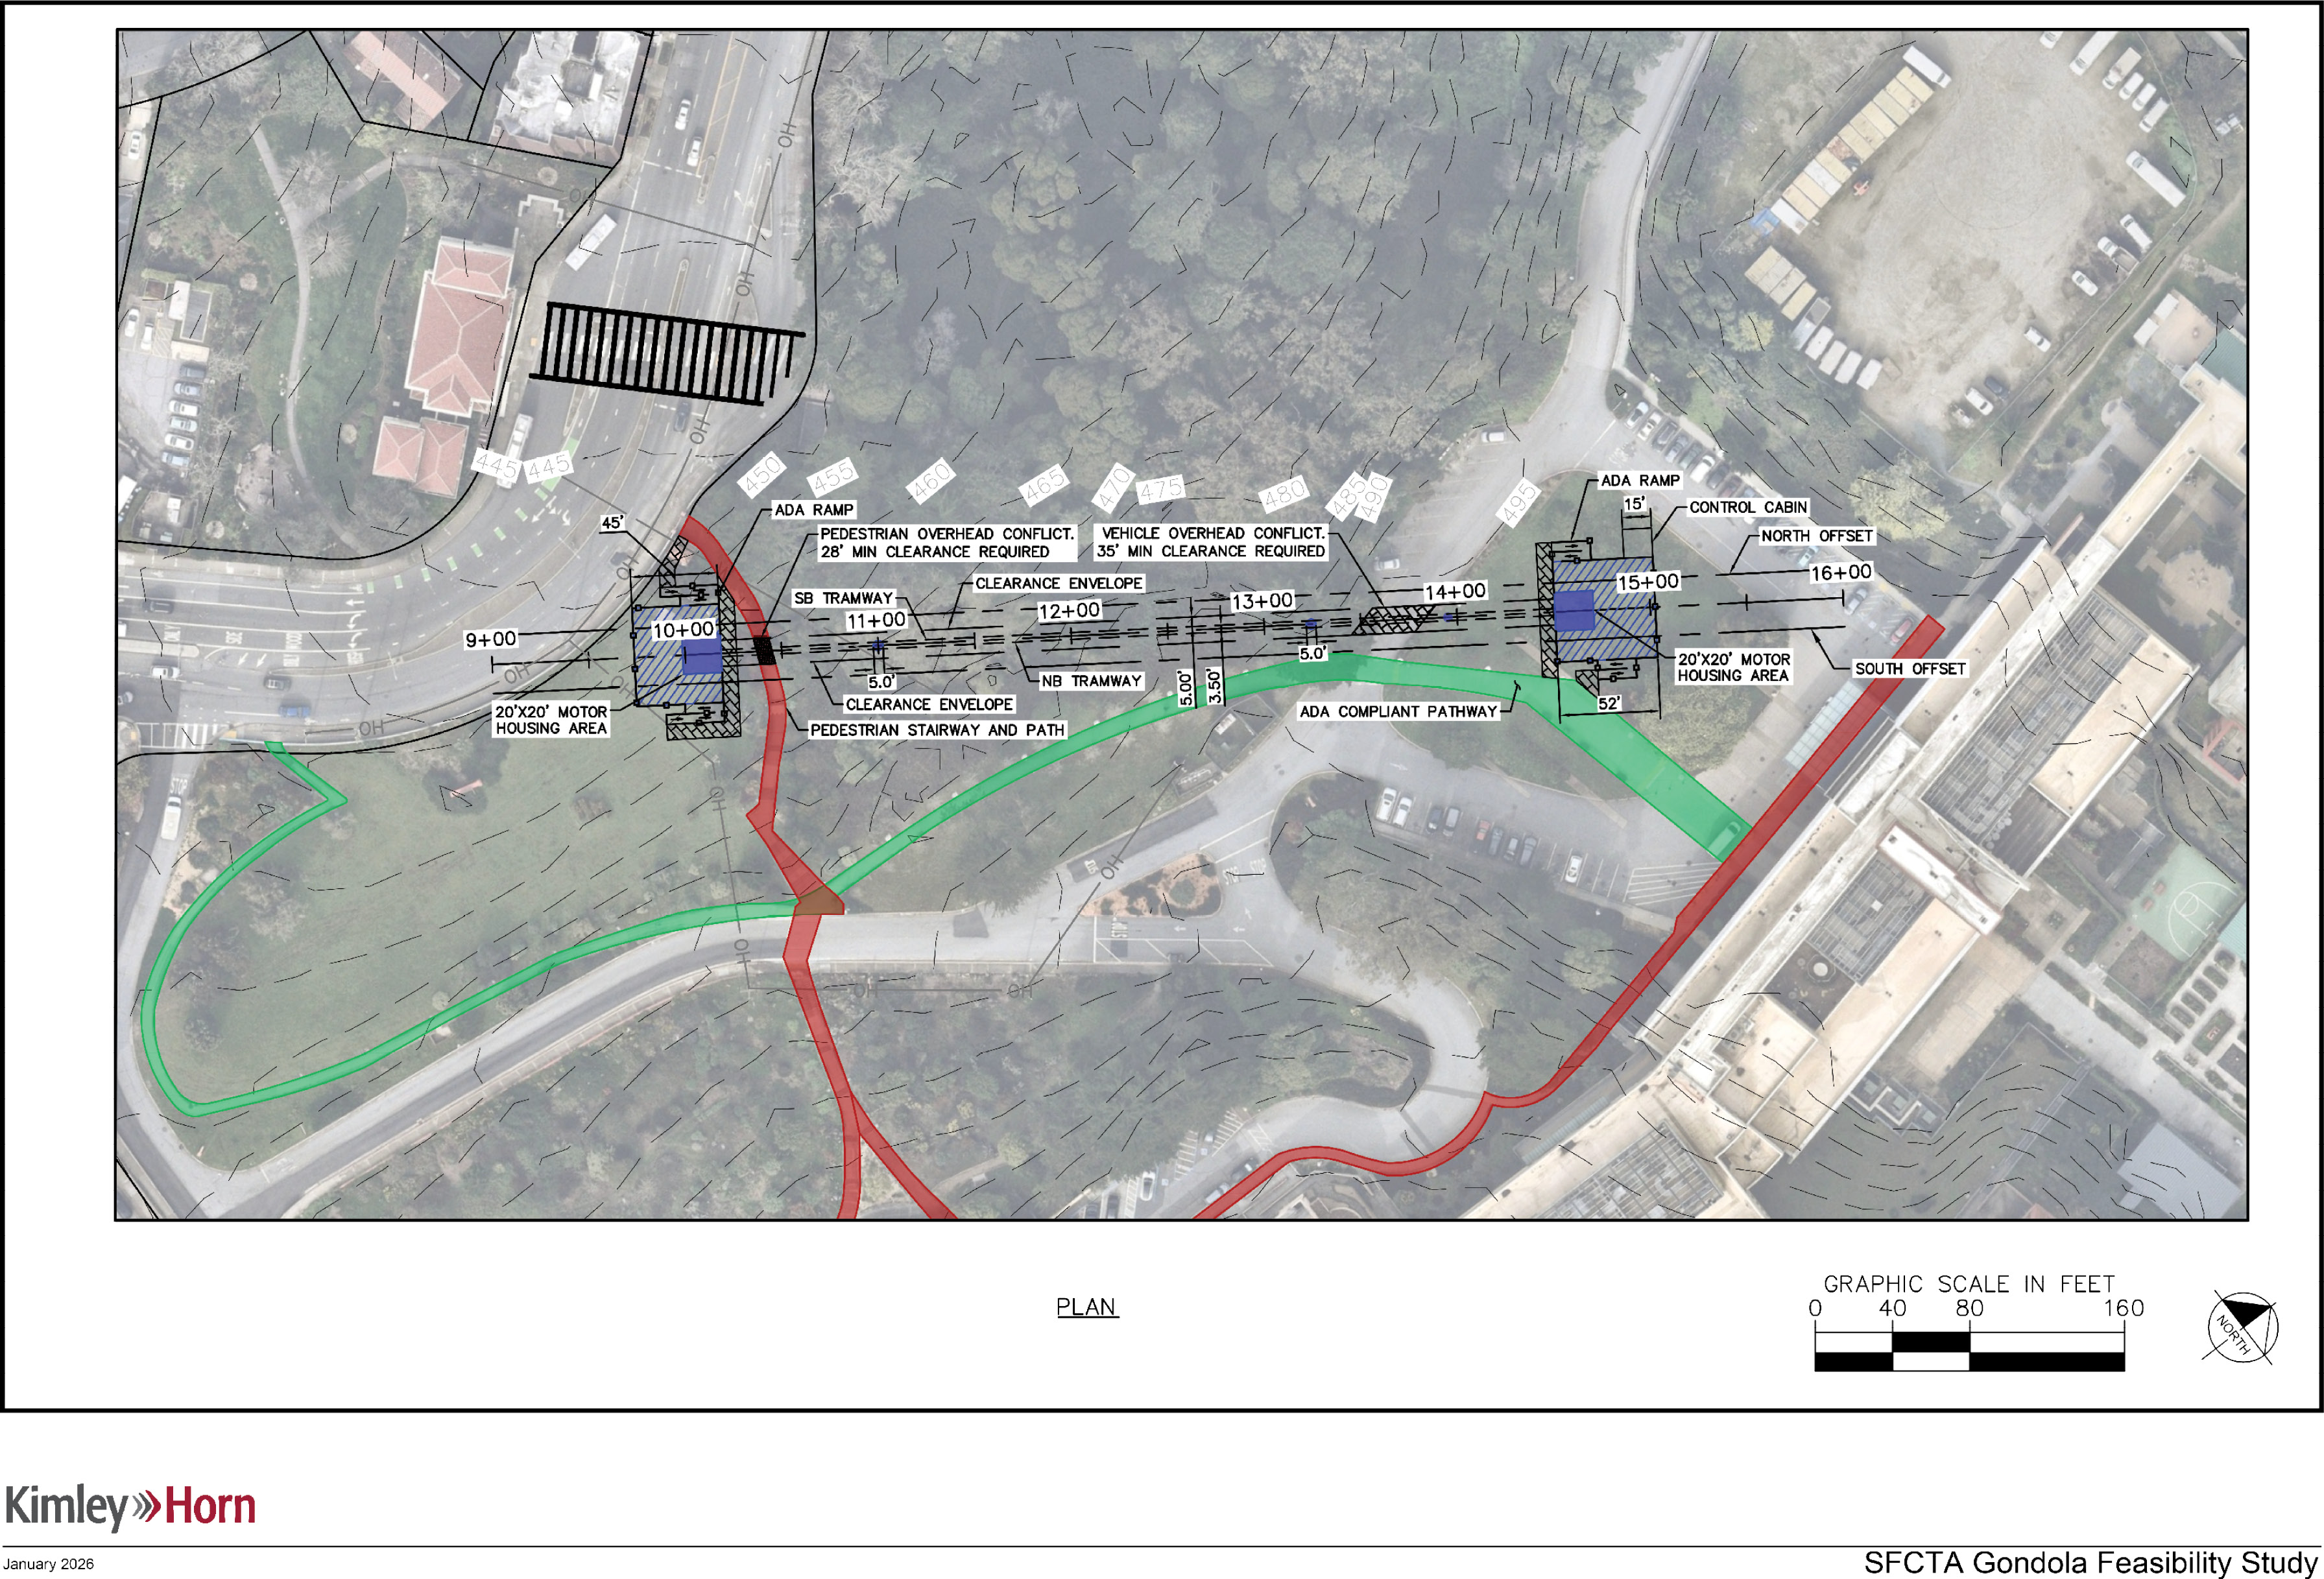
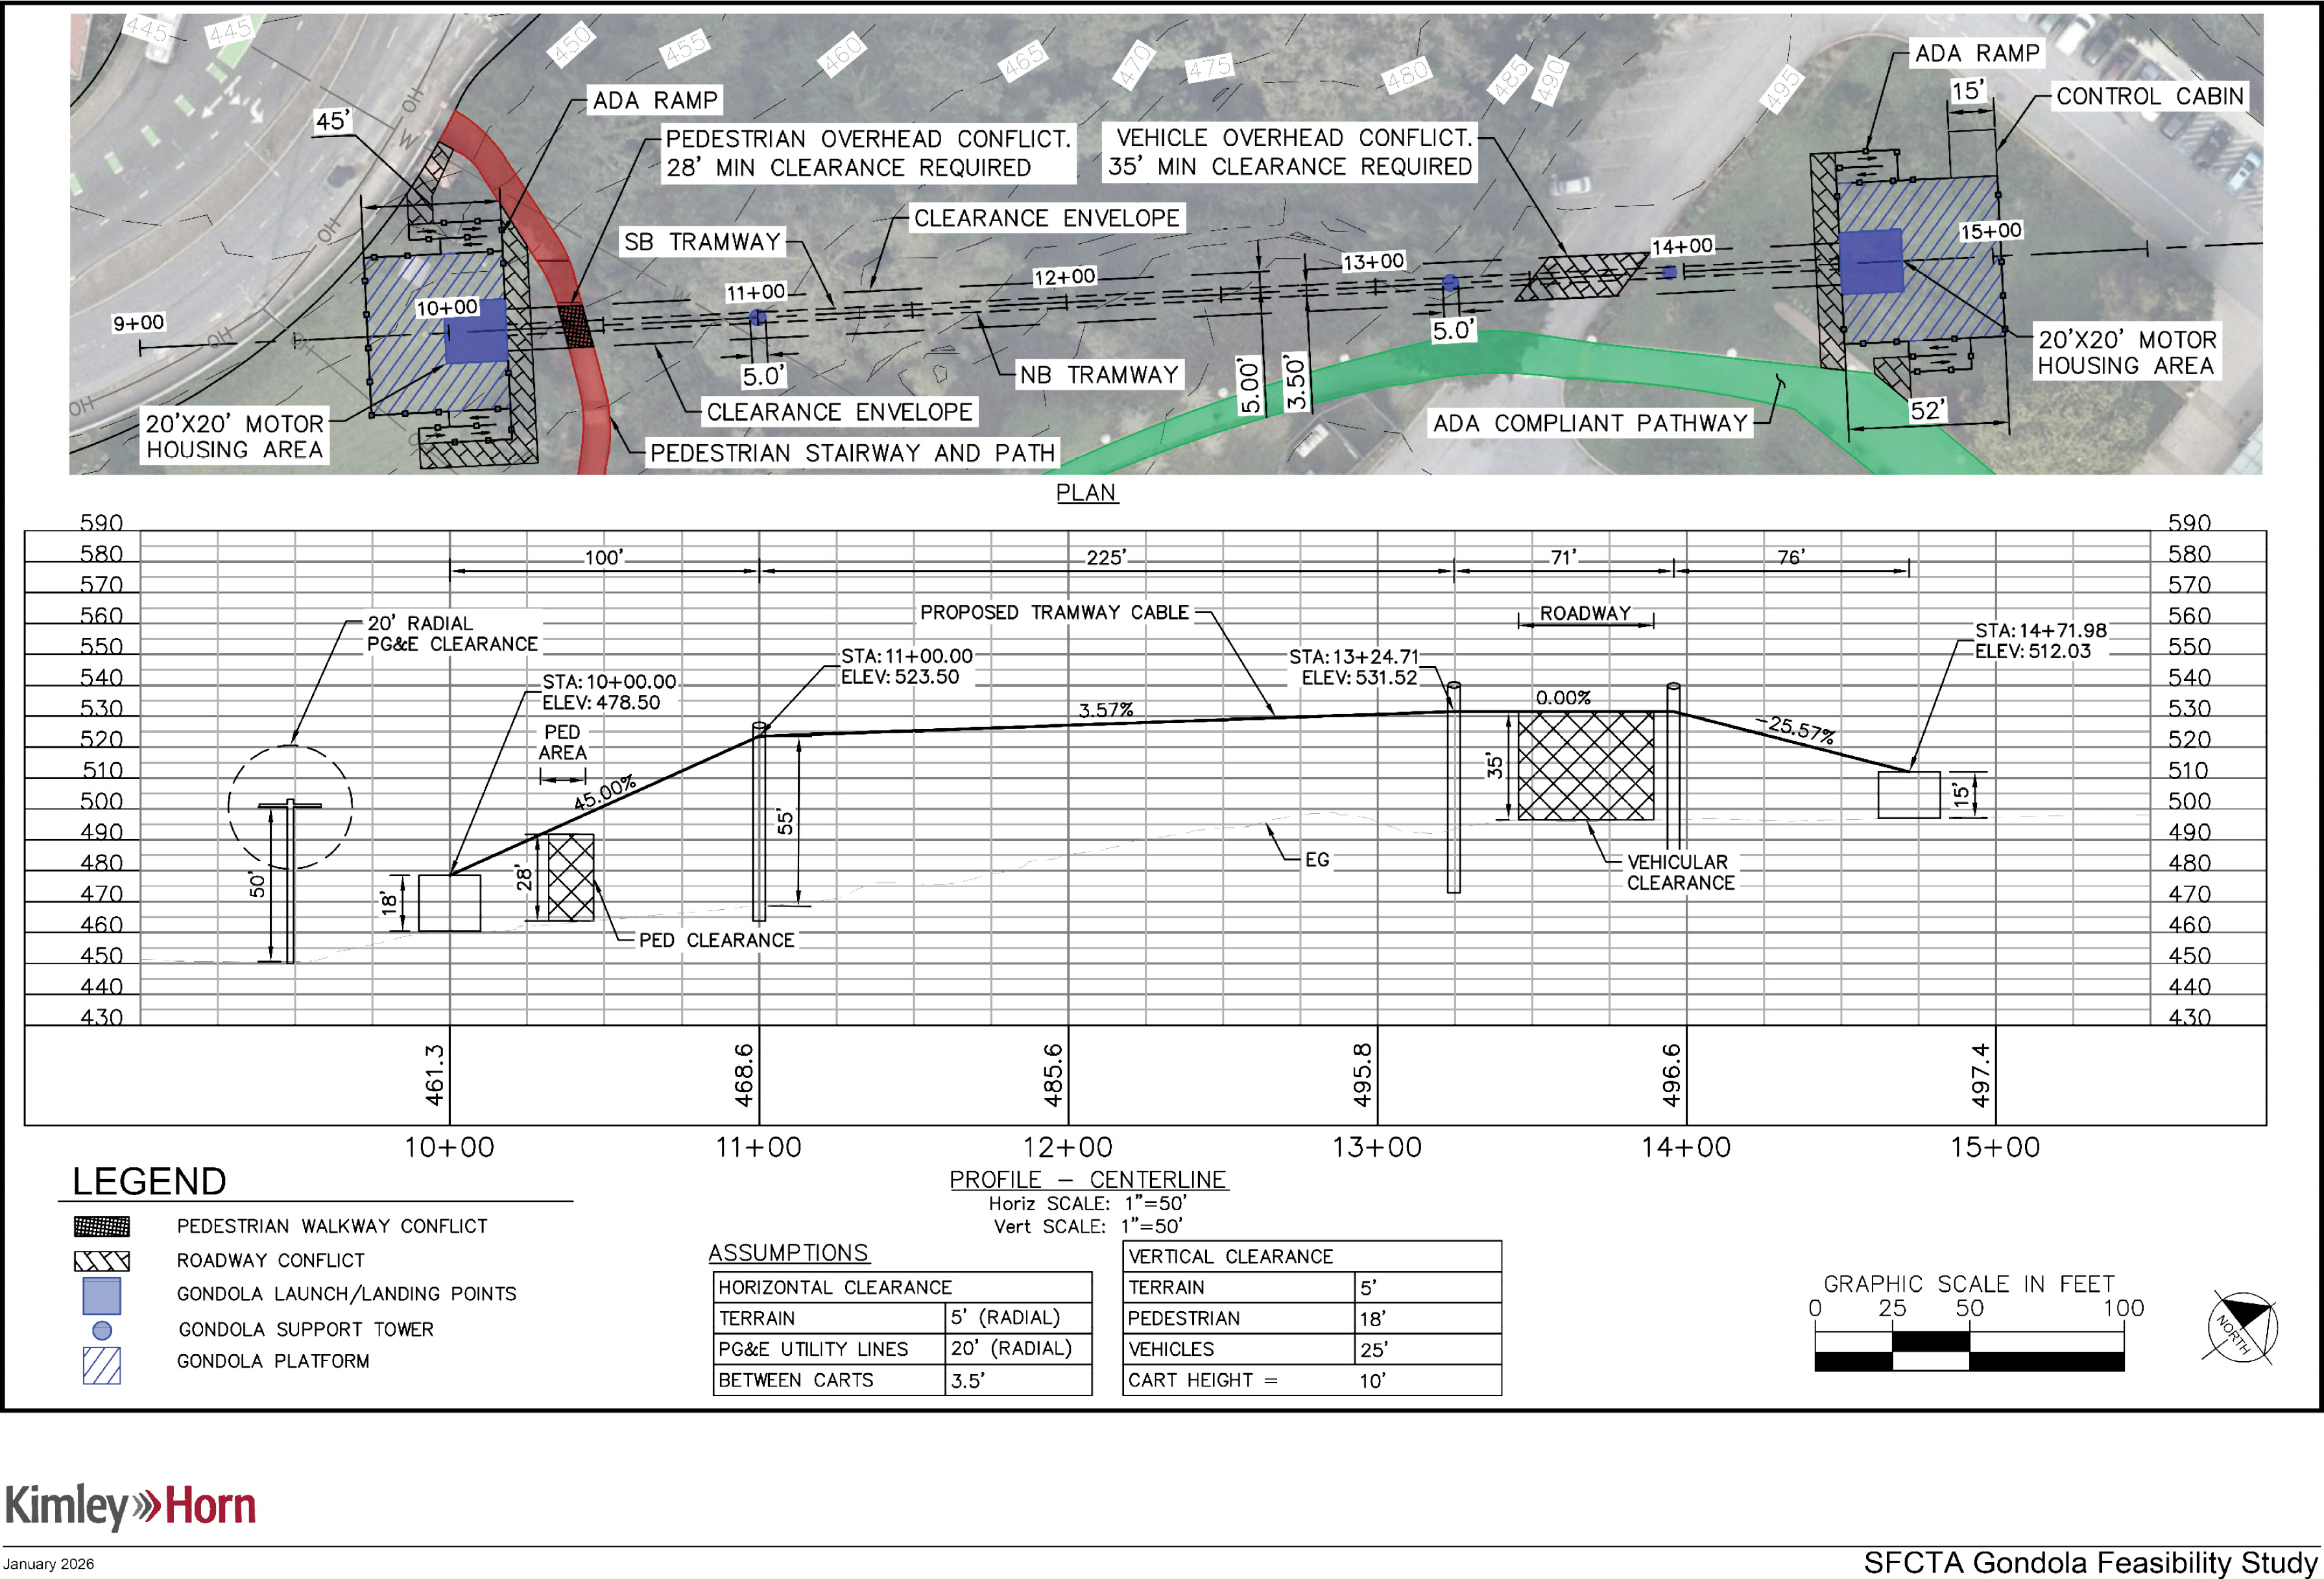
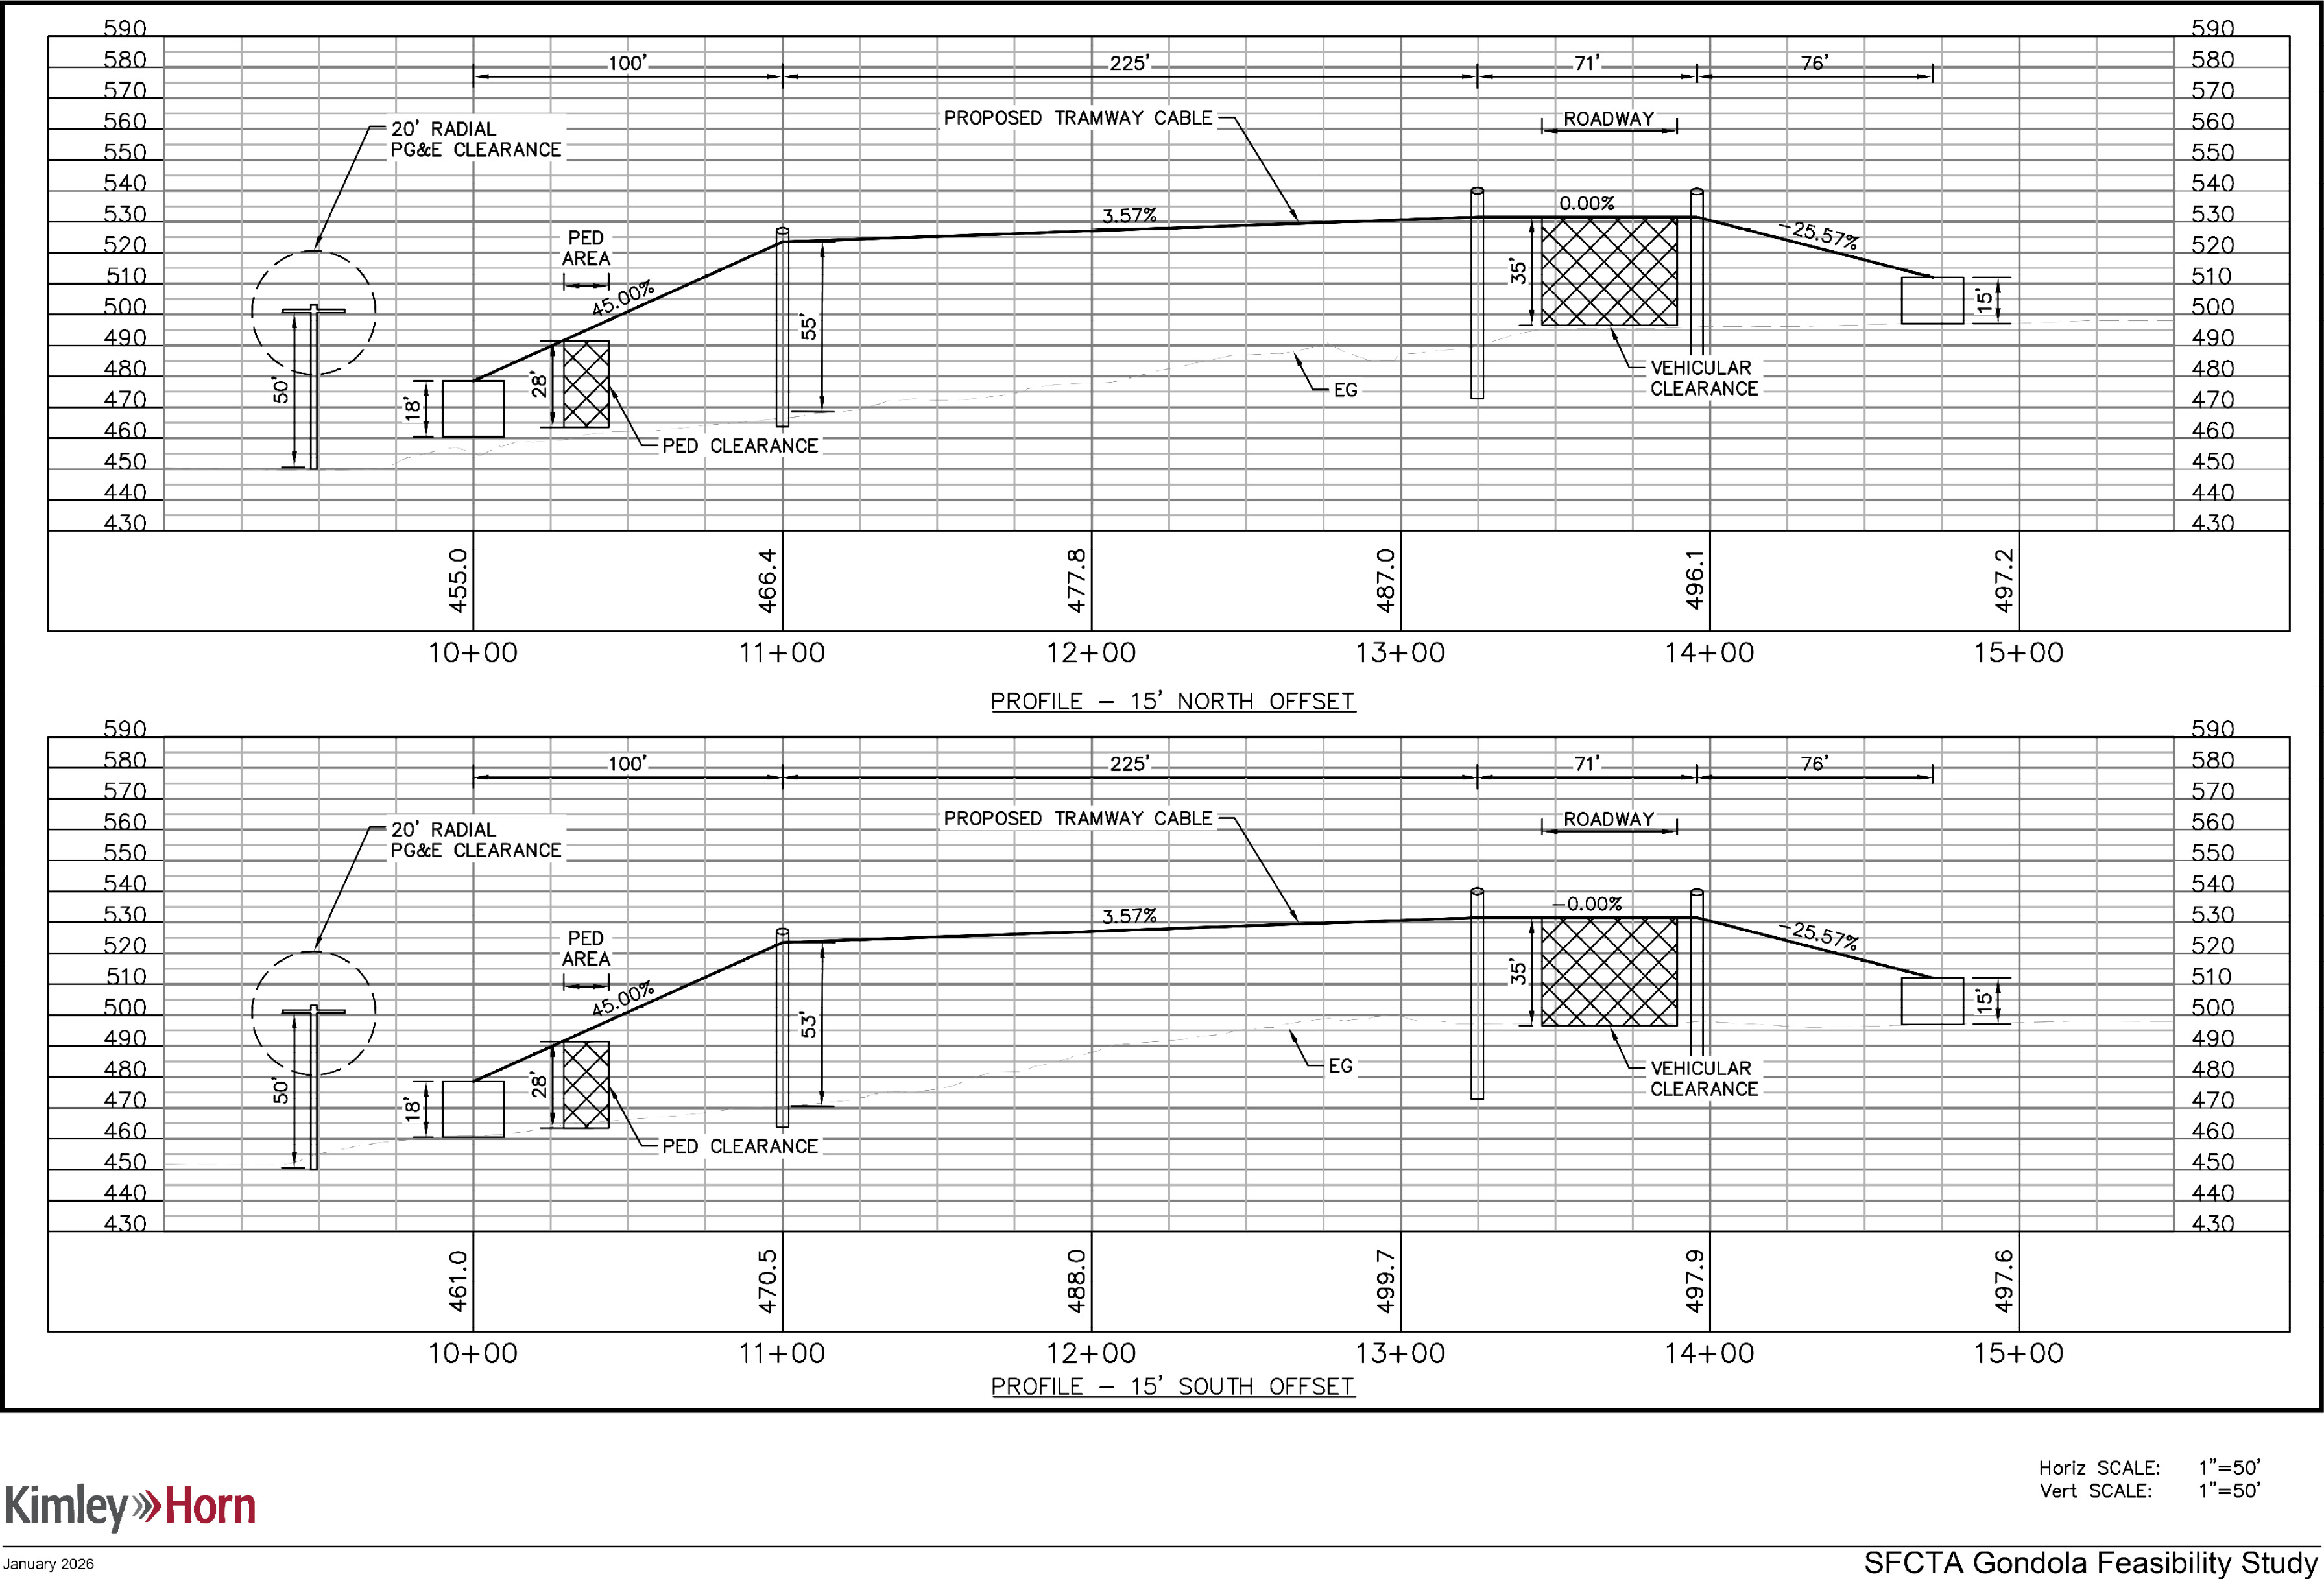
Based on these considerations, Alternative 2C represents the most feasible alignment to advance for further design and evaluation. See Figure 7-1, Figure 7-2, Figure 7-3, Figure 7-4, Figure 7-5 for discussion of detailed alternatives developed for analysis purposes. The Team developed two iterations of this alternative — a northern alignment (Figure 7-1) and a southern alignment (Figure 7-2). While Alternative 2C performs favorably across most evaluation criteria, the alignment crosses an area with a grove of mature trees. The Team developed the southern alignment to minimize these impacts while maintaining a direct and feasible connection within the identified site constraints. As a result, the southern alignment was advanced for further refinement, including horizontal (Figure 7-3) and vertical alignment (Figure 7-4 and Figure 7-5) development and cost estimation (Section 7.1).
The Study Team developed rough order of magnitude (ROM) cost estimates based on input from two ropeway system suppliers, Doppelmayr and Leitner Poma.
Doppelmayr provided a cost estimate that broke down capital costs into various categories including facility infrastructure and construction, civil construction for ropeway system, electro-mechanical ropeway equipment, and ropeway construction and commissioning costs. The cost estimate also included annual operations and maintenance costs for 365-day operation. Based on this estimate, the total capital cost for the most feasible alignment is $4.1 million with an additional up to $2 million needed annually for operations and maintenance. This includes 2 operators, 1 manager, and 1 maintenance technician.
Leitner Poma provided a cost estimate that included a single capital cost total for the entire system. This capital cost was estimated at $5.11 million. Leitner Poma also provided two operations and maintenance costs: one that includes supplier provided staff, maintenance, and additional parts, and one estimate for maintenance costs alone. The estimate for the full operations and maintenance contract was quoted at $614,000 per year and the maintenance only contract was quoted at $147,000 per year. This includes 2 operators.
The Team developed supplemental costs for infrastructure improvements not included in the ropeway system supplier estimates. These costs include infrastructure for the station boarding areas, such as boarding platforms, railings, lighting, control cabins, and other station amenities. The Team also developed costs related to intersection improvements along Laguna Honda Boulevard, including crosswalk treatments, new concrete flatwork and curb ramps, traffic signal modifications, and new street asphalt paving.
The Team combined the civil cost estimates with the supplier estimates to develop a final ROM cost estimate for the system. Table 7-1 summarizes the final ROM cost estimates for the system. These costs include contingency, escalation (assumed to be 7.5% over five years), and other soft costs such as design and permitting.
This section assesses an alternative shuttle service designed to provide comparable mobility benefits as the proposed gondola. Notably, Laguna Honda Hospital already offers shuttle services from Monday to Friday from 6:00 a.m. to 5:50 p.m. between the Station and the Hospital. Accordingly, this analysis builds on a review of the existing services and potential adjustments needed to meet the projected growth scenarios.
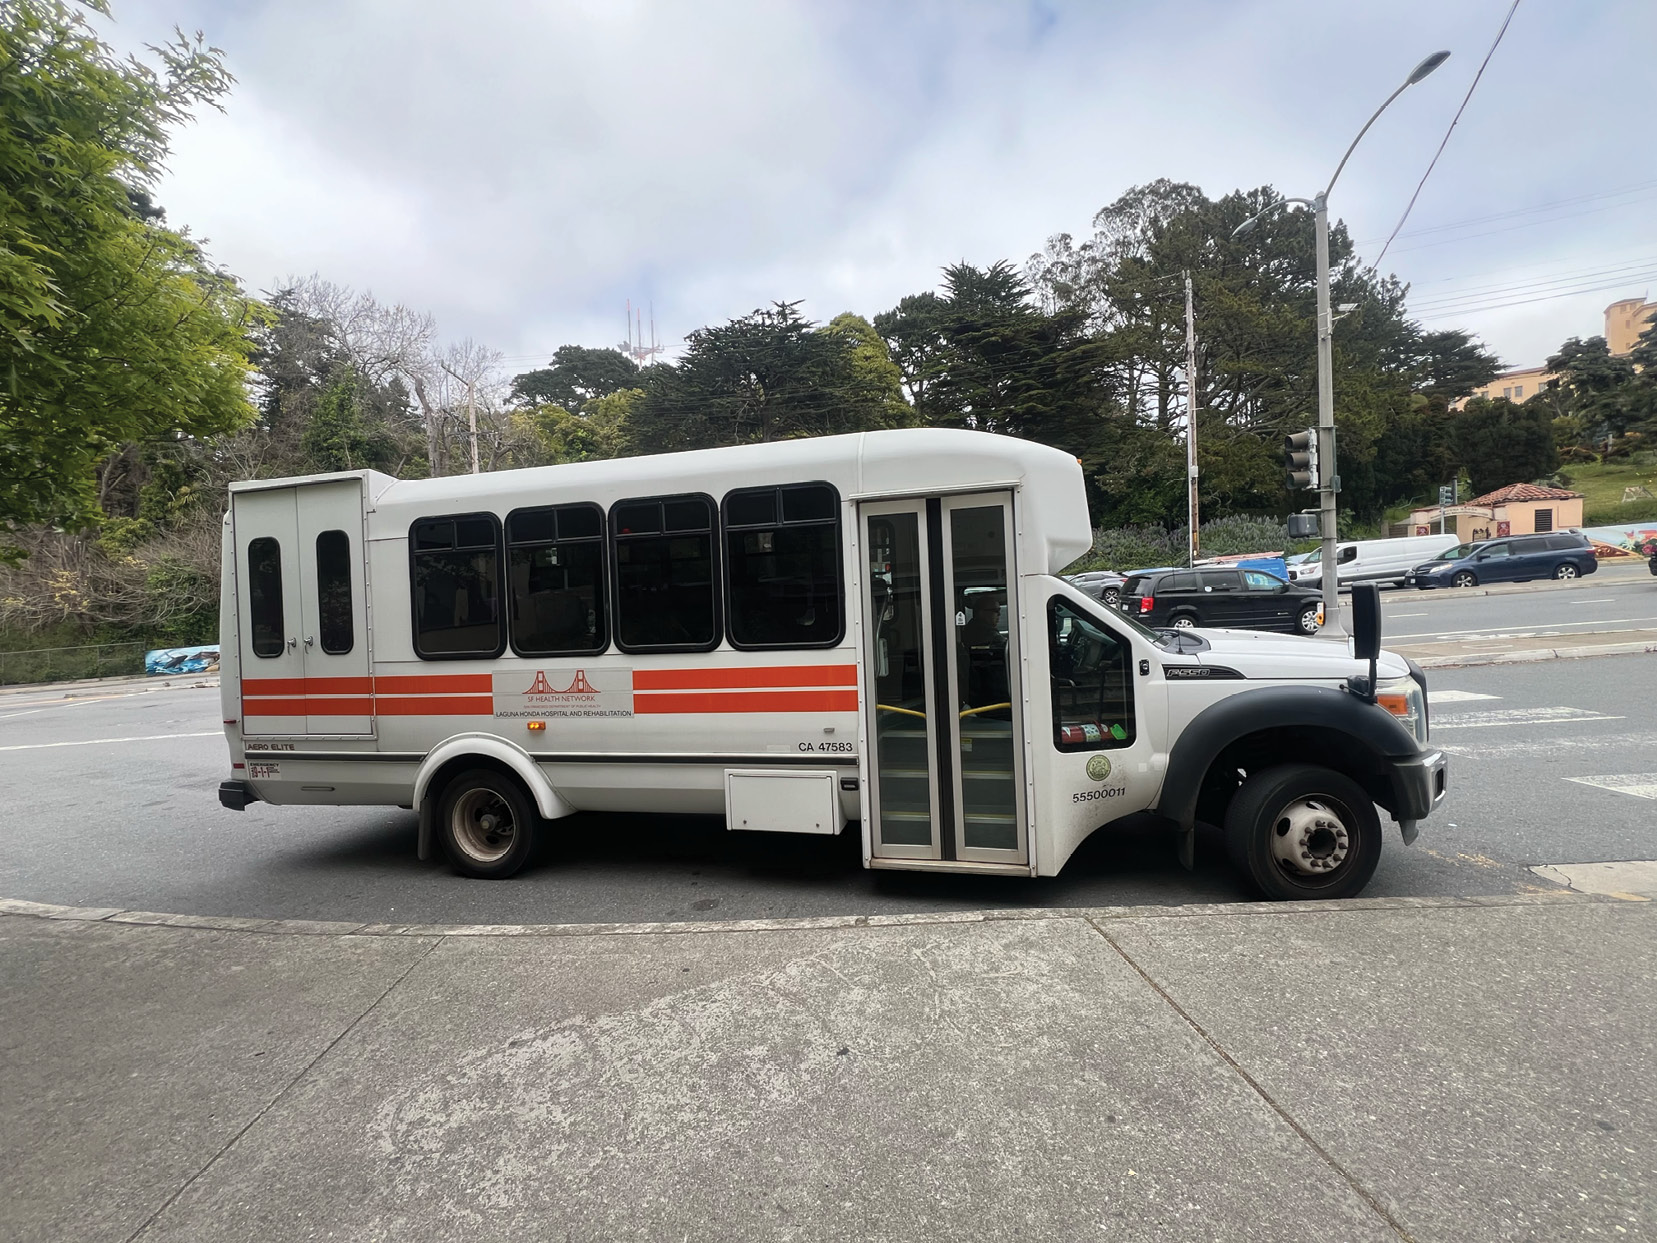
Two entities operate the existing shuttle service under a split-schedule model:
The shuttle provides door-to-door connectivity between the Station and all major Hospital Buildings, accommodating both ambulatory passengers and wheelchair users. The standard vehicle configuration includes 10 ambulatory seats and two wheelchair positions, for a total capacity of 12 passengers per trip.
Current daily ridership on the shuttle services is approximately 125 passengers per day. The existing service has a theoretical daily capacity of 576 passengers (48 trips per day at 12 passengers per trip), indicating that the service currently operates well below maximum capacity. By comparison, a gondola would have twice the capacity of the shuttle system, serving 1150 passengers per day.
In peak-hour terms, the shuttle can accommodate up to 48 passengers per hour (four trips/hour × 12 passengers), with the ambulatory breakdown being 40 seats and eight wheelchair positions.
The Study’s demand projections for the gondola include two growth scenarios:
Under both scenarios, the existing single-vehicle shuttle service retains sufficient daily capacity to absorb projected ridership growth from the Hospital. This does not accounting for potential induced gondola demand from non-Hospital demand serving neighboring land uses (residential and Twin Peaks), which this study did not assess. However, the 20% scenario warrants closer attention at peak hours: if peak-hour demand is concentrated exclusively among ambulatory passengers, the load factor approaches or exceeds 0.9, indicating near-capacity conditions. This would likely necessitate scheduling adjustments or modest capacity additions during peak periods.
A Fehr & Peers Laguna Honda Hospital Transportation Demand Management (TDM) Report (2023) assessed existing travel conditions and recommended strategies to reduce single-occupancy vehicle trips to the Hospital campus, and provides an important foundation to complement shuttle services going forward. This TDM plan could also be adjusted to balance travel demand across modes (e.g. promote SFMTA Essential Trip CardThe SFMTA Essential Trip Card (ETC) program, administered through SF Paratransit, provides subsidized taxi trips for adults 65+ and people with disabilities, who pay 20% of the regular fare for roughly two to three round trips per month. benefits or carpool incentives) as warranted.
The current annual operating cost for the shuttle service is $300,000 per year, which includes the TransMetro shuttle contract for $122,022, and the Laguna Honda Hospital service for $177,382 per year.
The analysis highlights several data points that planning teams and decision-makers may weigh against each other:
Cost: A net present value analysis of the shuttle and gondola options over a 20-year horizon (3% real discount rate) suggests the gondola option would be significantly more costly than a shuttle service - up to 7x higher on a lifecycle basis.
Capacity: While a gondola would provide twice the capacity of the shuttle, the shuttle service would generally have adequate capacity to serve future demand growth scenarios resulting from planned Hospital growth. Peak hour conditions under the higher-growth scenario or additional non-Hospital trip growth may strain shuttle capacity and warrant additional demand management strategies (e.g. carpool incentives) or shuttle services.
Service coverage: The shuttle provides door-to-door service to multiple buildings. The gondola drops passengers at the end of the hospital steps, requiring an additional walk to reach individual buildings.
Frequency: The gondola’s 5-minute cycle compares favorably to the shuttle’s 15- to 20-minute cycle. However, gondola walk times to final destinations might make total times closer to equal.
Key study findings include:
In conclusion, following development of the gondola alignment and system concept, demand projections and capital and operating cost estimates and a conceptual evaluation of the shuttle alternative, the study team concludes that the gondola is a less cost-effective solution than developing shuttle and TDM strategies, and does not recommend further study of a gondola concept for the Laguna Honda site.
While the Study confirms that a gondola system is technically feasible, its relatively high capital and operating costs for the short distance at this location makes alternative mobility solutions — such as enhanced shuttle service paired with effective demand management programs — the more cost-effective approach to supporting future growth at the Laguna Hospital and residential development sites at this time.
The Laguna Honda Gondola Feasibility Study was funded through the San Francisco County Transportation Authority's Prop L Sales Tax Development Oriented Transportation program at the request of Transportation Authority Chair and District 7 Commissioner Myrna Melgar.

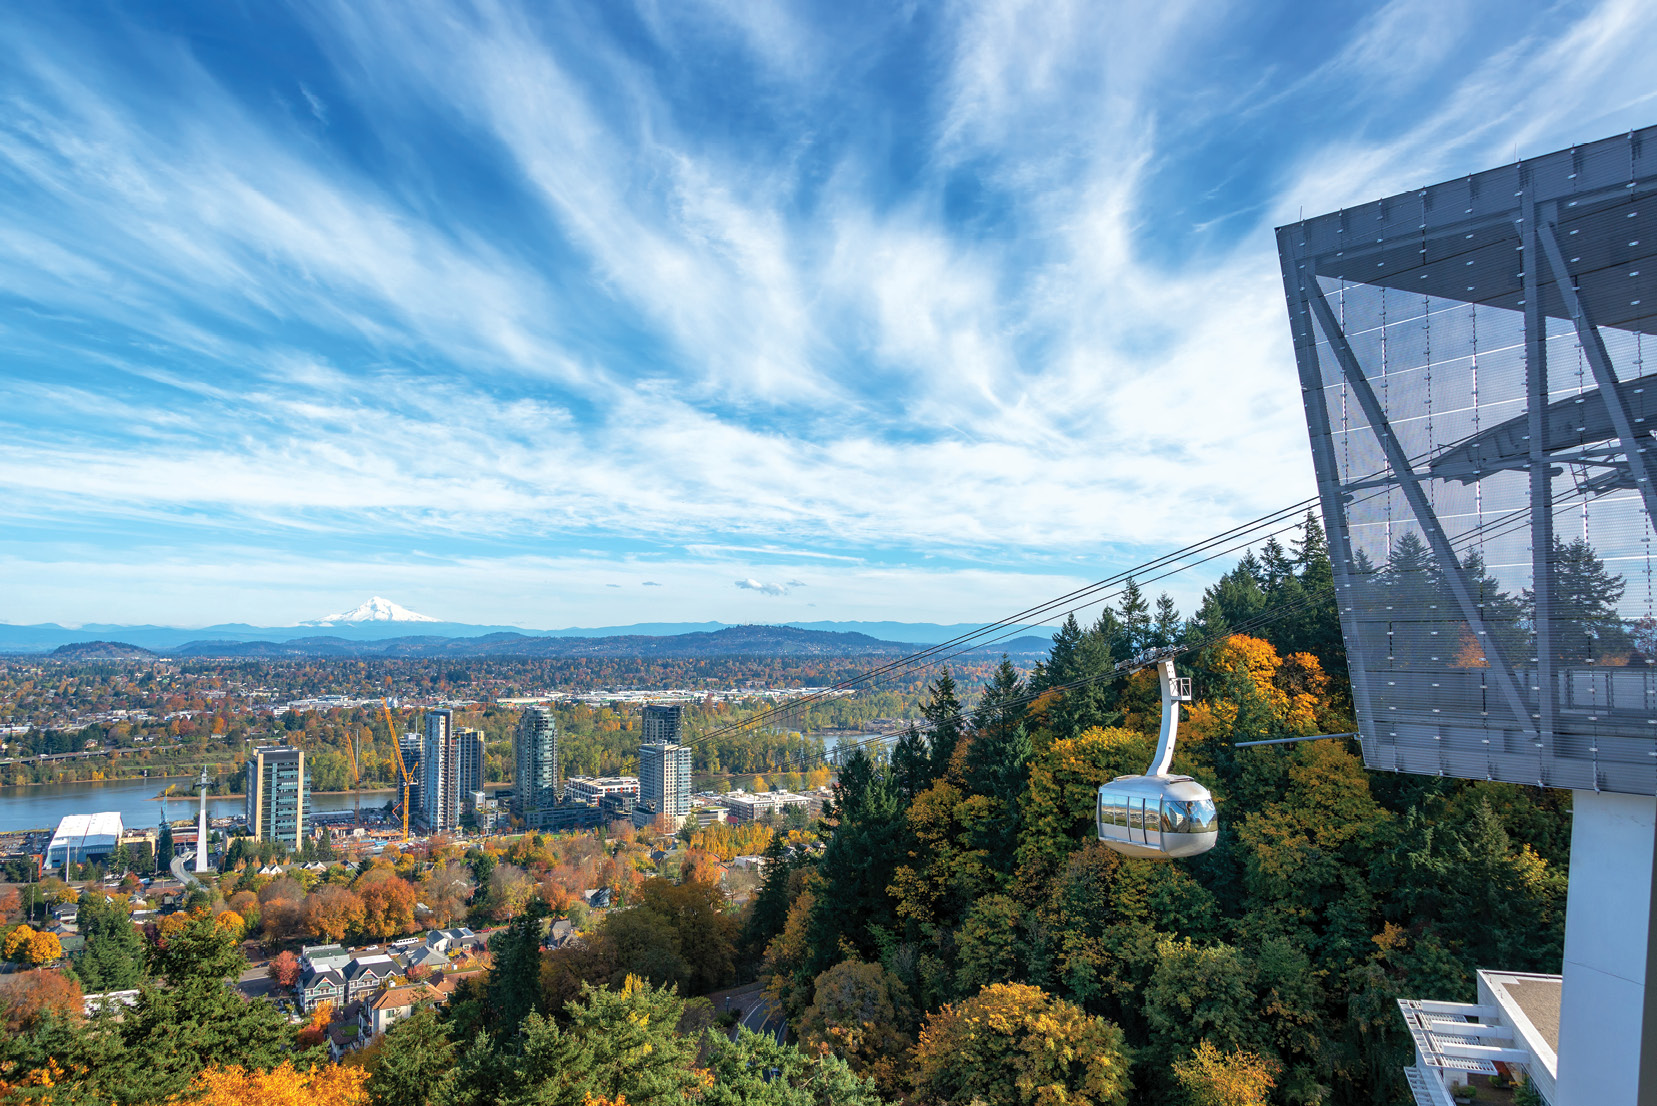
The City of Portland owns and operates an ADA-compliant aerial tram that connects Oregon Health & Science University (OHSU) to the South Waterfront neighborhood. The system spans approximately 3,300 feet and climbs roughly 500 feet in elevation. The lower terminal connects directly to the Portland Streetcar and local bus service, providing integration with the regional transit network. Constructed in 2007, the system cost approximately $57 million and carries approximately 1.4 million riders annually.
Source: Google
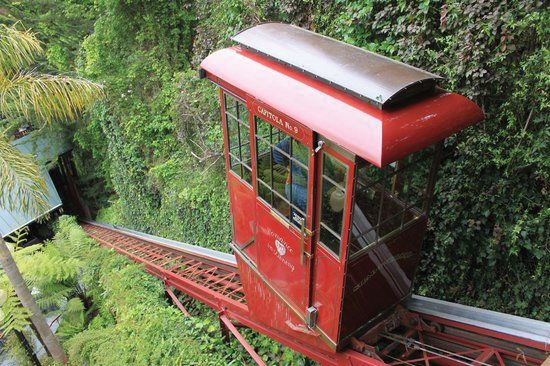
The Hillavator funicular operates over a 120-foot track and climbs approximately 70 feet. The system, opened in 1958, serves the Shadowbrook restaurant in Capitola, California and does not connect to a transit network. While not an aerial system, it demonstrates an alternative approach to navigating steep terrain over short distances.
Source: Google
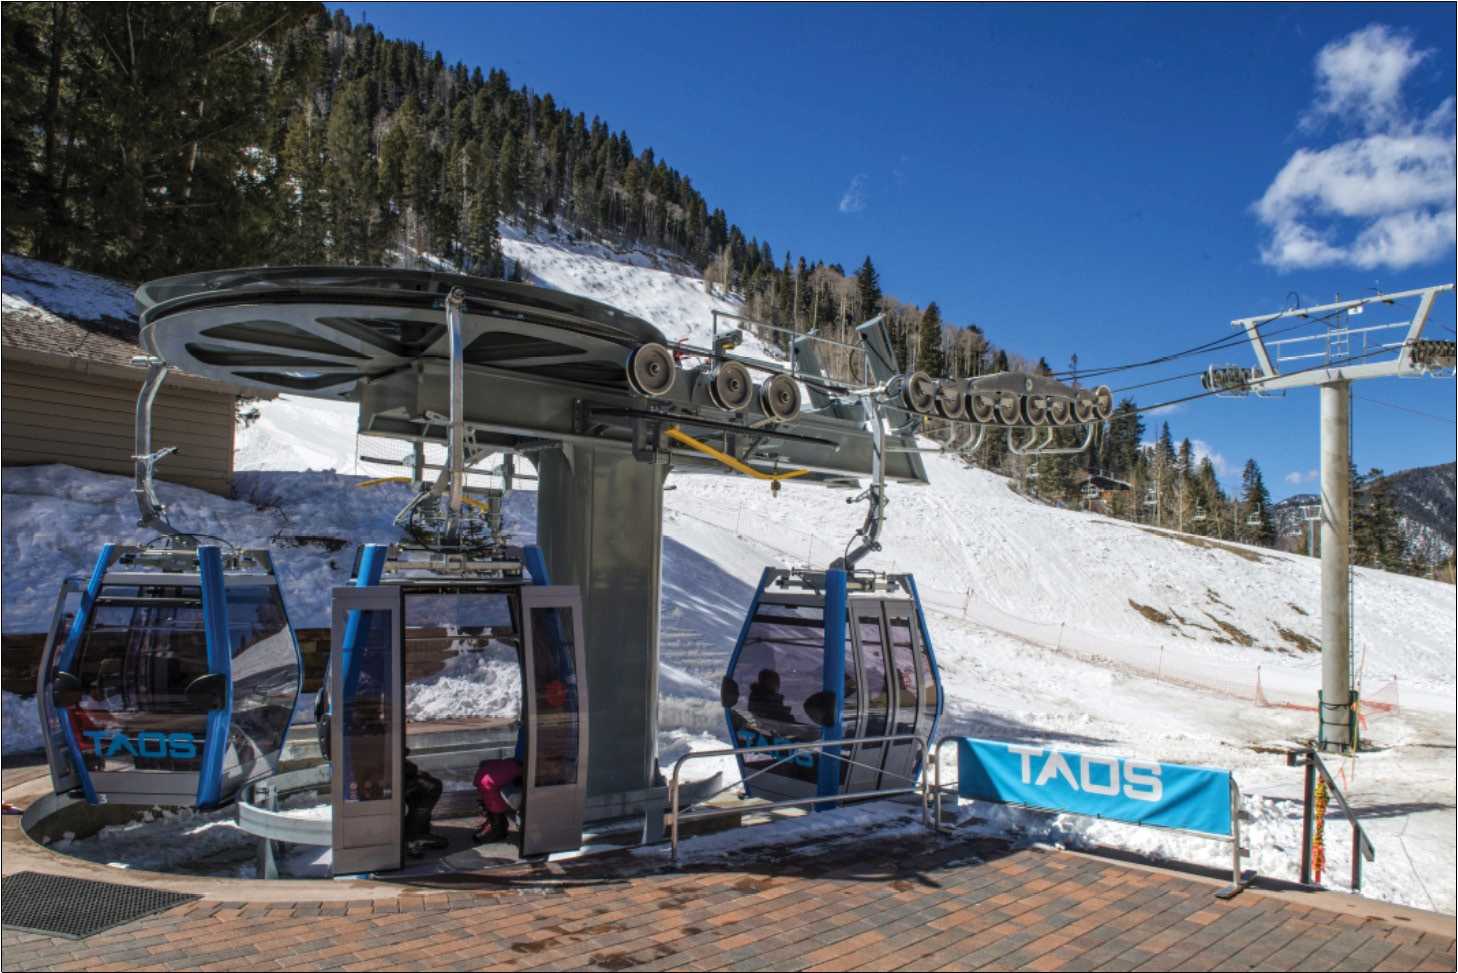
The Town of Taos operates the “Gondolita,” a short ropeway system connecting the Taos Children’s Center to Taos Village. The Gondolita, manufactured by Leitner Poma, was constructed in 2017 and carries six-person diamond shaped cars. The system spans approximately 800 feet and climbs roughly 65 feet. The system does not connect to a broader transit network and primarily serves a localized access function.
Source: Leitner Poma
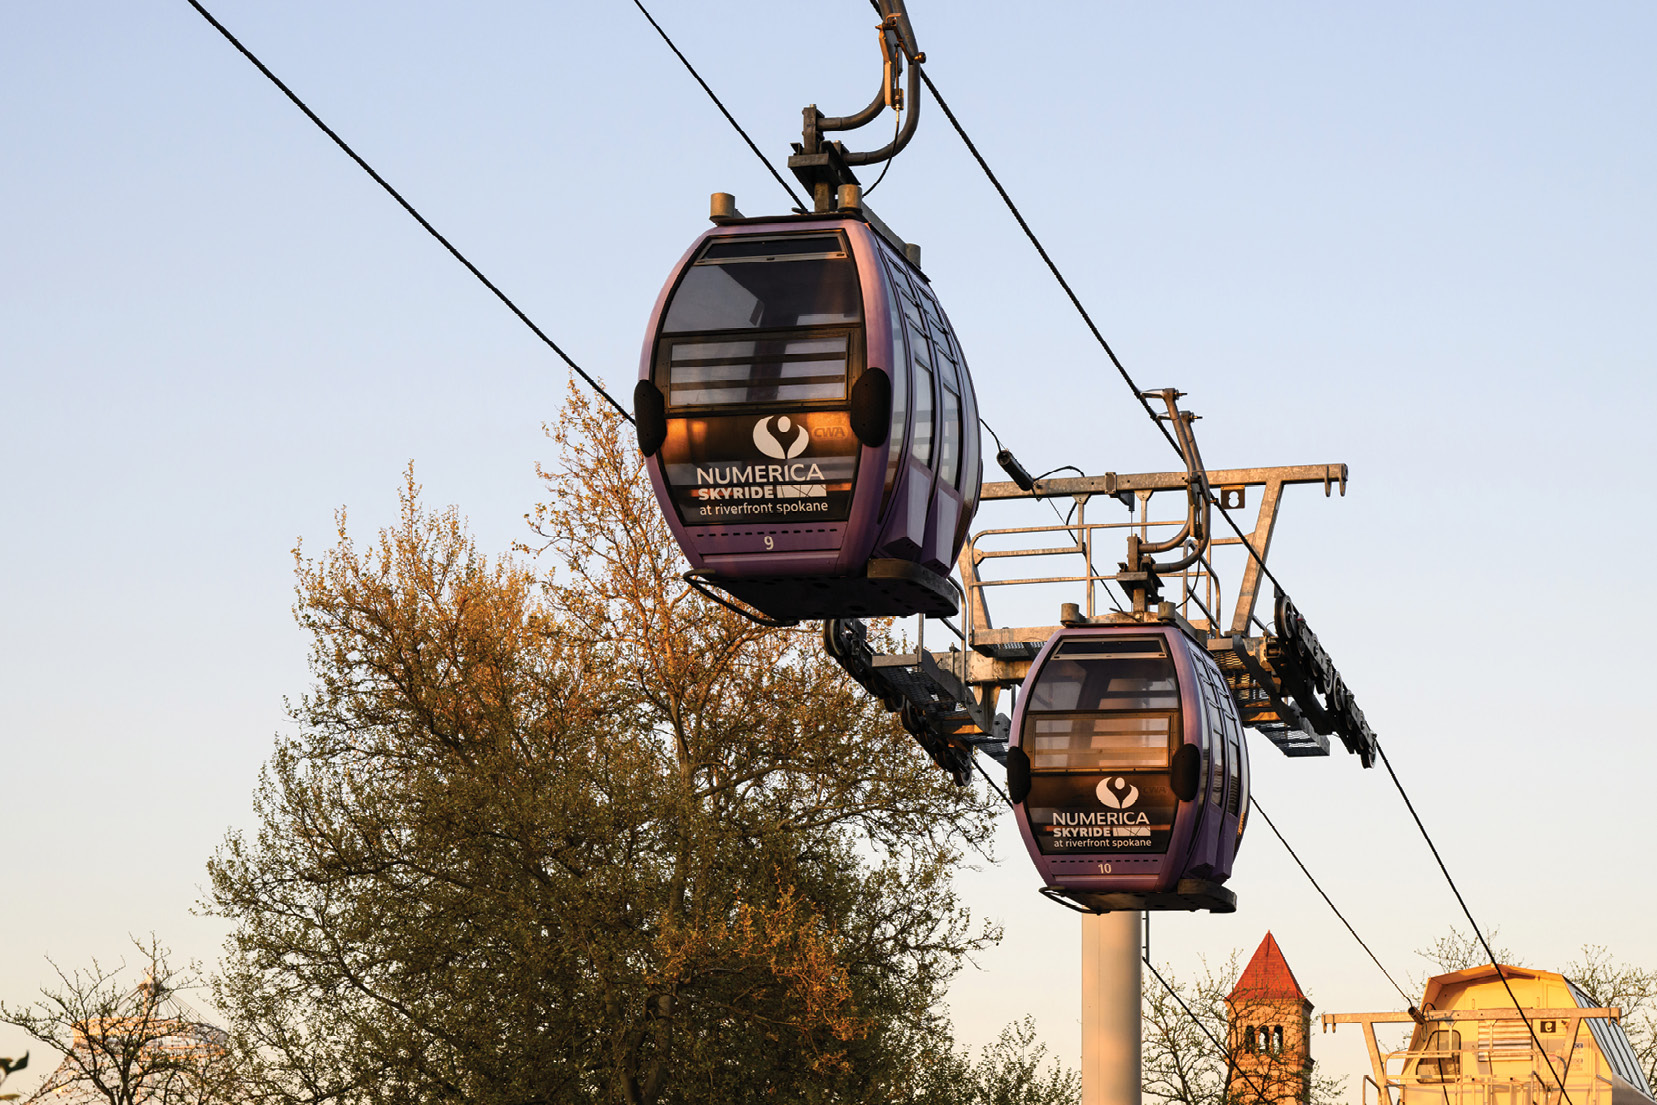
The Numerica SkyRide operates as an aerial cable car system in downtown Spokane. The 15 minute scenic ride descends approximately 200 feet over a river and waterfall. The system primarily serves tourism and does not function as part of the city’s transit network.
Source: Google
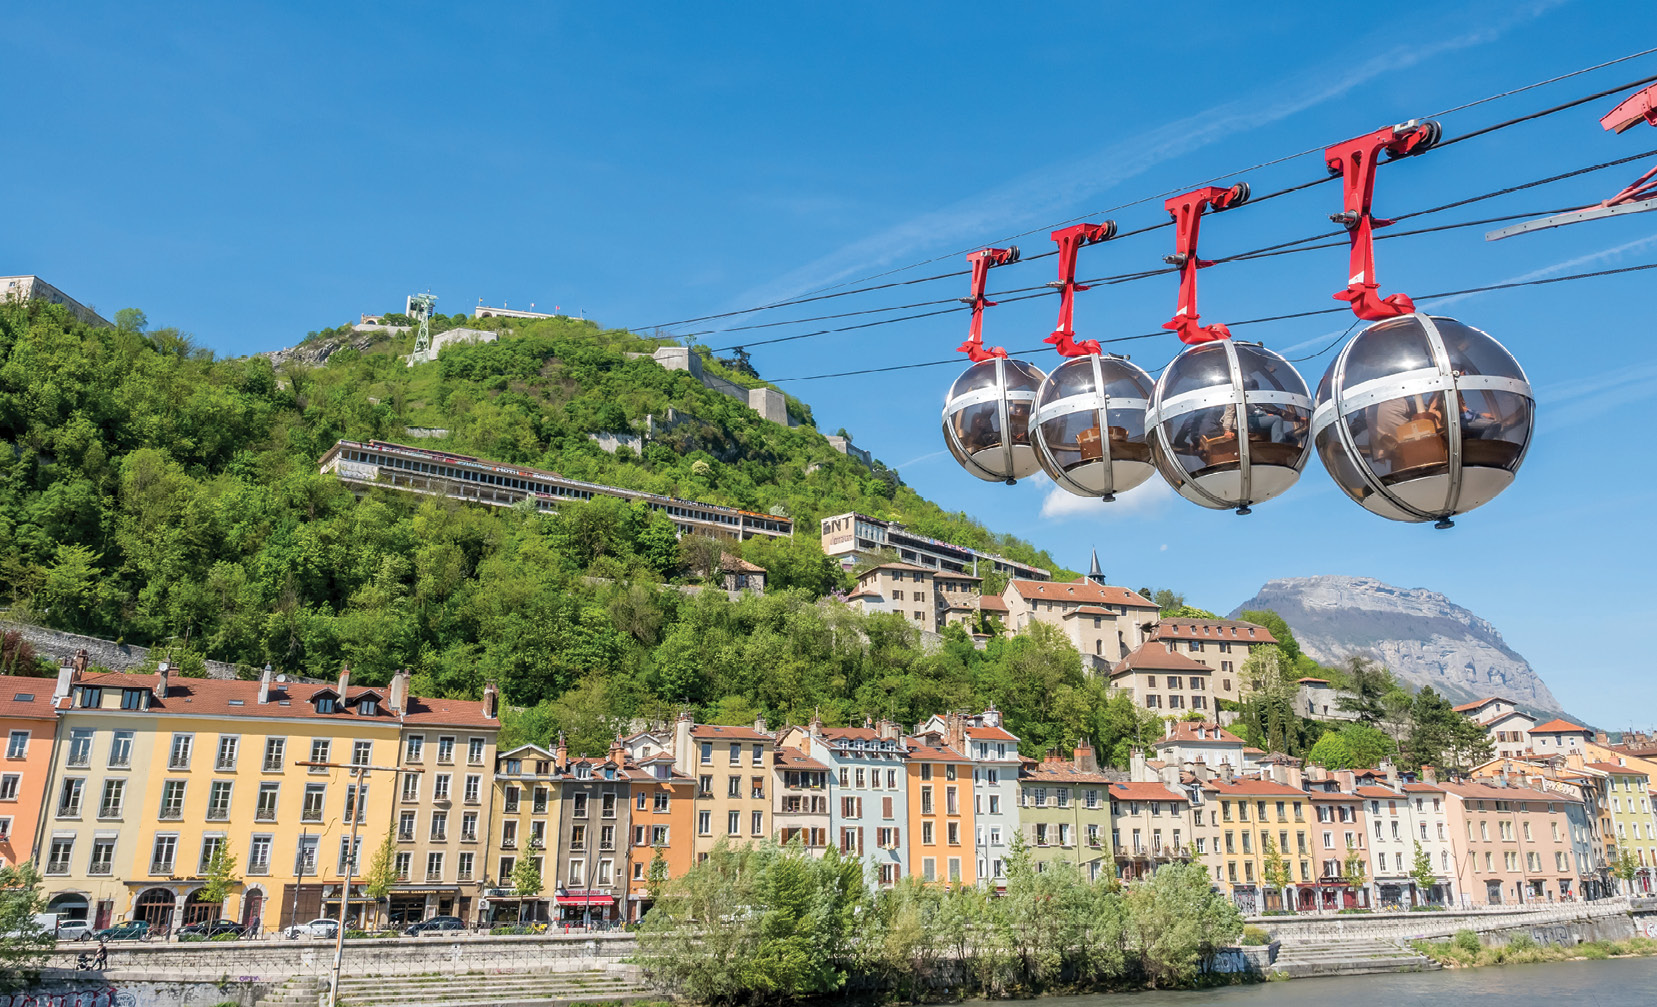
The City of Grenoble operates the Bastille cable car as an urban gondola system connecting the city center to the Fort de la Bastille. The system spans approximately 0.5 miles (2,600 feet) and climbs roughly 860 feet in elevation. While the system primarily serves recreational and tourism trips, it operates as a reliable, high-frequency urban mobility connection with departures every five to ten minutes. The system does not directly connect to a regional rail system but is located within walking distance of transit in the city center.
Source: Google
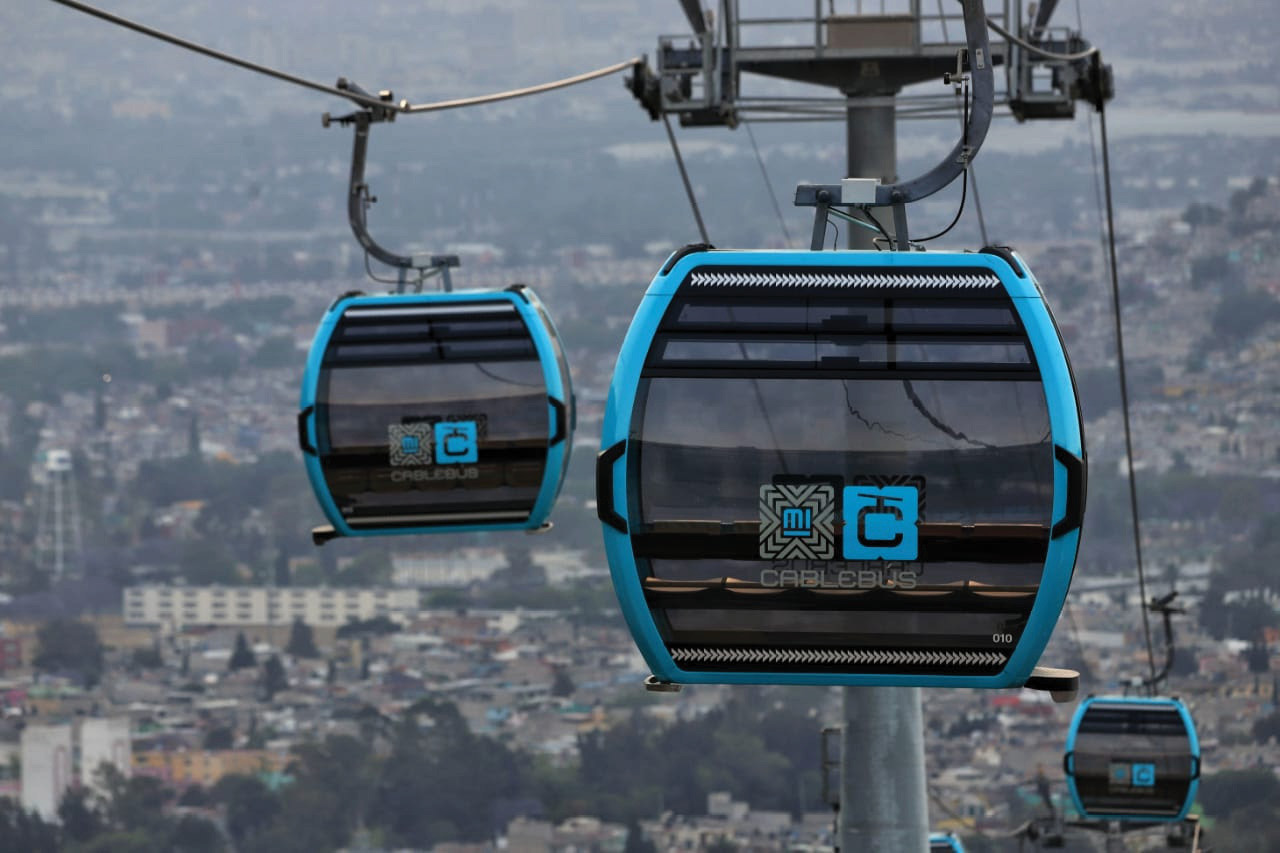
Mexico City operates Cablebús as part of its public transit system. Multiple lines serve dense hillside communities and connect directly to the Metro and Bus Rapid Transit (BRT) network. For example, Line 1 extends approximately 5.7 miles with a vertical rise of over 800 feet. The system operates with high-capacity cabins and frequent service, demonstrating how gondolas can function as a core component of an urban transit network.
Source: Google
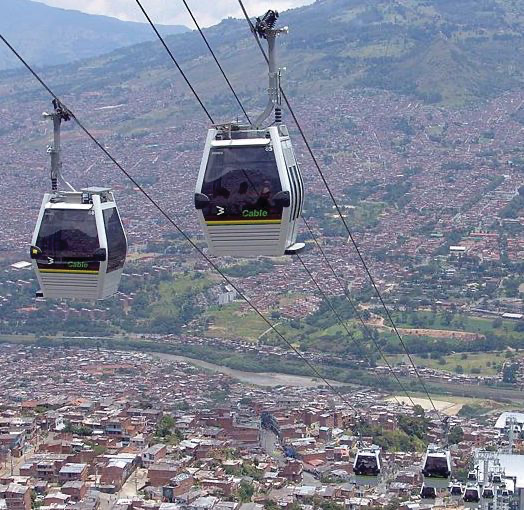
The City of Medellín operates the Metrocable system as an extension of its metro network. The system connects hillside neighborhoods to the Metro system, providing seamless fare and physical integration. Individual lines range from approximately two to four kilometers (6,500 to 13,000 feet) in length, with significant vertical climbs exceeding 1,000 feet in some segments. The system demonstrates how gondolas can improve accessibility and reduce travel times in topographically constrained urban areas.
Source: Google
The San Francisco County Transportation Authority (SFCTA) is exploring the feasibility of an aerial gondola system to enhance mobility and improve first- and last-mile connectivity in the Forest Hill neighborhood of San Francisco. The proposed gondola connection would link the Muni Metro Forest Hill Station (Station) — a key transit hub — with Laguna Honda Hospital and Rehabilitation Center (Hospital), addressing the significant accessibility challenges posed by the area’s steep topography and the heavily trafficked Laguna Honda Boulevard. In addition to serving hospital staff, patients, and visitors, the gondola system is envisioned to improve access to the proposed affordable senior housing development at the Laguna Honda Hospital Campus Replacement Lot (Campus Replacement Lot Project). The Hospital and Station area (Study Area) are defined as the Hospital parcel and Station parcel. The Study Area is shown in Figure B-1.
As part of the broader feasibility study, the Market Assessment aims to evaluate the potential demand for the gondola system by examining existing and projected travel patterns. The Market Assessment considers current ridership patterns and the impact of proposed future developments. The objective is to identify the market for the gondola system and inform key decisions related to alignment alternatives, system capacity, and project viability. This analysis will provide a foundational understanding of how an aerial gondola could contribute to enhanced transit connectivity and equitable access in this part of San Francisco.
Replica, an activity-based travel demand model was used to analyze travel demand trends for trips originating and departing the Study Area. Replica aggregates census data, location-based data (such as connected devices and credit card transactions), and other sources to simulate the complete activities and movements on a typical day.
Replica defines a ‘trip’ as “a movement by a person between places. A trip begins when a person leaves a place and ends when a person stops to do a non-travel activity in a place.”Defined from Replica’s methodology. Therefore, a single person who arrives and then leaves the Study Area in one day will generate two trips. For trip data Replica provides detailed attributes of each simulated trip, including trip time of day, purpose, mode, and the demographics of the trip taker. Replica data for a typical weekday (Thursday) in Fall 2024 (the most recent data release available) was used for this Market Assessment.
Based on Replica’s travel demand data, on any given weekday, it is estimated that there are approximately 6,200 trips going to and from the Study Area. Table B-1 gives the breakdown of trips taken by mode and Figure B-2 shows the percentage of trips by mode.
Replica data also showed that the majority of trips to and from the Study Area, 3,719 trips (60%), originate from and depart to the rest of San Francisco with most trips within the City coming to/from areas north of the Study Area. The second highest number of trips are to/from San Mateo County with 1,160 (19%) daily trips. The third highest number of trips are to/from Contra Costa County with 304 (5%) daily trips. Replica trips by density are represented in Figure B-3.
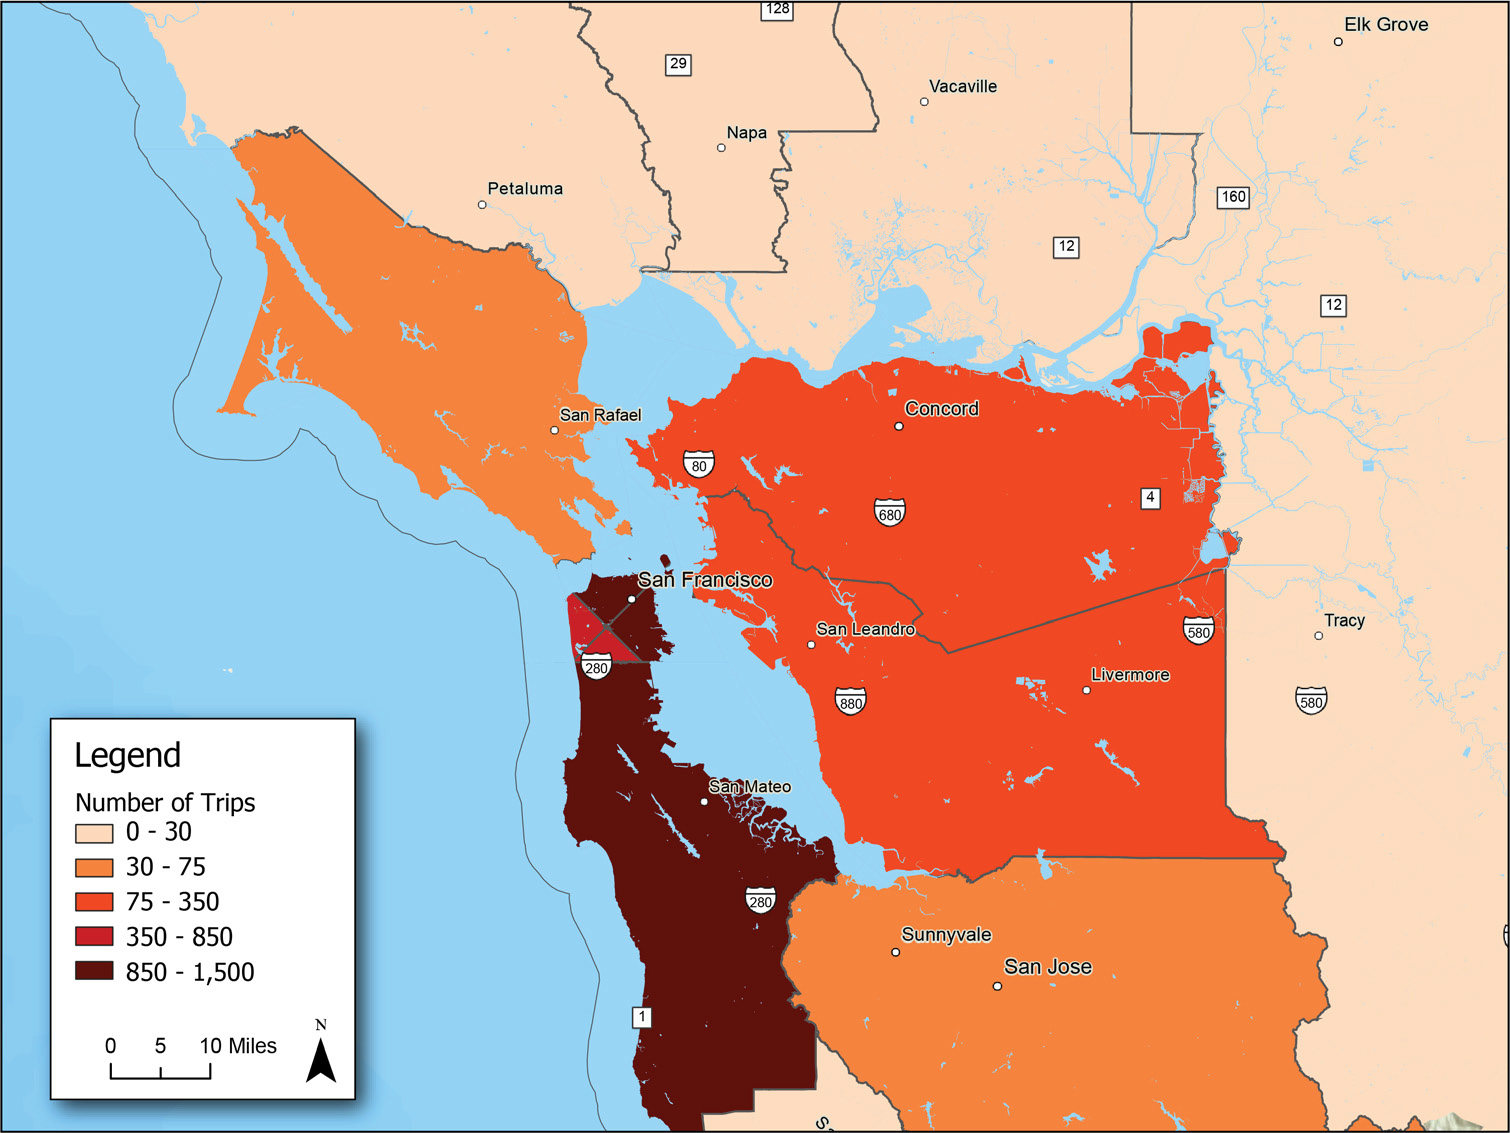
In addition to the number of trips taken to and from the Study Area, Replica was used to estimate the number of people traveling to and from the Study Area. Based on the Replica model, there are estimated to be 1,660 people arriving to the Study Area and 2,110 people leaving from the Study Area on any given weekday. This data is shown in Table B-2. It is expected that people take multiple trips per day (e.g.: one trip to work and another from work), hence the number of trips given in Table B-1 is greater than the number of people given in Table B-2.
|
Total People |
|
|---|---|
|
People Arriving |
1,660 |
|
People Leaving |
2,110 |
Replica also provided the distribution of trips throughout the day. The peak hour for walking and transit trips occurs between 4 p.m. and 5 p.m. when 10% of all walking and transit trips occur (Figure B-4).
San Francisco Municipal Transportation Agency (SFMTA) provided transit ridership data for the Station which is served by the K, L, and M Muni lines. SFMTA also provided ridership data for the bus stops adjacent to the Station which are served by four bus routes — routes 36, 43, 44, and 52. The data contains the average weekday ridership averaged across a time period from March 15th, 2025 to April 14th, 2025. Data is categorized for inbound boardings and alightings and outbound boardings and alightings.
It should be noted that the data provided by SFMTA includes both trips that start and end in the Study Area as well as transfer trips at the Station. Transfer trips (e.g.: between two Muni lines or between a bus and Muni line) will be counted twice — as an alighting from one service and a boarding of another service. SFMTA ridership data is summarized in Table B-3.
Metropolitan Transportation Commission (MTC) provided Clipper Card data for the Muni faregates at the Station. On an average weekday between January 1st, 2025 and June 30th, 2025, there were 1,182 Clipper Cards swiped at the Muni faregates at the Station. Further, it was reported that 474 (approximately 40%) of these trips were internal transfers from Muni, meaning they transferred from one Muni line to another within 120 minutes. It was noted that Clipper’s market penetration on SFMTA is 30%. MTC was unable to provide bus ridership information.
Given that Clipper Card data only accounts for a portion of Muni riders — those that use Clipper Cards — and that data for bus trips could not be provided, this data was considered too incomplete to be a reliable source to estimate demand.
San Francisco Department of Public Health (SFDPH) provided the number of residents and employees at each of the Hospital buildings. Anonymized zip codes for each employee were also provided.
According to the data provided, there are currently 508 residents at the Hospital’s Pavilion building (Pavilion) with room for up to 649 residents. Additionally, there are 1,277 staff members, 737 of which work out of the Pavilion and 540 of which work out of the Administrative building. Table B-4 summarizes the number of residents and staff at each of the Hospital’s buildings and Figure B-4 shows the home location of hospital staff.
SFDPH also provided the number of visitors for July 2025 which was 459.
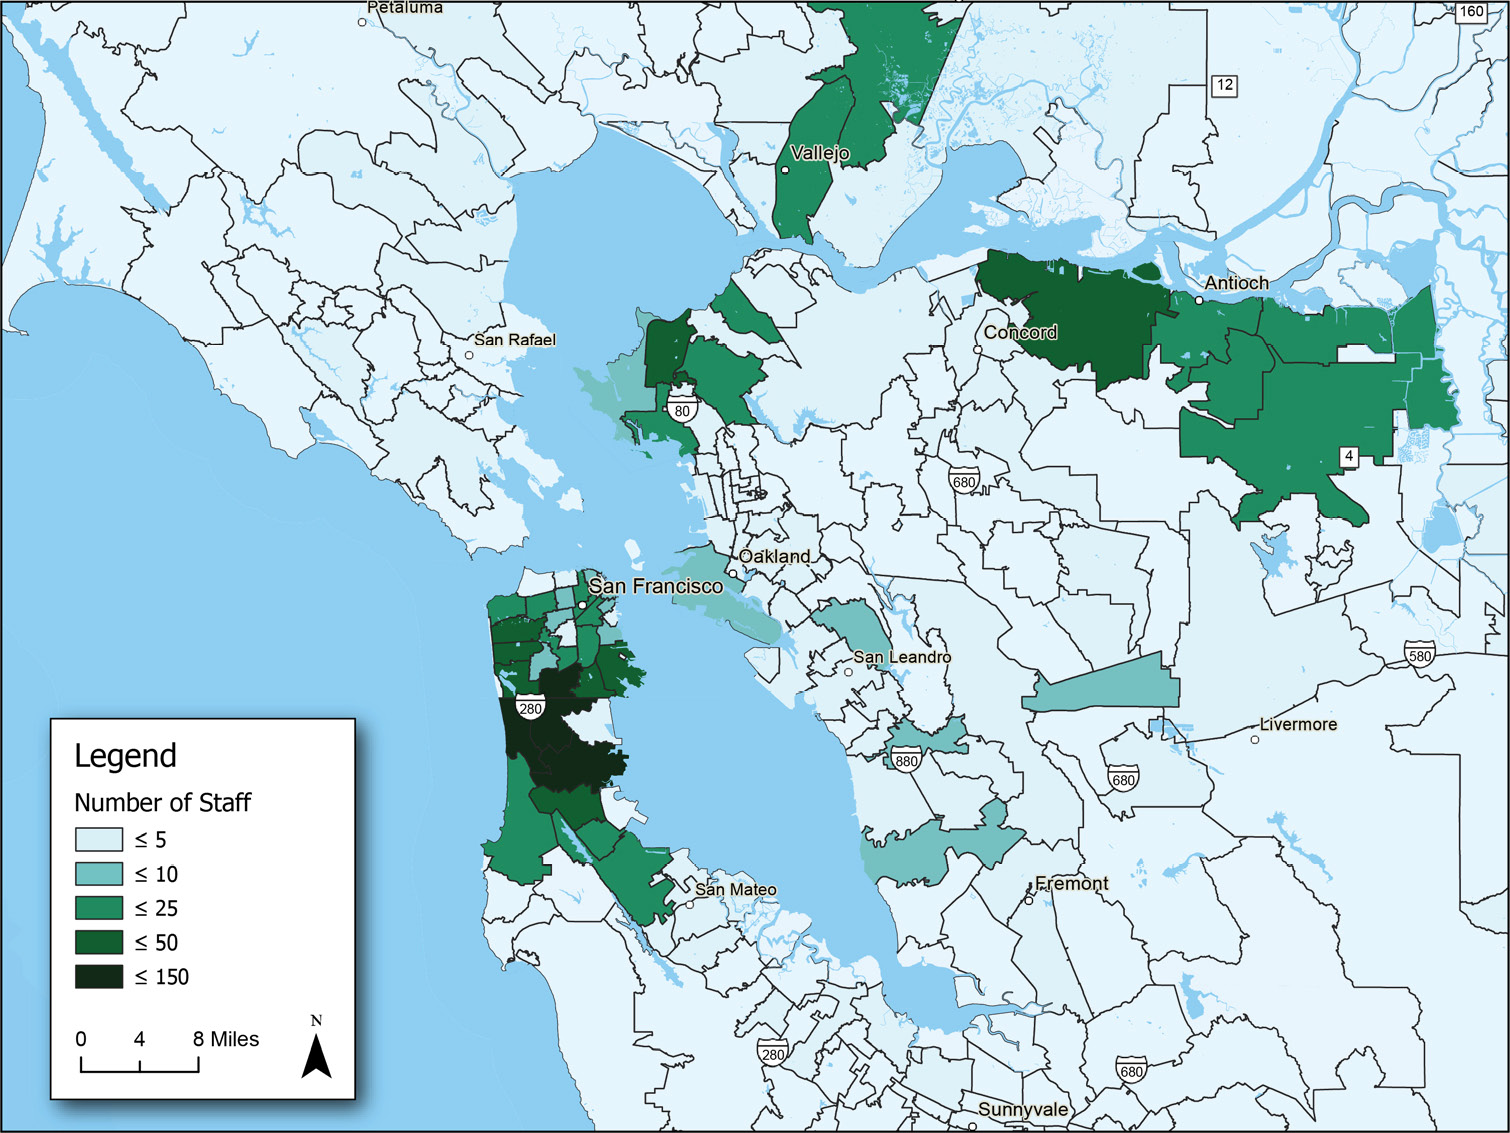
Currently a shuttle operates between the Station and Hospital. The shuttle is operated every weekday between 6:15 a.m. and 5:50 p.m. by two different operators:
SFDPH provided the ridership for the shuttle, as shown in Table B-5.
|
TransMetro |
LHH |
Total Monthly |
Total Daily |
|
|---|---|---|---|---|
|
April 2025 |
731 |
1,672 |
2,403 |
126 |
|
May 2025 |
674 |
1,888 |
2,562 |
128 |
|
June 2025 |
751 |
1,676 |
2,427 |
121 |
There are two proposed developments within the vicinity of the Study Area. One is a senior housing development known as the Campus Replacement Lot Project which is located adjacent to the Pavilion. The Campus Replacement Lot Project is estimated to include between 220 and 260 residential units and will also include a 5,000 SF early childhood center and an 8,000 SF adult day health center. The other proposed development is an affordable housing development planned at 250 Laguna Honda Boulevard which is estimated to include 172 residential units with single, two-bedroom, and three-bedroom layouts.
In addition to the planned developments, an additional 460 SFDPH employees are expected to transfer to the Hospital from other SFDPH sites.
Future land use is identified graphically in Figure B-5 and further details are provided in Table B-6.
The Institute of Transportation Engineer’s (ITE) 11th Edition Trip Generation Manual was used to identify appropriate trip generation rates for future land use developments.
To estimate the potential existing demand for a gondola between the Hospital and Station, a review and analysis of the number and mode of trips to and from the Study Area was undertaken using Replica and SFMTA data.
The data provided by SFMTA differs significantly from the Replica data. SFMTA data indicates that there are 6,817 average weekday transit trips at the Station while Replica data indicates that there are only 561 average weekday transit trips at the Station. Due to the convergence of three separate Muni lines as well as four different bus routes, it is believed that the majority of trips at the Station are transfer trips with no destination in the Study Area. Comparing Replica and SFMTA data, as many as 92% of trips at the Station could be transfer trips (between Muni lines and/or between bus routes and Muni lines). SFMTA was not able to differentiate transfer trips from origin/destination trips but as Replica’s travel demand model is based on trip origin and destination, transfers occurring at the Station are not counted in the model which would explain the large discrepancy. Land use surrounding the Study Area, which is primarily single family dwelling units, supports this theory with the Hospital being the only significant trip generator in the area.
Due to the likelihood of the number of transfers occurring at the Station, existing demand for the gondola was based on Replica data.
Replica data indicates that trips to and from the Study Area are made using a variety of modes with the majority of trips being made by private autos. It is assumed that transit and walking trips would be the most likely users of the proposed gondola. Replica data indicates that 9% of trips are made by public transit and 13% are made by walking. Together this amounts to a total of 1,344 trips on an average weekday. It is recognized that not everyone who walks or takes transit would also take the gondola as people walking may come from many directions, not necessarily only between the Hospital and Station and transit riders may choose to walk. Therefore, it is assumed that between 10% and 20% of walking and transit trips would use the gondola and therefore the existing demand for the proposed gondola is expected to be between 134 and 269 average weekday trips. On the lower end, this is comparable to the current demand for the shuttle which would mean that shuttle trips would convert to gondola trips and on the upper end, the assumption is that 1 in 5 people walking or taking transit would use the shuttle.
To determine the number of trips to and from each Hospital building — Pavilion and Administrative building — occupancy data provided by SFDPH was considered. Of the 1,785 people living or working at the Hospital, 1,245 (70%) are associated with the Pavilion and 540 (30%) are associated with the Administrative building. If the same percentage of people associated with each building is applied to the number of trips, the number of trips to each building can be estimated. There are expected to be more trips to and from the Pavilion compared to the Administrative building.
The existing demand for the gondola in terms of number of trips is provide in Table B-7.
|
Total Trips |
10% Demand |
|
|---|---|---|
|
Weekday Trips |
1,344 |
134 |
|
Peak Hour Trips |
134 |
13 |
|
Pavilion (70%) |
941 |
94 |
|
Administrative Building (30%) |
403 |
40 |
An analysis was also done to estimate the number of people that might use the proposed gondola on an average weekday. Replica estimates that there are 1,660 people arriving to the Study Area on an average weekday. These people are assumed to be hospital staff arriving at work, residents returning from trips outside of the Study Area, and visitors to the Study Area. By applying the same mode split as Replica’s trip data (9% public transit and 13% walking) as well as the assumed gondola capture of 10%, it is estimated that approximately 37 to 73 people will ride the gondola between the Station and the Hospital on an average weekday.
Replica also estimates that there are approximately 2,110 people leaving the Study Area on an average weekday. These people are assumed to be hospital staff heading home from work, residents leaving home to run errands, etc., and visitors to the Study Area returning home. By applying the same mode split as Replica’s trip data (9% public transit and 13% walking) as well as the assumed gondola capture of 10%, approximately 46 to 93 people are estimated to utilize the gondola between the Hospital and Station on an average weekday.
Occupancy data provided by SFPHD was used to estimate the number of people traveling to each Hospital building — Pavilion and Administrative building. Of the 1,785 people living or working at the Hospital, 1,245 (70%) are associated with the Pavilion and 540 (30%) are associated with the Administrative building. If the same percentage of people associated with each building is applied to the number of people using the gondola (i.e. 70% of the 365 people arriving by transit or walking will be associated with the Pavilion), the number of people traveling to and from each building can be estimated. There are expected to be more people traveling to and from the Pavilion compared to the Administrative building.
The existing demand for the gondola in terms of number of people is provided in Table B-8.
Comparing the number of trips with the number of people shows that there are expected to be more trips than people traveling on the gondola. This indicates that some people travelling within the Study Area are expected to take multiple trips per day and will use the gondola to do so. This makes sense as workers and others who make day trips, would make at least two trips per day — one to the Study Area (e.g.: at the beginning of the day when arriving at work) and one from the Study Area (e.g.: at the end of the day to return home).
The two new housing developments — Campus Replacement Lot Project and 250 Laguna Honda Boulevard — and the increase in staff personnel at the Hospital are expected to increase the number of trips to the Study Area and therefore the demand for the gondola in the future.
The Institute of Transportation Engineer’s (ITE) 11th Edition Trip Generation Manual was used to determine the potential future trips that these new developments and increase in population would generate. Estimated trip generation is provided in Table B-9.
Based on the expected future developments, it is estimated that almost 3,900 additional trips would be generated around the Study Area. It is assumed that the residents of 250 Laguna Honda Boulevard would not require regular access to the Hospital and therefore the demand for the gondola from this group is expected to be minimal and is removed from the future demand. Additionally, the early childhood center and adult day health center are assumed to be used by those already at the Hospital (hospital residents, staff, visitors, etc.). Therefore, these facilities are not expected to generate additional trips.
Removing those land uses results in an additional 2,768 trips. The travel patterns defined above for transit and walking (9% and 13% respectively) are applied to estimate future trip demand for the gondola as well as the expected capture of between 10% and 20%. Therefore, an additional demand of 61 to 122 average weekday gondola trips is estimated. Combined with the existing trips, the future demand for the gondola is estimated to be between 195 and 391 average weekday trips.
The future demand for each Hospital building — Pavilion and Administrative building — was determined by adding the existing demand at each building, which is equivalent to the existing number of people at each building, to the future number of people expected at each building based on the size and location of proposed future developments.
For the Pavilion, the Campus Replacement Lot Project is adjacent and would therefore increase the number of people and hence demand at the Pavilion. The 240 units of this development, which are assumed to amount to 240 residents, were added to the existing staff and resident population of the Pavilion (1,245). The new future estimate for the number of people associated with the Pavilion is therefore 1,485 people.
All 460 relocated SFDPH staff members will be associated with the Administrative building. Combined with the current 540 staff members working there, it is estimated that in the future1,000 people will be associated with the Administrative building.
If the percentage of people associated with each building (60% for the Pavilion, 40% for the Administrative building) is applied to the number of trips, the number of trips to each building can be estimated as seen in Table B-10. Therefore, in the future, there are expected to be more trips to and from the Pavilion compared to the Administrative building.
As noted previously, the adult day health center and 250 Laguna Boulevard development were excluded from the analysis as they are not expected to increase demand for the gondola.
The Campus Replacement Lot Project is estimated to have 240 new units. To convert the number of units to people, it was assumed that one person would be assigned to each unit. The early childhood center is expected to accommodate 40 childrenSenior Affordable Housing at Laguna Honda Hospital Campus, Presentation to the San Francisco Health Commission, February 3, 2025. California regulations mandate that for supervising children between the ages of two and six, one adult staff member is needed per 12 childrenRegulation and Licensing of Child Care Programs In California which would mean that 44 people (40 children and 4 staff) are expected at the early childhood center. Therefore, the Campus Replacement Lot Project is expected to bring an additional 284 people to the Study Area.
Additionally, as noted previously, there are 460 SFDPH staff members who are being relocated to the Hospital, all of which will be located in the Administrative building.
Together, the new developments total 744 people that are expected to reside or visit the Study Area on an average weekday. Adding these new people to the existing people and applying the existing mode share and proposed capture rate of the gondola results in between 53 and 106 people using the gondola to travel between the Station and Hospital on an average weekday and between 63 and 126 people using the gondola to travel between the Hospital and Station on an average weekday. The split of people expected to visit the Pavilion versus the Administrative building (as described in the previous section) is shown in Table B-10.
Comparing the future number of trips with the future number of people shows that there are expected to be more trips than people traveling on the gondola. This indicates that some people traveling within the Study Area are expected to take multiple trips per day and will use the gondola to do so. This makes sense as workers and others who make day trips, would make at least two trips per day — one to the Study Area (e.g.: at the beginning of the day when arriving at work) and one from the Study Area (e.g.: at the end of the day to return home).
This Market Assessment shows the existing and future demand for a gondola system, with existing demand being driven by existing hospital staff, residents, and visitors and future demand being driven by future hospital staff and residents of planned developments.
Using Replica data and assuming that between 10% and 20% of transit and walking trips would potentially be users of the gondola, the existing demand for the gondola is 134 and 269 average weekday trips. The demand is expected to increase by between 61 and 122 trips, to a total of between 195 and 391 average weekday trips, with the addition of planned residential developments and increase in hospital staff. 10% of these trips, or between 20 and 39 trips, are expected to occur within the peak hour.
Similarly, Replica estimated that with existing demand the gondola may be expected to service between 37 and 73 people arriving at the Hospital and between 46 and 93 people leaving the Hospital on an average weekday. With the additional planned residential developments and increase in hospital staff the demand is expected to increase to between 53 and 106 people arriving at the Hospital and between 63 and 126 people leaving the Hospital on an average weekday.
The estimated existing and future demand for the gondola is summarized in Table B-12. The analysis shows that there is greater demand at the Pavilion compared to the Administrative building.
The next phase of the Study will focus on further technical evaluation of potential alignment alternatives and assessment of capital and operating costs to inform the selection of a preferred alternative and support future funding opportunities.
 Download a PDF of this report