Image
This report summarizes the work conducted for the District 4 Community Shuttle Study, which explored the potential for developing a public on-demand shuttle to improve access to commercial corridors and key destinations within San Francisco’s District 4. The effort builds on a recommendation from the San Francisco County Transportation Authority’s (Transportation Authority) 2021 “District 4 Mobility Study” to consider designing and piloting an on-demand shuttle to better serve local travel needs and reduce automobile mode share. The purpose of the study was to define an on-demand microtransit service within District 4 by identifying feasible service models and establishing the operational requirements necessary for successful implementation. The study also included an assessment of operating costs and the development of a preliminary funding strategy. This report’s findings refer to the design and operation of a pilot service, except where discussion of a permanent service is indicated.
The study conducted industry research on comparable services in other U.S. cities and detailed interviews with a selected subset of peers to learn more about their service design, local demand profile, operating parameters, and cost structures. The San Francisco Municipal Transportation Agency (SFMTA) also launched a pilot for an on-demand shuttle in the Bayview-Hunters Point neighborhood in November 2024, and early findings from this pilot are included into the design of the pilot.
The study identified a need for more competitive transit alternatives to automobile travel within the district. Although transit services are offered throughout the district, constraints such as access time, required transfers, and total travel times make transit much less competitive than private vehicles for intra-district travel. The analysis showed that an on-demand shuttle could be a good solution for these intra district trips, given its land use and density, which is higher than the service areas of many successful peers. Preliminary ridership estimates suggest that an on-demand shuttle could attract close to 100,000 customers per year.
Like other peer on-demand services, the proposed service design would use a small van or mini-bus vehicle that picks up customers from the intersections nearest to their origin and destination, with door-to-door service for seniors and customers with disabilities. Vehicles would stop to pick-up and drop-off other customers headed in the same direction along the way. The service area for the shuttle would comprise the totality of District 4 plus the area around Stonestown Galleria and San Francisco State University. The operating parameters could include up to 16 hours of service each weekday and up to 12 hours of service on weekends and holidays. Fares would match current Muni fares and could potentially be collected via Clipper to make it easier for customers to start using the service.
The Transportation Authority conducted public outreach to confirm the shuttle’s goals and objectives to guide the development of the shuttle, and to validate whether this type of service would fit those needs. District residents and businesses voiced the desire for alternatives to driving to access commercial corridors and support the mobility needs of seniors and people with disabilities. Feedback from the outreach process was also used to refine the proposed operating parameters. Following completion of the service design, the Transportation Authority conducted additional outreach, during which community members conveyed broad support for the proposed service framework. Some even indicated willingness to pay a premium fare for the microtransit service.
Most peer on-demand services in operation today begin as a short-term pilot, often operated under contract with a third-party vendor. The pilot approach provides the opportunity to adjust the service plan in response to initial performance, and time to evaluate its performance against goals and metrics, in order to inform the case for a permanent service. The pilot described in this report would include one year of shuttle operations, bracketed by about nine months of pre-launch preparations for procurement, contracting, and marketing the service, plus three months after operations conclude to wrap up evaluation and reporting activities.
The operating costs for the shuttle could vary depending on several key factors, including the labor arrangements for drivers, the type and size of vehicle used for the service, and the level of service offered.
To reflect these uncertainties, the study reports a range of unit costs based on labor and vehicle type assumptions and using input data from an analysis of contracts from selected peer agencies. The peer costs were modified to account for inflation and the higher cost of living in San Francisco, resulting in an estimated hourly cost for the shuttle in the range of $97 to $117 per vehicle hour. Applied to the planned operating parameters, this would result in an operating cost of $2.5 million to $3.0 million per year. Adding in agency staffing and marketing expenditures, the total cost of a two-year pilot could total $3.1 million to $3.6 million. These costs could also be scaled to available budgets, e.g. start with weekend service or a shorter span of service, if less than full funding is secured.
The study finds that a District 4 shuttle pilot would likely require a combination of funding sources to complement a small amount of project revenues from operations (e.g. fares, advertising) estimated to cover ~4% of pilot costs. The options that appear to have the greatest potential to cover the majority of the costs are state community-directed funding (e.g. earmarks ) identified through the legislative budget. A second source may be local public sources, such as Transportation Authority administered grants such as Prop L sales tax or the City’s General Fund. Other options for funding the pilot period may include sponsorships or business partnerships.
The pilot would test both mobility performance outcomes and explore stakeholder level of support around the project’s importance and long-term value to the community. If a pilot performs well and is recommended for permanent service, then other revenue sources could be considered that take a longer lead time to develop and that would benefit from the learnings and support generated by the pilot. Examples include forming a Business Improvement District (BID), Community Benefit District (CBD), or Parking Benefit District (PBD), establishing or furthering sponsorships and other business partnerships, or including the project in transit enhancement programs funded by a new revenue measure.
Finally, this report proposes a general framework with specific goals, including enhancing local mobility, improving transit coverage, and delivering a cost-efficient service, with associated metrics to evaluate the success of the pilot in the district. Peer agencies generally recommended the success of the service is measure more with an emphasis on the project’s impact on improving mobility in key market.
In conclusion, this study identifies a community-responsive potential service model and the operational considerations for a pilot of an on-demand microtransit service within District 4. The study also recommends pursing funding for a pilot service and includes an estimate of operating costs and an assessment of funding options.
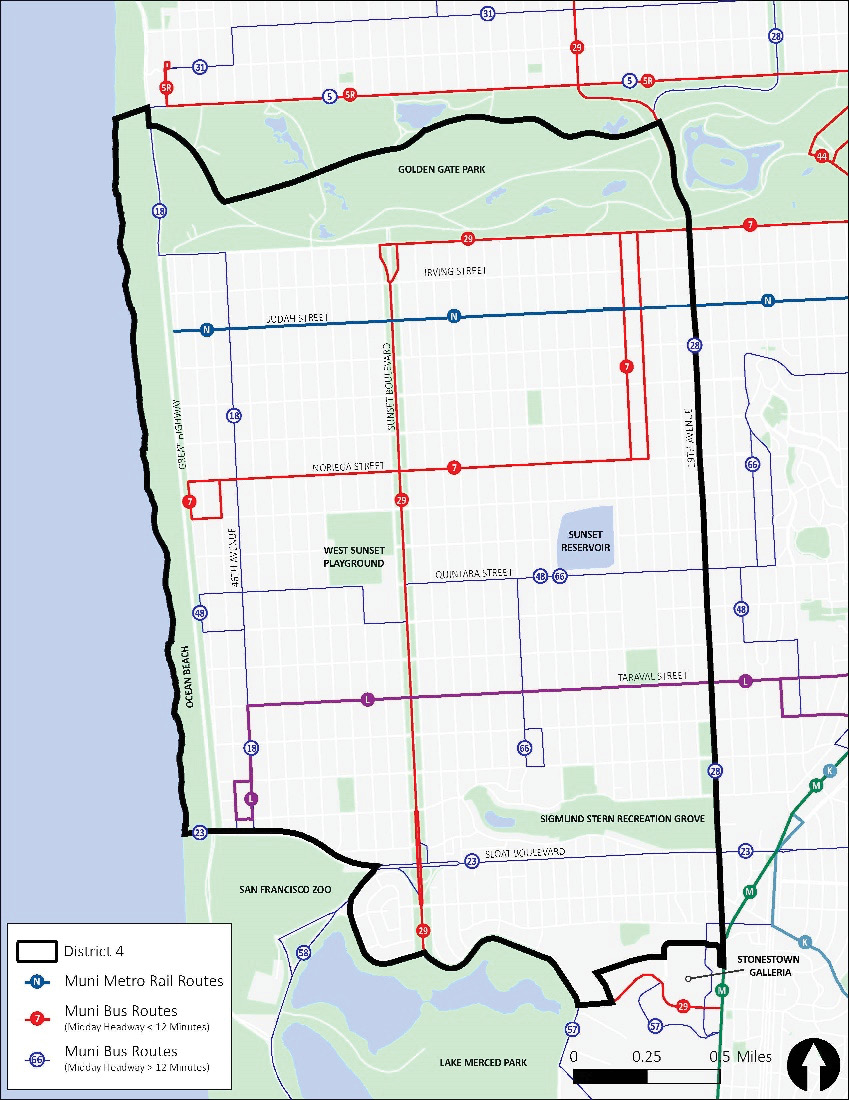
San Francisco’s District 4 is approximately five square miles in area. The district is bounded by John F Kennedy Drive to the north, 19th Avenue to the east, Buckingham Way/Winston Drive/Lake Merced Boulevard/Sloat Boulevard to the south, and Great Highway/Pacific Ocean to the west, as is shown in Figure 2-1 below. The district is home to approximately 85,500 residents. The average population density is 17,448 people per square mile, which is slightly lower than the density for the city as a whole. The district has a slightly higher proportion of seniors (23% vs. 19%) and about the same proportion of residents with disabilities (~10%) compared to the overall city.
Job density in the district is much lower than the citywide average at only 2,662 jobs per square mile. Land uses in the district are primarily residential and recreational except for a few key commercial corridors on Irving Street and Taraval Street. The nearest major shopping center is Stonestown Galleria, located just south of the district boundary, and there are smaller shopping districts located east of the district in the Inner Sunset and West Portal neighborhoods. Several recreational destinations are located within or immediately adjacent to the district, including Stern Grove, Ocean Beach, Golden Gate Park, and the San Francisco Zoo. Other key destinations, such as schools and community centers, are distributed evenly throughout the district.
The dominant mode of travel in the district is private automobile; over 60% of trips within the district are made via single-occupancy vehicle (SOV) or carpool. Only 10% of district households do not have a car, a much lower share than the citywide average of over 30%. Fixed route transit service in the district is provided by SFMTA and currently includes seven local bus lines (7, 18, 28, 29, 23, 48, and 66), one rapid bus line (28R), the L Taraval bus, and the N Judah light rail line. Of these lines, only the 29, L Taraval, and N Judah are scheduled to arrive at 10-minute frequencies during weekday peak periods; other services have longer headways. Appendix C contains more information on the population, demographics, and travel patterns of the district.
The most significant recent analysis of transportation needs in the district was the “District 4 Mobility Study,” which was completed in September 2022. The motivation for the study was to develop transportation investment options that improve livability, health and safety, and the local economy within the district. The study drew upon and synthesized almost a decade of prior planning efforts and included analysis of trips within the district and its adjacent neighborhoods as well as trips to destinations much further away in San Mateo County and the East Bay.
For trips originating in the district, the largest travel market was destinations that are also within the district (19% of all trips). The second biggest travel market was San Mateo County (12%), followed by the Richmond District neighborhood immediately to the north of the district (10%); no other travel market exceeded 10% of trips. Within the district, the analysis showed an unusually high mode share for SOVs and a low mode share for transit. For example, the transit mode share was 11% for all district trips, but only 4% for intra-district trips. Surveys and other public outreach indicated that residents who drive do so because they want faster travel times, increased reliability, and/or greater convenience than transit offers, and they often need to carry large items or make multiple stops.
To help address these gaps, the study proposed a variety of recommendations ranging from streetscape improvements that prioritize non-motorized uses to major expansion and reconfiguration of transit service within and through the district. In addition, the concept of an on-demand shuttle emerged as a key strategy to improve access and safety on key commercial corridors. In particular, the shuttle was envisioned as an alternative to driving that would fill in gaps in existing transit service to help residents access commercial corridors and major transit connections.
The study recommended further exploration of the shuttle and the potential launch of a pilot to test the viability and performance of such a service. The pilot would help validate ridership demand for a shuttle, and it would allow for evaluation and outreach before commitment to a new service.
Building on the recommendations of the District 4 Mobility Study, the Transportation Authority Board allocated funding through the Neighborhood Transportation Improvement Program (NTIP) to develop a Planning Phase Study for a District 4 on-demand shuttle, initiated at the request of former Commissioner Gordon Mar. The study is intended to define an on-demand microtransit service within District 4 by identifying feasible service models and establishing the operational requirements necessary for successful implementation. This phase also includes an assessment of operating costs and the development of a preliminary funding strategy. This report presents the findings and outcomes of that study.
On-demand shuttle services, also referred to as microtransit, have been deployed in various forms across the country. Many of these services began as pilot programs, some have since transitioned into permanent operations, while others were discontinued after the pilot phase. Transit agencies and municipalities pursue on-demand service models for a range of reasons, including replacing low-ridership fixed routes, providing first/last-mile connections to the fixed-route network, and expanding transit coverage in lower-density areas or neighborhoods with limited street connectivity. In many cases, on-demand services have also proven effective in addressing equity needs by improving mobility options for seniors, low-income residents, and people with disabilities. Several agencies use on-demand services to complement fixed-route transit by accommodating trips not well served by existing routes. For example, such services can provide needed east-west connections in areas dominated by north-south routes, or enhance access to neighborhoods with limited fixed-route coverage where buses are infrequent, overcrowded, or unreliable.
The concept of on-demand transit has existed for many years. Traditionally, it has been used to meet the mobility needs of specific populations, most notably through paratransit services that employ specialized vehicles to serve customers with disabilities who may have difficulty using the fixed-route network. Some smaller transit agencies, such as Dixon Readi-Ride in Solano County, operate entirely on a Dial-A-Ride model rather than maintaining fixed routes with scheduled arrivals and departures. Another long-standing example of on-demand transit is the deviated fixed-route service model, in which customers can request pick-ups or drop-offs within a designated distance of a scheduled transit route.
Historically, many of these services have required customers to book their desired trip as much as a day in advance to allow schedulers to coordinate trip requests into daily vehicle routings. More recently, new software technologies have improved the ability for transit providers to dispatch, route, and re-route vehicles in real time. These “dynamic routing” technologies were initially popularized by the private Transportation Network Companies (TNC), such as Uber and Lyft. Over the past decade, public transit agencies have increasingly adopted similar systems, enabling customers to request rides and be picked up within minutes rather than waiting until the next day.
The key features of this on-demand service model include:
Examples of on-demand services in the Bay Area include:
To better understand on-demand transit and evaluate its applicability in District 4, this study conducted an industry review of a wide range of on-demand services operating in other U.S. cities. A total of 25 on-demand shuttle services were analyzed, identified through a combination of literature review and expert input to capture a broad spectrum of service models. Project information was gathered from public reports and available online data to assess key characteristics of the modality, industry trends, and lessons relevant to the District 4 context. The review documented factors such as location, lead agency, service concept, implementation strategy, and service status. Of the 25 services reviewed, 10 were located in California and 15 elsewhere in the United States. Two of the services followed fixed-route models, three involved partnerships with TNCs or taxi providers to subsidize rides, and the remaining 20 offered more conventional on-demand microtransit operations. Many of these programs were first launched in 2015 or 2016, reflecting nearly a decade of concept evolution and refinement from pilot projects to sustained, ongoing services.
The on-demand services explored during the industry research process shared the following characteristics:
Additional information was collected on each service’s operating model, typical ridership, and estimated operating costs. Of the 23 services still in operation when the research was conducted, 14 provided usable ridership estimates. After standardizing these figures for comparison, annual ridership levels were found to vary widely — from approximately 15,000 to 250,000 customers per year — reflecting the diversity in service scale and context. More detailed findings from the peer research are presented in Appendix A.
Following the completion of the industry research phase, eight peer services were selected for a more in-depth review of their on-demand shuttle programs. These services were selected because specific aspects of their service design and implementation were considered highly relevant to the District 4 context. The selected peers include:
These peer reviews combined in-depth interviews with project leads from the selected agencies and a thorough examination of available reports, data, and operational materials. The objective was to identify the key factors that influence the planning, implementation, and long-term success of on-demand shuttle services. Through this process, the study examined how service design, operational strategies, and local context affect performance and public acceptance. The findings highlight common practices and lessons learned across peer agencies, providing valuable insights for shaping a potential District 4 service model. The main conclusions are summarized below, with additional detail and individual agency profiles provided in Appendix B.
Building on the findings from the District 4 Mobility Study, this study conducted additional research on local demographics and travel patterns to further assess the need for an on-demand shuttle service. The analysis integrates insights from the industry research and peer review efforts to inform the service design and recommendations.
A review of available transit service in the district provides additional insight into the low transit mode share observed. As shown in Figure 4-1, most District 4 residents live within a quarter mile (green buffer) — roughly a seven-minute walk for a healthy, able-bodied person — of a transit stop, suggesting generally good transit coverage. However, a closer examination of how the existing network serves intra-district trips reveals several inefficiencies that may be discouraging potential riders.
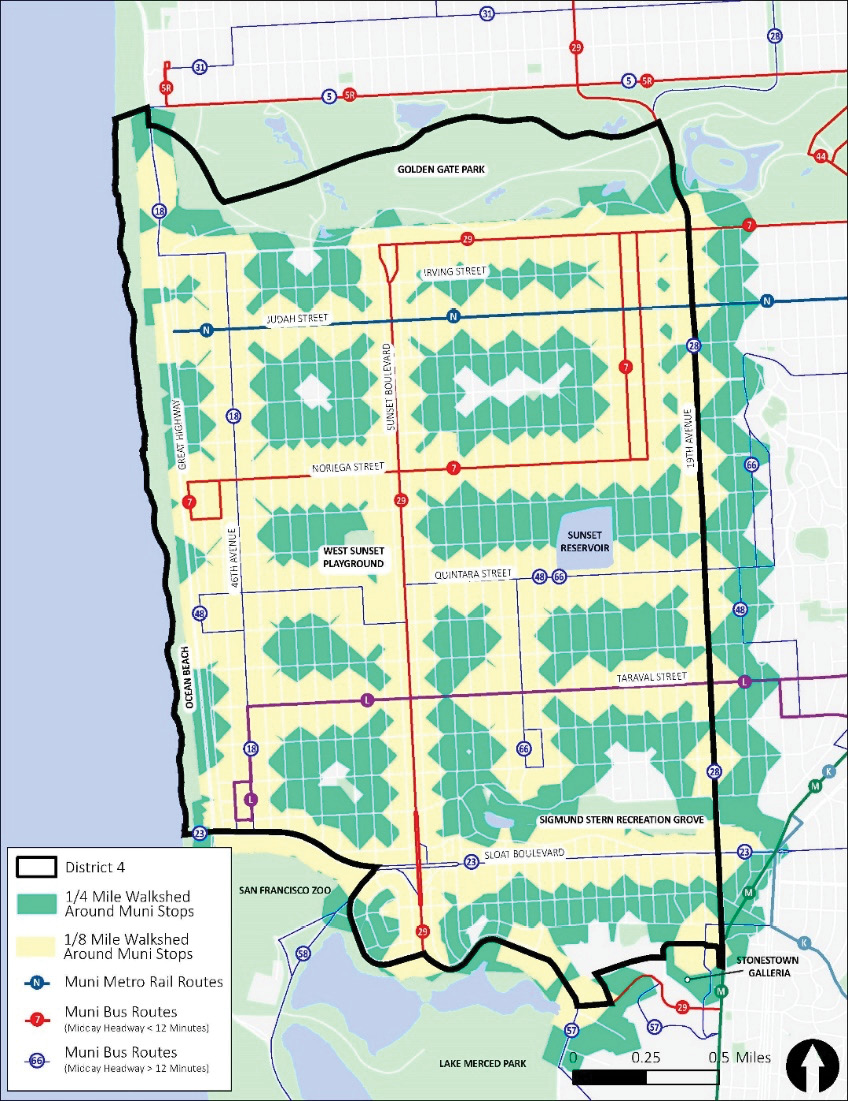
For example, many intra-district transit trips, such as those between the more peripheral residential areas and the central commercial corridors, require transferring between routes, resulting in longer and less convenient travel times. In some cases, the bus stop closest to a traveler’s origin is not served by the appropriate route for their trip destination, leading to additional walking to access the right service.
These factors can be particularly challenging for seniors and individuals with mobility impairments (key populations identified in the District 4 Mobility Study) for whom a quarter-mile walk may be too inconvenient or not feasible. Further, a one-eighth-mile walk is often more appropriate for these users; however, as shown in Figure 4-1, the one-eighth-mile walkshed (yellow buffer) covers a significantly smaller portion of the district, meaning that for them local travel via transit is are far less convenient. These challenges are also compounded for all users when carrying groceries, packages, or other loads (a key need also identified in the District 4 Mobility Study), more so when buses or trains are crowded.
Another factor contributing to the low transit mode share is that travel by car within the district is generally much faster and more convenient than by transit. An analysis of travel times for all origin-destination pairs within District 4 showed that, across nearly the entire district, car travel is at least five times faster than travel by transit (see Figure 4-2). Additional details on this analysis, along with information about the district’s characteristics, travel patterns, and existing transit service usage are provided in Appendix C.
These findings suggest that there are gaps in transit coverage and frequency of service for intra-district travel that an on-demand shuttle could help address. Such a service would provide a convenient travel option that eliminates the need for transfers or long walks, while having a smaller impact on road congestion and parking demand compared to single-occupancy vehicle travel. An on-demand shuttle could be particularly beneficial for seniors and individuals with mobility impairments, as well as for residents traveling with groceries or packages. Shorter walking distances to pick-up and drop-off locations and less crowded vehicles would further enhance the comfort and accessibility of the service.
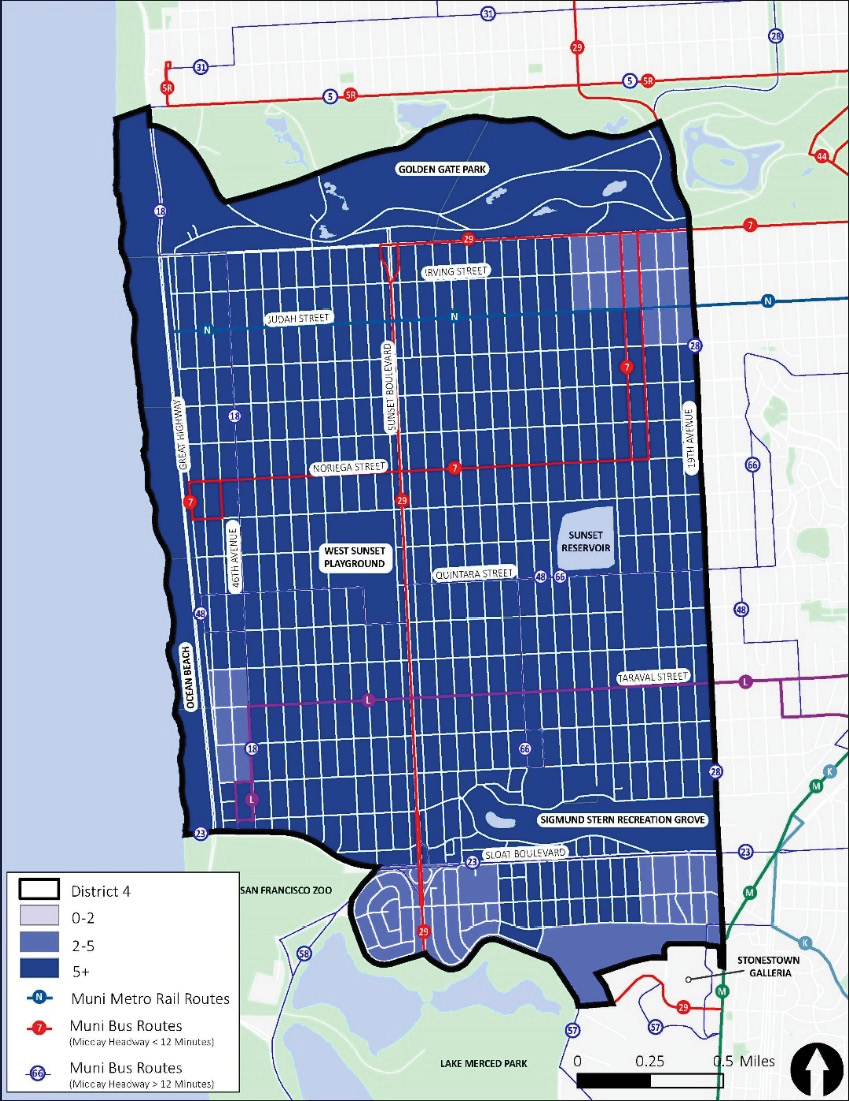
Table 4-1 compares key characteristics of District 4 with the average values observed across the service areas reviewed in the peer analysis. District 4 has a smaller overall land area but significantly higher population and population density. The table also presents averages for peers’ higher-density zones, which more closely resemble District 4’s urban context. Even when compared to these denser peer zones, District 4’s population and density remain substantially higher, suggesting potential demand and utilization for an on-demand shuttle service.
The district’s boundaries are clearly defined: John F Kennedy Drive to the north, 19th Avenue to the east, Buckingham Way/Winston Drive/Lake Merced Boulevard/Sloat Boulevard to the south, and Great Highway/Pacific Ocean to the west. Using these boundaries as the limits of the shuttle service area aligns with the advice from other on-demand services to have boundaries that are simple and easy for customers to understand.
Opportunities for extending the shuttle beyond the natural boundaries of District 4 were also explored. Figure 4-3 shows the volume of weekday auto and transit trips between District 4 and locations in District 7. Three specific areas show a significant high rate of travel: Stonestown Galleria and San Francisco State University, Balboa Park and City College of San Francisco, and the University of California San Francisco’s Parnassus campus.
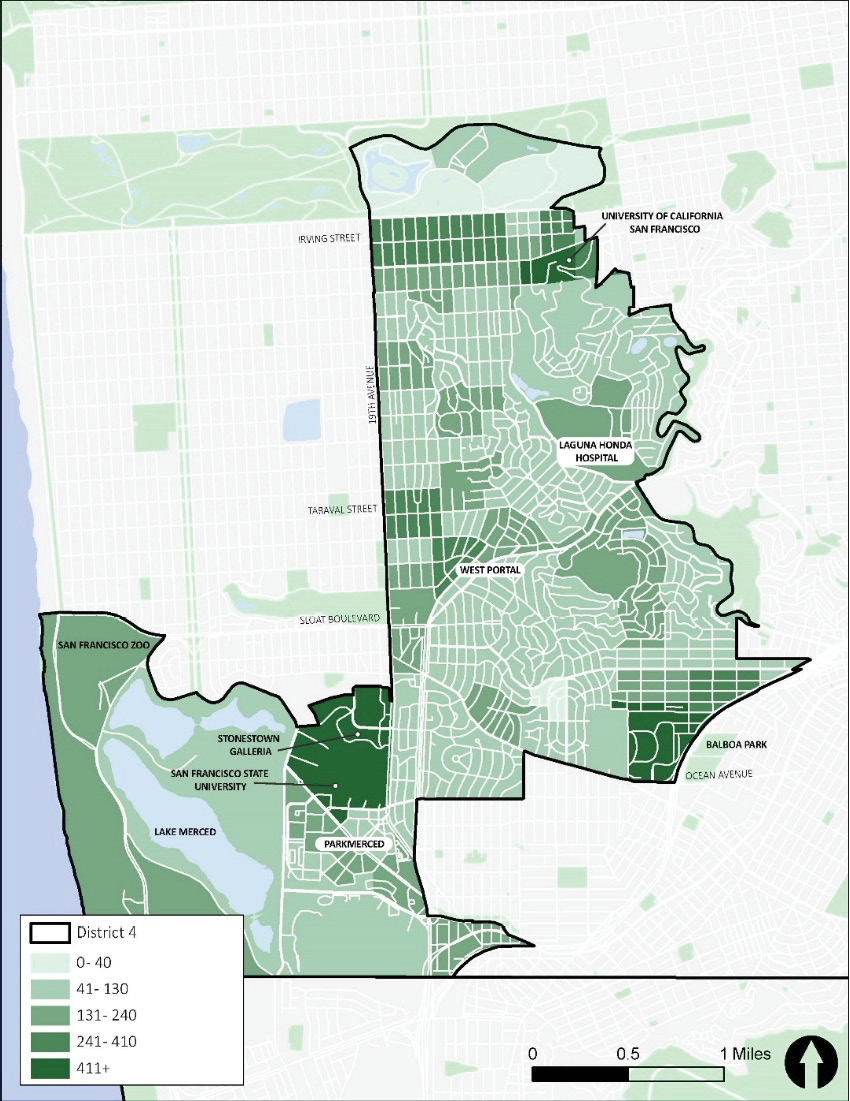
The following is a summary of the considerations for including each of the three areas within the service area:
Based on this analysis, it is recommended to include the Stonestown Galleria and San Francisco State University area in the shuttle’s service area. Appendix C has more information about the analysis of the three areas.
Estimating ridership for a new on-demand service is inherently challenging. Key factors for consideration include population and employment density, the number and type of key destinations within the service area, and the availability of existing fixed-route transit options. The methodology for estimating ridership in this study was developed based on a review of comparable on-demand services, previous feasibility studies, and relevant academic research.
Two separate approaches were developed to project potential demand for the proposed on-demand shuttle, leveraging data collected through industry research and peer review efforts.
The first method applied a capture rate model that compared demographic and land use characteristics within District 4 to those of similar on-demand service areas in peer cities, and then extrapolated likely ridership based on those comparisons. Using this approach, the shuttle is estimated to generate 294 rides per weekday. Additional details on this methodology and supporting calculations, along with those for the second method described below, are provided in Appendix C.
The second method examined the share of total trips typically captured by on-demand services in peer cities and applied a similar scaling factor to the total trip volume in District 4, based on travel demand data from SF-CHAMP. This approach produced an estimated 209 rides per weekday.
Although the two estimates differ, even the higher projection of 294 rides per weekday may understate actual demand, as District 4’s population and employment densities significantly exceed those of most peer service zones. Therefore, the 294 weekday rides estimate was considered a reasonable midpoint and used as the baseline for pilot service.
To estimate weekend and holiday ridership, weekday figures were scaled based on the typical ratio of weekend-to-weekday ridership observed across the broader SFMTA network, resulting in an estimate of 196 rides per weekend or holiday day. Assuming 250 weekdays and 115 weekend/holiday days per year, the total annual ridership is projected at approximately 96,000 rides.
One advantage of implementing the service as a pilot is the flexibility to expand operations if actual demand exceeds these projections.
The primary benefits of this service would be improving District 4 residents’ and visitors’ ability to travel within the district via transit, which would be reflected in shorter travel times via transit, potential mode shift from private car travel, or the realization of trips that were previously being suppressed. To the extent that there is a high level of mode shift away from private cars or ridehail services toward the shuttle, additional benefits could also include reduced congestion on District 4 roads and improved parking availability (particularly in commercial corridors where parking is reported to be in very high demand).
Offering a solution that supports mode shit away from private vehicle usage could be critical in the longer term, considering the proposed “managed retreat” strategy in Ocean Beach Master Plan recommending a transition away from the infrastructure adjacent to the ocean such as Great Highway.
To support more detailed planning activities for a future shuttle, transportation Authority conducted public outreach in 2023 to help identify key service design features for the shuttle that would address community needs. The main outreach tool was a community survey which received 865 total responses. The findings described below present only the survey responses that were received from residents of District 4, since they would be the target market for the shuttle. The Transportation Authority also conducted focus groups with leaders from multiple community-based organizations to further confirm community guidance.
As shown in Figure 5-1, survey respondents indicated that shopping and dining were the most common trip purposes for which they would use the proposed shuttle service. Text box responses further suggested that Stonestown Galleria and San Francisco State University have the strongest potential to attract shuttle trips. The second most popular anticipated use of the service was for travel to parks and open spaces.
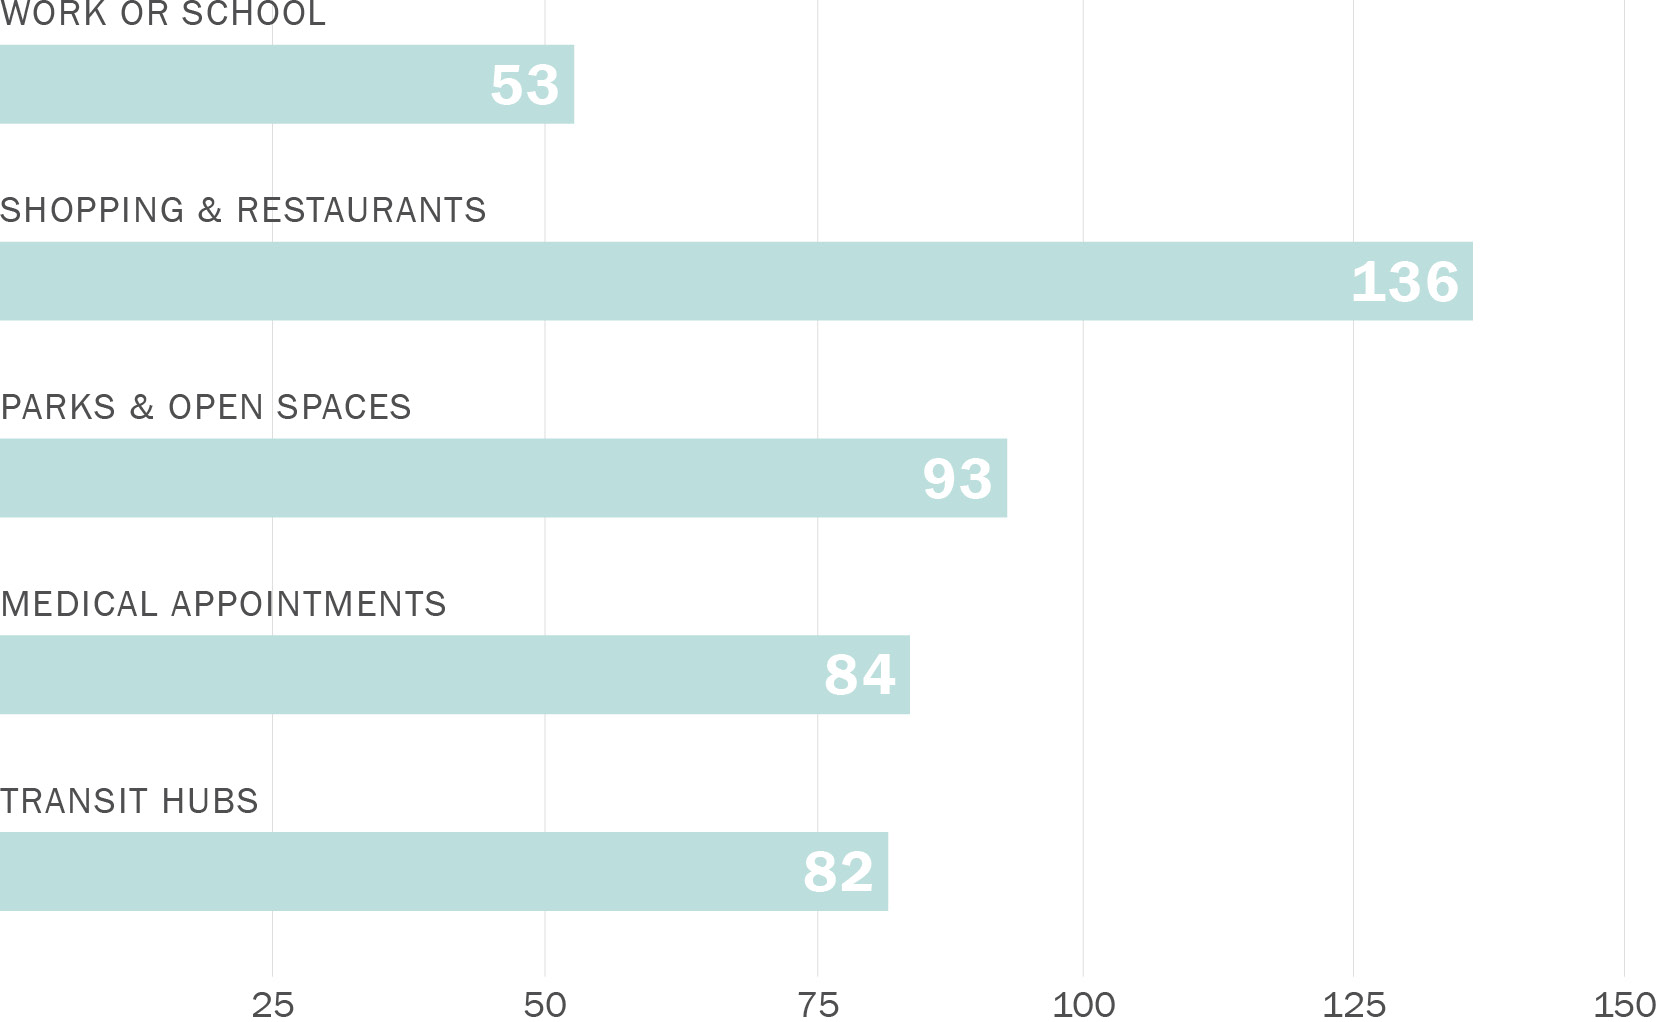
Download chart data (CSV)
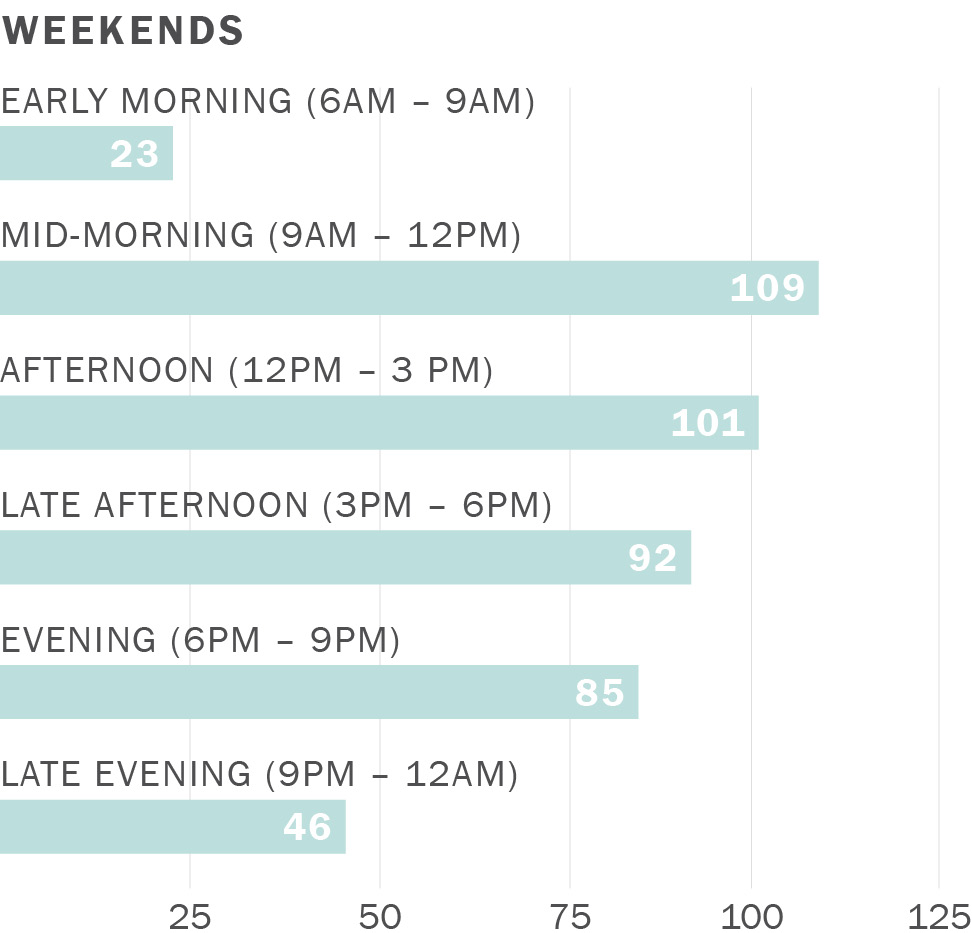
Respondents indicated that their preferred travel times were fairly evenly distributed across the day for both weekdays and weekends, as portrayed in Figure 5-2 and Figure 5-3.
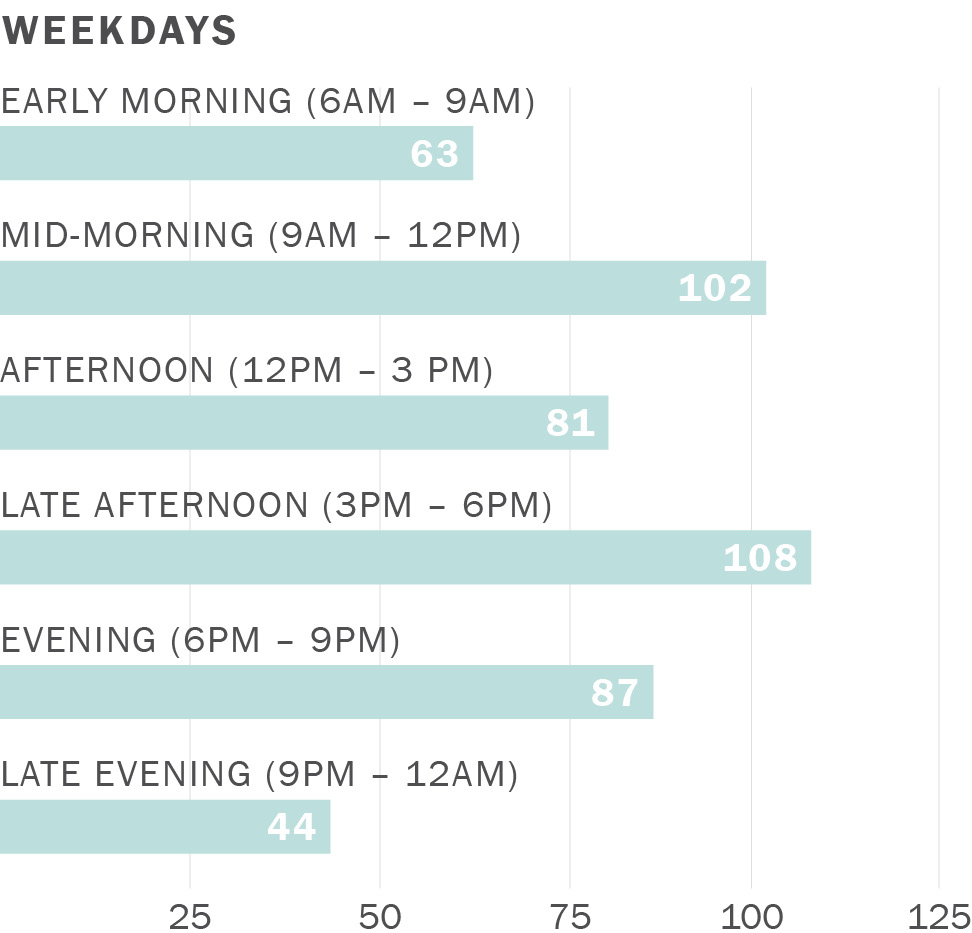
Download chart data (CSV)
Download chart data (CSV)
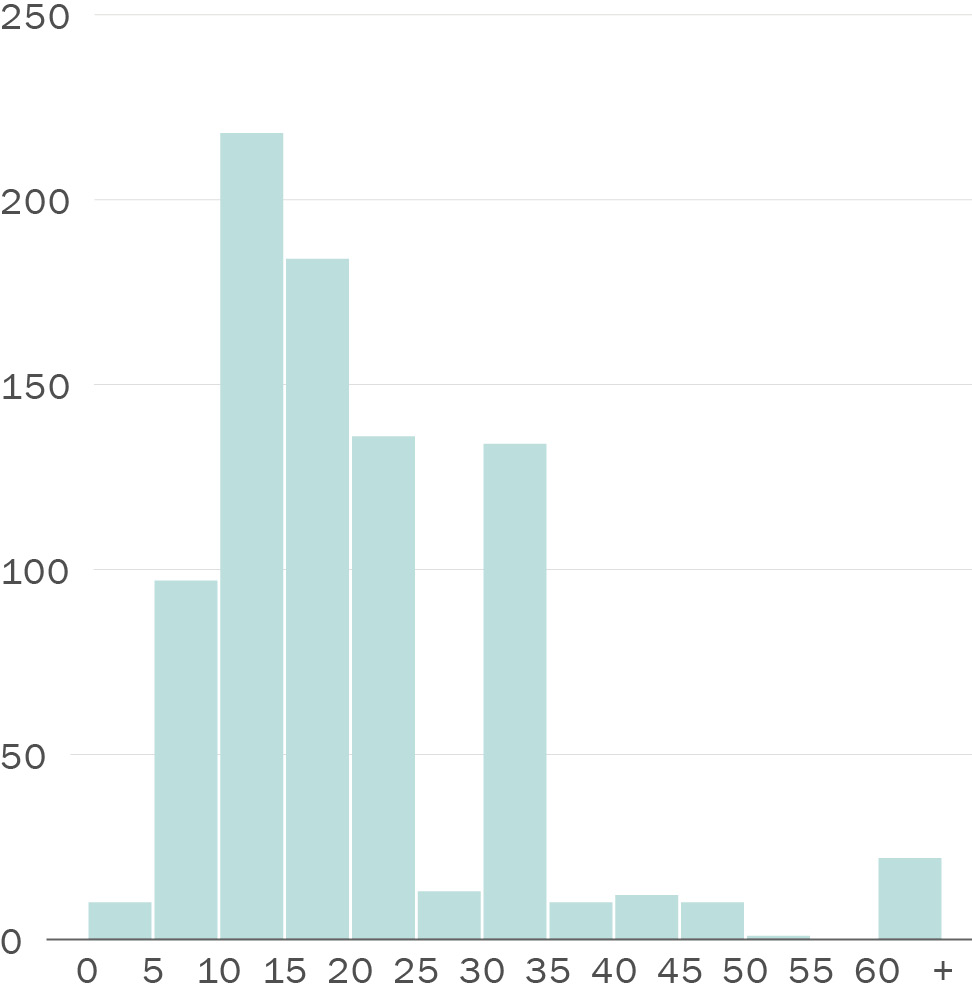
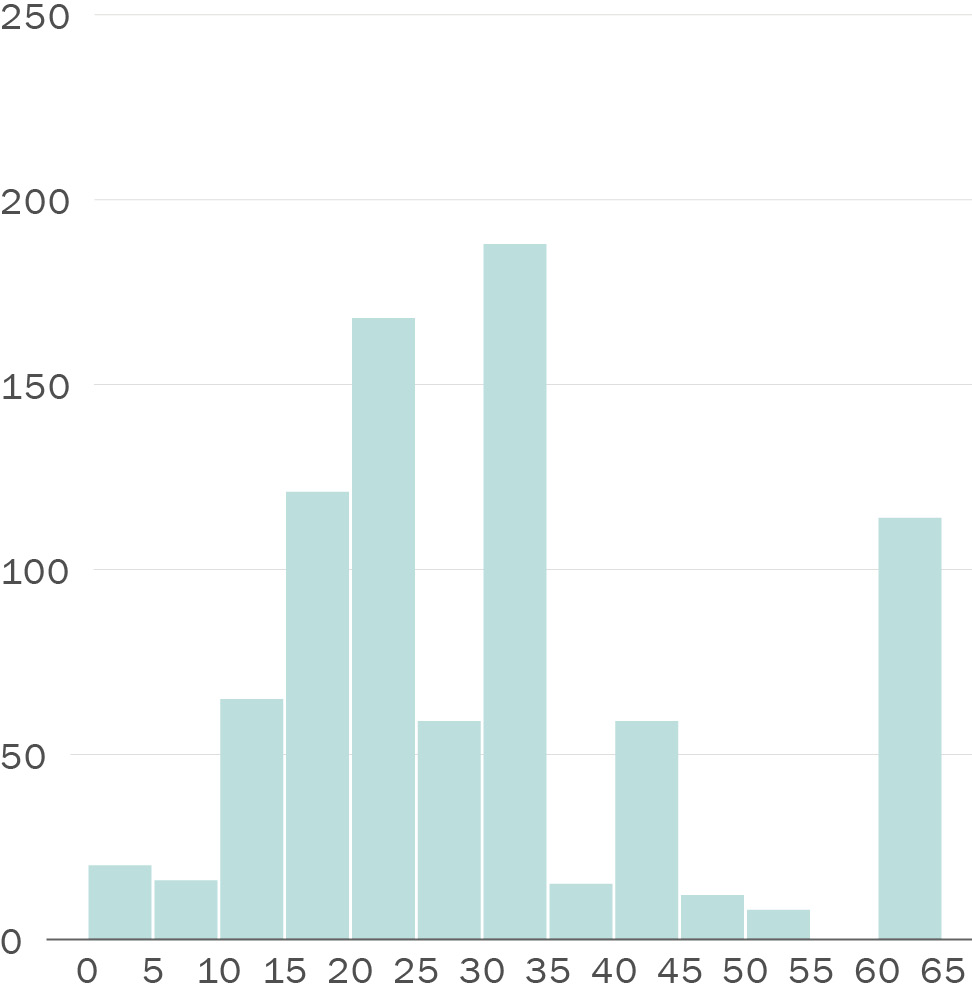
Figure 5-4 and Figure 5-5 show that the majority of respondents indicated that an ideal shuttle would offer wait times between 10 – 20 minutes and travel times in the vehicle of between 20 – 30 minutes.
Download chart data (CSV)
Download chart data (CSV)
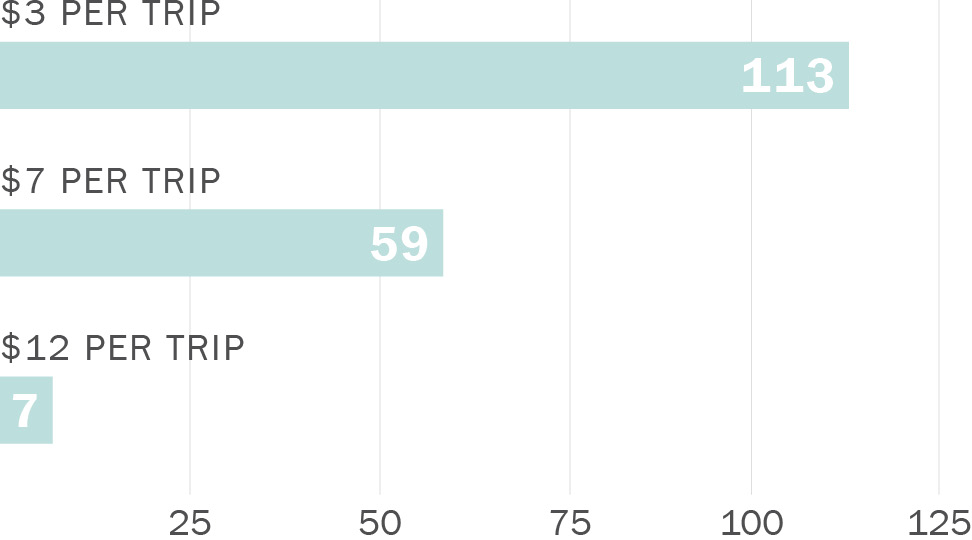
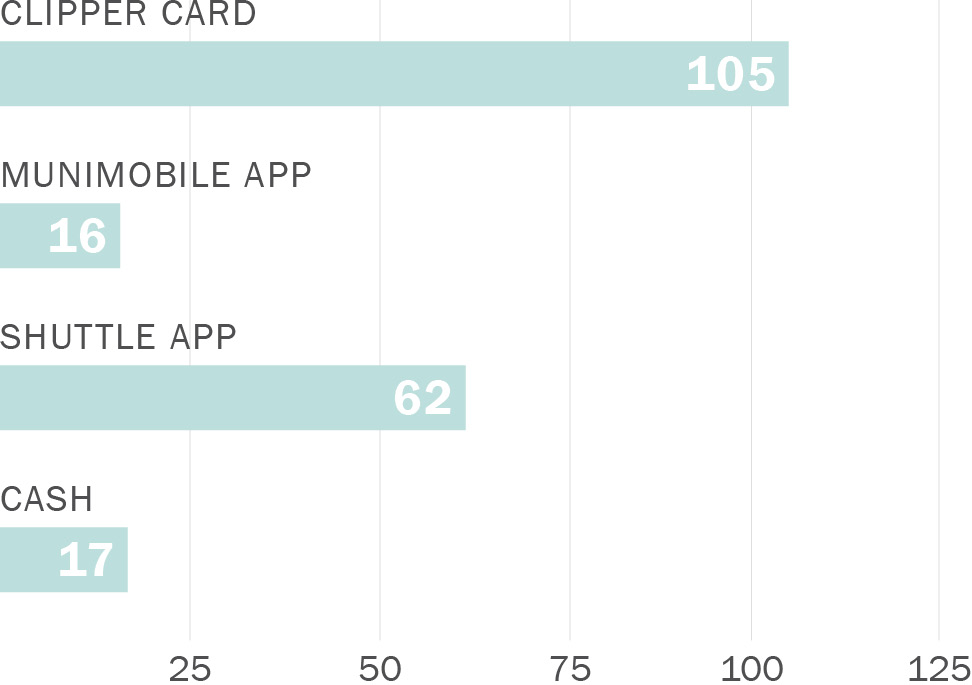
Figure 5-6 and Figure 5-7 shows that the majority of respondents recommended a fare similar to current Muni prices and that they prefer to pay using a Clipper card.
Download chart data (CSV)
Download chart data (CSV)
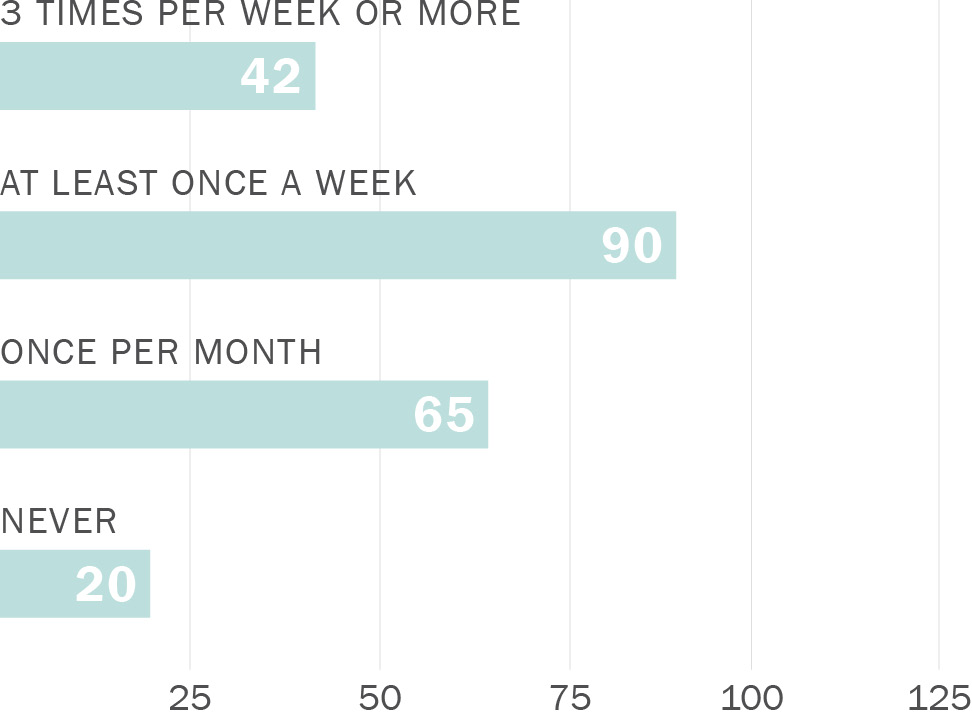
Figure 5-8 illustrates the expected frequency of shuttle use among respondents, with the majority indicating they would use the service at least once per week.
Download chart data (CSV)
The survey also sought to confirm the community’s priorities for the shuttle’s goals and objectives. District residents emphasized the importance of providing a high-quality alternative to private vehicle use, improving mobility options for seniors and people with disabilities, enhancing connections in areas not well served by existing transit, and increasing access to commercial corridors, restaurants, and other key destinations.
This section presents the findings of the service design development process. The proposed shuttle concept builds upon the recommendations of the District 4 Mobility Study and incorporates insights from industry research, peer agency reviews, and community outreach. Together, these inputs informed the identification of the proposed service goals, general service features, operating parameters, fares, and potential models for implementing a pilot.
The proposed service goals build on the original guidance from the District 4 Mobility Study and survey findings, while also incorporating research insights on the strengths of microtransit services and strategies to enhance their effectiveness. Notably, many peer agencies emphasized that such services should not be expected to yield high ridership volumes, but rather should be framed around providing high-quality mobility options for underserved markets. With this in mind, the proposed service goals are as follows:
The recommended concept for the shuttle is a modified point-to-point service that provides on-demand service between any two points in the service area. The shuttle would not have any fixed routes or schedules. It would pick-up and drop-off customers at the nearest safe intersection to their origin and destination points, considering factors such as traffic safety, lane configuration, and adjacent crosswalks. Seniors and customers who use wheelchairs or similar mobility devices would receive door-to-door service. Rides could be shared with other customers who board or alight along the way, as determined by a routing algorithm that optimizes shuttle dispatching based on the most efficient way for the available vehicles to serve the trips that are requested.
Rides would be requested via one of several channels, likely including a dedicated smartphone app and a call center. Customers would be able to book a reservation in advance, and a single customer could request a trip on behalf of multiple customers (to accommodate parents traveling with children or caregivers traveling with customers who have a disability). The shuttle provider would manage ride requests using its own in-house account-based system. Direct integration with existing transportation accounts in the region, such as the MuniMobile app and Clipper, is not anticipated during the pilot, because it would be too complex for a short-term operation. However, to help customers navigate the shuttle more easily, account rules and travel guidelines should be designed to mirror these other systems when possible.
The vehicle used for the shuttle would be a specially equipped mini-van or a small “cutaway” vehicle, like those shown below in Figure 6-1. Some or all of the fleet would be wheelchair-accessible, and vehicles would be able to accommodate strollers and small shopping carts. This study does not have a specific recommendation on whether the vehicles should be a traditional ICE vehicle or an EV. There are pros and cons to both options, as discussed later in this report.
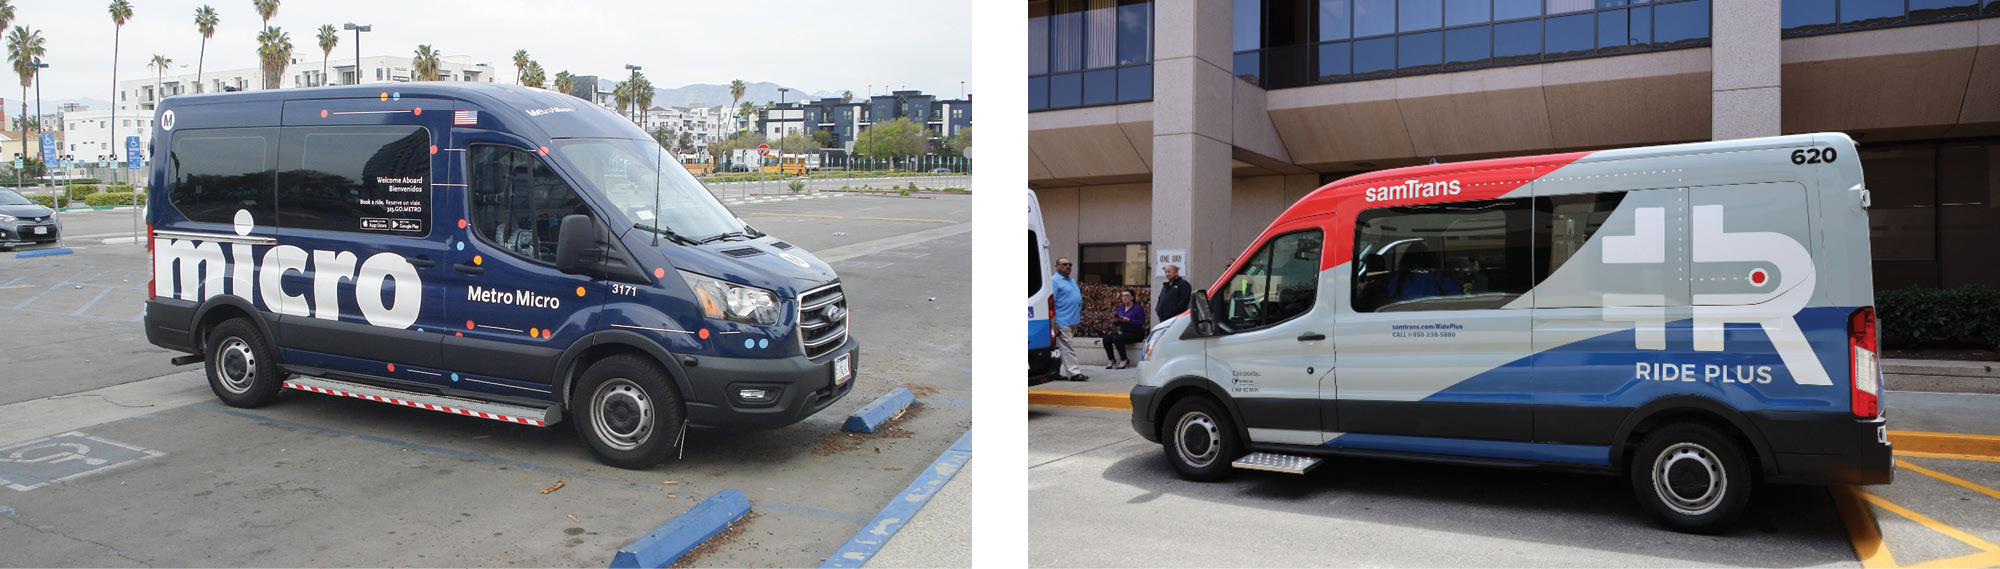
Left photo courtesy of LA Metro, flic.kr/p/2kRx7h7
Right photo courtesy of SamTrans
The recommended service area for the shuttle would include the entire extent of the district, which is bounded by John F Kennedy Drive to the north, 19th Avenue to the east, Buckingham Way/Winston Drive/Lake Merced Boulevard/Sloat Boulevard to the south, and Great Highway/Pacific Ocean to the west. As discussed in previous sections and illustrated in Figure 6-2, the proposed service area would also include the nearby Stonestown Galleria and San Francisco State University, extending the southern boundary to Font Boulevard and Holloway Avenue. The shuttle would pick up and drop off customers on either side of these boundary streets to optimize vehicle routing and enhance the overall customer experience.

The shuttle would serve customers seven days a week, with slightly different hours on weekdays and weekends. It would operate from 6:00 a.m. to 10:00 p.m. Monday through Friday and from 9:00 a.m. to 9:00 p.m. Saturday and Sunday. These time windows were tailored to address feedback received during public outreach, in which survey respondents indicated a desire for more late-night service in the district, including a preference for weekend service to start and end later rather than serving the early morning period.
Based on insights from industry research and peer reviews, the proposed shuttle service should aim to provide an average wait time of approximately 15 minutes between a ride request and vehicle arrival, and an average in-vehicle travel time of about 10 minutes. During public outreach, district residents indicated a willingness to accept slightly longer wait and travel times; however, maintaining the proposed level of service is recommended to ensure a high-quality user experience and community impact. It should be noted that achieving this level of service will influence operating costs, and this trade-off between level of service and cost efficiency should be further evaluated during the procurement and implementation phases of the pilot.
A key finding from the industry research and peer reviews was the importance of aligning fares and fare collection systems with existing regional transit services to simplify customer experience, customer messaging, and streamline field operations. In the Bay Area, the Clipper system serves as the regional fare collection platform, providing a standardized payment method across all transit operators. Clipper also accommodates unbanked customers and includes mechanisms to verify eligibility for discounted fares, such as those offered to low-income riders and individuals with disabilities. Feedback from the community outreach process further supported this approach, with respondents expressing a strong preference for maintaining the standard Muni fare and using Clipper as the primary form of payment for the shuttle.
There are two different options for deploying Clipper on the shuttle. The best option would be to work with SFMTA, if SFMTA were not the sponsor agency, to piggyback on their active deployment. The second option would be for a new project sponsor to set themselves up as a new transit operator in the regional Clipper architecture. This process would be time-consuming and expensive, which adds unnecessary costs and delays to a short-term pilot, and is not recommended.
Aside from simplifying the implementation of physical fare collection on the new shuttle, joining Clipper by partnering with SFMTA has other benefits. The shuttle can be set up as a separate “route” in the SFMTA network system which facilitates back-office administrative tasks such as ridership tracking and revenue segregation. Also, the current Muni fare rules would automatically apply to the shuttle without requiring any additional software development or configuration. This is especially helpful because of Muni’s many different fare programs:Source: “Fares”, San Francisco Municipal Transportation Agency, 2024.
To proceed with using Clipper on the shuttle, the project sponsor would need to negotiate with SFMTA to obtain the necessary equipment and agree on financial arrangements for distributing fare revenues and potentially sharing expenses. The physical collection of fares would be via a card reader on board the shuttle, so each van would need its own reader. A hand-held model is available that would be appropriate for a temporary deployment, which avoids the need to install permanent equipment in the vehicles during the pilot period. All Bay Area transit agencies have a fixed initial allotment of equipment, including these hand-held readers, based on the size of their fleet. Additional units needed beyond the allotment will incur an extra upfront cost. If only a small number of devices are needed for a short period, it is possible that SFMTA may have enough on hand to be able to loan some readers just for the duration of the pilot without needing to acquire additional units. Beyond the cost of the on-board equipment, each transit operator also pays a proportional share of the fixed cost for operating the regional system architecture based on its share of transactions and revenue processed. Shuttle ridership is likely to be a tiny fraction of the total SFMTA volume on the Clipper system, so the marginal effect on the fixed cost allocation should also be relatively small.
This study does not envision any software integration between the Clipper fare payment systems and the other Information Technology (IT) components needed for shuttle operations such as the vendor’s customer account system, ride booking, or vehicle dispatch. Clipper is developing Application Programming Interfaces for data transfers to verify whether a fare payment is valid, but the request for a ride cannot be linked to the fare payment without additional software development that would need to be paid for by others. This effort would only be recommended after a decision is made on whether to continue the shuttle on a permanent basis.
It should be noted that, without a connection between the ride reservation system and the fare payment system, the presentation of a valid fare only occurs on-board the vehicle at the time of pick-up. It is not possible — and for policy reasons it may be inadvisable — to charge a customer a fee for no-shows or last-minute cancellations. Instead, the shuttle operator should consider adding rules in the reservation system so that accounts with excessive levels of cancellations are restricted from booking for a time to discourage over-burdening the system.
The basic trade-off when selecting an operating model is the decision on whether to “build-or-buy” the new service. In other words, should the project sponsor develop everything from the ground up with in-house resources, or should they contract some or all the effort to a third-party vendor? And if contracting will be used, which function(s) should be outsourced and to whom?
Over the past ten to fifteen years, multiple private companies have invested significant resources in developing software to support on-demand services that help transit agencies shift away from legacy Dial-A-Ride approaches to more advanced interfaces for customers to request their rides and for transit agencies to serve those rides. Transit operators can now take advantage of increasingly automated functionality for app-based bookings and reservations, real-time vehicle and passenger location data feeds, route optimization algorithms, vehicle dispatch, and driver wayfinding.
These elements are often packaged together in a software as a service (SaaS) model that can help transit agencies who want to improve existing on-demand services or launch new on-demand services using their own vehicles and drivers, but without investing in the time and expense of custom software development. The SaaS approach is ideal for transit agencies who want to meet customers’ high expectations for a modern and efficient on-demand service while keeping most of the daily operations in-house. This approach has been used in several cities in Michigan (Link in Traverse City, Rapid Connect in Grand Rapids, and Battle BCGo in Battle Creek) as well as the RideKC Micro Transit service in Kansas City, Missouri and an earlier iteration of the Pickup service in Austin, Texas.Source: “Michigan On Demand Microtransit”, Michigan Department of Transportation, 2023, and “Richmond Region Micro-Transit Study”, Greater Richmond Transit Company, 2021.
On the other hand, many public agencies want more than just software when launching a new service like this, preferring a turnkey approach to operations. For example, they may be concerned about proving the viability of the on-demand service or testing different types of vehicles before making commitments to expand their own fleet and labor force. A third-party vendor can supply the required resources quicker and make nimble adjustments to help a public agency hone in on the right approach for a new on-demand service. Having contract operators supply most operating functions, including software, vehicles, drivers, customer service, and marketing is ideal for launching a new service quickly, regardless of whether on-demand operations are brought in-house in the future. It may also be a good option for a public agency that does not already operate any transit service so that they can test the market for a new on-demand service without making a long-term commitment to becoming a transit operator themselves.
Of course, project sponsors are free to select arrangements anywhere between these two bookends, depending on their preferences and local capabilities. For example, a transit agency may wish to retain control of the marketing and customer service functions to ensure a seamless brand experience for their customers while leveraging the vendor’s experience with field operations in a non-fixed route setting. Or they may want to utilize the vendor’s expertise in providing the customer-facing functions for the on-demand service while the agency manages the activities that occur behind the scenes, such as fleet acquisition, cleaning, and maintenance.
Another operating model issue that would need to be resolved is whether the shuttle would use the services of taxis and/or TNCs to supplement van services in periods where demand exceeds capacity. Many shuttle vendors will offer a “taxi broker” service as an option within their apps, to provide a fallback option and keep wait times more reasonable whenever demand surges. This maintains high service quality for the customer, which would support the goal of improving mobility options in the district. It could also potentially help to add capacity at high-demand times without needing to contract for additional vehicles and drivers. However, the fees paid to the taxi and TNC operators are typically passed back through to the project sponsor, which could increase total costs. It may be advisable to set limits on the use of this service to avoid depleting the budget too quickly.
Following the advice collected during the industry interviews, this study recommends a turnkey contract operation for the pilot period to leverage the expertise and adaptability of having a private firm undertake the experimental phase of operations. Once the pilot has been evaluated, it could be determined whether to continue outsourcing to a vendor or bring some or all the operating functions in-house. The use of the taxi broker option is not recommended as part of the initial pilot deployment because it would introduce too much uncertainty regarding the cost of the pilot phase. It could be added later via contract renegotiation or subsequent procurements if conditions warrant.
This section provides an analysis of (1) the estimated costs associated with implementing the proposed shuttle service as a one-year pilot; and (2) the key considerations for developing a funding strategy to support a pilot and potential longer-term implementation.
Pilot phase costs are analyzed below, including contractor expenses (both variable operating costs and fixed costs) as well as staffing costs for the sponsoring agency. Additional factors influencing the cost of long-term implementation are also discussed.
Variable operating costs tend to be somewhat proportional to the pilot phase’s size, scale, and duration while fixed costs are somewhat constant regardless of the pilot’s scope. Some components of the operating cost (such as vehicles, drivers, and supplies) tend to scale linearly with the number of hours of service provided. Other costs (such as the customer service functions) are not as closely tied to the size of the pilot, although most vendors will still bundle these costs together into their hourly rates.
For the purposes of this study, the variable operating costs are assumed to include the full set of turnkey functions that are typically provided by a contract operator such as:
Contract operators typically charge for their services on a cost per hour basis. The peer research and industry interviews revealed a wide range of hourly operating costs, largely because each peer includes different elements within their total operating cost, and levels of service vary as well. As a result, the derived values of cost per hour can vary, depending on what is included in the unit cost versus separately billed. Also, some operators charge a different unit price for the baseline service versus extra hours above the baseline. Other factors driving variations in operating cost include local economic conditions, which types of employees are driving the vehicles (i.e., employees with prevailing union wage or contract workers), disposition of fare revenues between the contractor and the contracting organization, and the year of the cost information that was provided. Details of the cost information collected are provided in Appendix B.
There are multiple factors that could increase the unit operating costs to higher levels than those of many peer agencies. Most notably, San Francisco has a history of strong labor protections including minimum wage and benefits requirements that may be more prevalent than those of other communities that were studied. The cost of living is also high in San Francisco, so workers tend to demand higher wages than in many of the other communities examined during the peer review.
Aside from labor costs, fuel and energy prices may also be higher in California due to state emissions requirements and tax rates. If EVs are used, they will need more down time to charge unless more expensive fast-charging equipment is procured, which could increase costs. Without fast chargers, the vendor may need to supply a larger fleet size to provide the required number of vehicles in service for the entire day due to vehicles being out of service for extended charging periods.
To estimate the potential unit costs for the shuttle, data was collected on the average cost per driver hour from publicly available information for four services operated by Via: Palo Alto Link (Palo Alto, California), Metro Flex (Seattle, Washington), Via Rideshare (West Sacramento, California), and Via Jersey City (Jersey City, New Jersey). Palo Alto Link service began in March 2023 and is included because it is a recent post-pandemic contract and is located close to San Francisco. The other three services provided cost and performance information as part of the peer agency interviews and subsequent correspondence.
Operating cost per driver hour for Via Rideshare is almost $60 while Via Jersey City’s is about $55 with Via receiving fare revenue from the service. Palo Alto Link has an hourly operating cost of $90 and Metro Flex has an hourly operating cost of about $83. These hourly costs include Via’s upfront costs. For example, Via Jersey City upfront costs were $169,288 in 2020, $55,000 for Via Rideshare in 2019, and $92,500 for Palo Alto Link in 2023. Recent Via job postings suggest an hourly wage for contract employees in the range of $22 to $25 for the four services. All four services operate vans rather than minibuses or larger vans such as Ford Transit. Vehicle size can affect hourly operating cost to a small extent.
A range of hourly operating costs for the District 4 Shuttle were developed using different assumptions regarding requirements for driver pay and benefits as well as vehicle type, and are presented in Table 7-1 below. The low estimate was based on independent contract labor with modest requirements for compensation and benefits and assumed the use of ICE vehicles. The high estimate assumes that drivers are employees (not contract labor) with wages comparable to the prevailing transit union wages. It also assumes that all vehicles are EVs. The high estimate requirements are comparable to those extended to drivers of SFMTA’s Bayview Shuttle, where drivers are employees of the contractor and receive union equivalent wages. The contractor also works with SFMTA through the City and County of San Francisco’s Office of Economic and Workforce Development’s CityDrive training program and community-based organizations to hire newly graduated commercial licensed drivers to operate revenue service vehicles. Union equivalent wages were estimated by looking at Muni operator wage scales.Source: “9163-Transit Operator”, City and County of San Francisco, 2022. This adds $13 to $15 to the hourly contract driver’s wage.
The hourly operating costs from the four services reviewed were adjusted to account for inflation since the start of their contract period and for the higher cost of living in the City of San Francisco. Accounting for these factors and averaging the results from the four services yields a low-end average hourly cost of $88.
Adding a reasonable 10% contingency for procurement uncertainties yields a low-end estimate of $97 per hour (in 2024 dollars). The high-end hourly cost per driver hour, assuming drivers are paid the prevailing union wage, is $102 (in 2024 dollars). Adding the 10% contingency results in a high-end operations cost of $112 per hour. Appendix E has more information on the hourly operating cost estimates.
The vehicle fleets for most of the peer operations were still dominated by ICE vehicles rather than newer hybrid or EVs that are now gaining popularity in the industry. Some contract shuttle operators are making the transition to EVs. Several research studies comparing different power trains have concluded that battery-electric vehicles have lower lifetime total cost of ownership than ICE vehicles, due to lower lifetime maintenance costs, even after taking battery replacement costs into consideration. Presumably, that cost differential will grow as EV technology continues to mature, so the unit operating cost of an EV shuttle should be on the lower end of the range of operating costs estimated for this study.
A 100% EV fleet would involve upfront costs to procure and install charging equipment on a site in or near the service zone. While EVs likely have a lower life cycle cost than ICE vehicles, the upfront cost would need to be included in the pilot project cost. The upfront costs for charging infrastructure would not be recovered over the course of a one or two-year pilot, so it should be added to the overall operating cost estimate. Slower chargers (Level 2) have lower costs, about $10,000, than faster chargers (Level 3), which can cost over $100,000 or more to procure and install.Source: “How Much Does a Commercial EV Charging Station Cost?”, WattLogic, 2022, and “How Much Does it Cost to Install EV Charging Station?”, Bacancy Systems, 2024, . For the service plan proposed in this report, this could add up to $5 per hour to the unit operating cost. Grant funding could offset some or all of the electrification costs.
Table 7-2 shows the final range of operating cost statistics for four variations based on use of contract labor drivers, employee drivers with union wages, ICE vehicles, and EVs. The calculations include the low-end estimate of $97 per hour for contract labor drivers from Table 7-1 with the $5 per hour addition for use of EVs, as well as the high-end estimate of $112 for employee drivers with union wages with the EV addition. Appendix E has more information on the annual operating cost estimates.
The physical operation of the shuttle is not the only cost of deploying a pilot. The contractor could also include other fixed costs of running a shuttle, such as:
These types of costs do not appreciably vary with the scale and complexity of shuttle operations, so they can be separately estimated and added to the operating costs. However, detailed information on the individual costs components is difficult to obtain because it is often bundled together into lump sum fees and/or deemed confidential because it is a proprietary trade secret. Disposition of fare revenues can also vary. In some operations, the vendor keeps some or all of the fare revenue, which may offset some or all of the fixed costs. As a placeholder, the cost estimate in this study includes one-time expenses of $100,000 for vendor start-up and initial deployment.
The public agency sponsor of the service will also have staffing costs associated with launching and managing the pilot. Agency staffing costs have been estimated by assuming one full-time employee (FTE) equivalent at a fully loaded cost of $250,000 per year. This single FTE would cover multiple functional roles including procurement and contract management, coordination meetings, grant administration, the agency’s role in marketing efforts, stakeholder engagement and public outreach, and evaluation/refinement of pilot (whether agency staff or consultant). More local information will help refine this estimate; for example, SFMTA has found that the agency staffing costs for the Bayview Community Shuttle are higher than originally anticipated.
The idea of a pilot is to test and refine potential operational concepts, so it is important to have enough time at steady state to meaningfully assess outcomes. This study proposes a two-year project timeline for a pilot, including one year of shuttle operations. More specifically, the timeline envisions:
The 12-month operating period would allow for some interim adjustments in the service plan and operating parameters to respond to demand patterns and community feedback. A one-year operating period also fits within the two-year maximum span of time that many grant programs are willing to fund operating and maintenance costs for transit-related services. Evaluation of the shuttle would occur during the last six months of the operating period. Then, using lessons learned during the pilot, the service could be modified to be viable in the long term and secure necessary funding to transition to a long-term operating model. The total costs for a two-year pilot are summarized in Table 7-3. Appendix E has more information on how the operating costs were estimated.
Considering these costs estimates and the overall demand projection of 96,000 passenger trips per year, the resulting operating cost would be in the range of $26.04 to $31.25 per passenger trip. Based on data from the 2024 NTD, these would be higher per passenger trip costs than the current cost of SFMTA’s fixed route bus services ($6.59) or light rail services ($8.53), but lower than SFMTA’s demand response services ($91.19).
Most of the peer agencies reviewed in this study chose to launch their shuttle services as temporary pilots. This approach allows for agencies to “learn from doing” and iterate the product offering after beginning operations in order to seek the right combination of service design and features for their market. During this initial startup stage, agencies must choose whether and when to fully integrate the shuttle with the rest of their service offerings. For the shuttle, this type of integration might include any or all of the following:
It would be prudent to wait until there is a pilot evaluation and a commitment to long-term operations before undertaking these additional investments. They are not included in the estimated total cost of running a community shuttle pilot.
It should also be noted that the operating costs may change significantly during or after the pilot phase, based on a variety of factors such as the evolution of the service plan, real-world performance of the selected vehicles, customer feedback on desirable features and benefits, and potential economics of scale with other community shuttles, among others. By its very nature, a pilot project represents a time to experiment and trial new ideas, so the exact nature of these changes cannot be defined at this time. Planners will need to remain flexible until it becomes clear what sort of mobility solution is best suited to the needs in the district.
This section describes the different funding sources that could potentially be used to pay the costs of the shuttle at different points in its development cycle, both in the pilot phase and over the long-term. The project sponsor would almost certainly need to secure multiple funding sources to fully fund the shuttle, though the particular mix of funding sources would likely vary for the pilot and long-term funding options. For instance, there are some limited grant funding opportunities for pilots, but no competitive grant funding was identified to support ongoing operations. As noted earlier in this report, a pilot can help refine the service to better achieve its goals, provide documentation of costs and benefits, and build support for extending the service. All of this can, in turn, inform and enable development of long-term funding options — such as a Business Improvement District or a Parking Improvement District — that are harder to put in place for the pilot phase.
The funding sources are grouped in four different categories:
The sections below describe some of the potential funding sources for the type of shuttle service described in this report, including an illustrative funding structure for a one-year pilot and for long-term service.
Revenues from service operations should be part of the project’s funding mix. The section below explores revenues from fares and advertising, as well as contributions from third-party partners.
The proposed service design assumes that shuttle customers would pay the standard Muni fare for regular transit services. The current adult single-ride fare paid from a Clipper “cash wallet” is $2.50. However, many riders pay less than this amount due to discounts or through the use of monthly or other passes, which effectively reduce their per-trip cost. As a result, the average revenue collected per Muni trip is consistently below the full fare price and is currently estimated at approximately $0.68 per ride.Source: “2023 Board Workshop”, San Francisco Municipal Transportation Agency, 2023.
Even if average customer revenue were restored to pre-pandemic levels of about $1 per ride, total annual fare revenue from an estimated 96,000 rides would be under $100,000, or roughly 4% of the lower-bound annual operating cost estimate of $2.5 million. This share would be even smaller relative to the total pilot program costs, estimated at $3.1 million per year. Some community members indicated during outreach that they would be willing to pay a premium fare for the proposed shuttle service; however, even doubling the projected fare revenue would cover only about 7% of annual operating costs. It should also be noted that all fare revenues collected through Clipper are pooled with other SFMTA funds, and dedicating these revenues specifically to the shuttle program may be administratively challenging.
As is common on transit buses and trains, shuttles could be configured to include paid advertising inside and/or outside the vehicle. For example, the exterior “wrap” that goes on the outside of the vehicle to identify the vehicle as part of the shuttle service can be co-branded with the logo of advertising sponsors. Potential revenues would depend on the number of advertising slots and the visibility of these ads as vehicles circulate. As a reference point, the SFMTA generated approximately $6.6 million in FY 2022/23 and $6.75 million in FY 2023/24 from advertising on Muni vehicles and other SFMTA properties (such as bus stops). Considering a Muni fleet of about 1,200 vehicles, this translates to an annual per-vehicle revenue of approximately $5,500 in FY 2022/23 and $5,625 in FY 2023/24 (not considering the value of other properties). The current shuttle service design assumes five operational vehicles during peak hours, which might require a few additional vehicles available to provide redundancy. Assuming a total fleet of eight vehicles, each generating the same revenue as Muni vehicle, the total annual ad revenue for the shuttle service would be approximately $45,000, which is equivalent to about 2% of the lower-bound annual operating cost estimate.
A third funding option that could be generated by the shuttle itself would be to seek contributions from organizations that are major trip generators in or near the service area, such as the Stonestown Galleria or the San Francisco Zoo. To the extent the shuttle provides transportation that increases patronage or reduces transportation costs for these organizations, they might offer some financial contribution towards the operating cost of the shuttle. Medical centers, shopping malls, and major recreation facilities often provide these types of shuttles exclusively to their own patrons, but more commonly on a fixed route and schedule. Pooling funds towards the cost of a shuttle that is available to the general public is a slightly different paradigm, but it is likely to be more cost-effective than each destination paying for its own dedicated service, so it could be worth approaching these entities to see if a partnership or sponsorship can be arranged. In the context of trying to increase local funding, even small contributions would be welcome, and they also demonstrate community support, which can sometimes improve grant competitiveness on other evaluation factors. The advertising revenue projections discussed above are the best available benchmark for the potential of this type of funding mechanism; any additional contributions would likely fall into the category of voluntary sponsorships or donations, which are much harder to assess.
Another potential funding source for shuttle services comes from employer partnerships. A useful example is King County Metro, which operates an extensive on-demand shuttle network that includes services developed in collaboration with major employers. Under this model, participating organizations (e.g., Amazon, T-Mobile, the City of Seattle, or the City of Bellevue) are required to contribute 50% of the total program cost. If a similar approach were applied to this project, that would translate to a local employer contribution of roughly $1.25 million. For a smaller, primarily residential district like District 4, however, that level of contribution may not be feasible and setting a lower cost-sharing threshold to reflect the community’s scale and funding capacity may be more realistic. Employer partnerships may be easier to establish following a pilot that demonstrates the value and longer-term viability of a shuttle.
As currently designed, revenues from fares and other opportunities directly related to service operations will only play minor role in the larger funding of the service. Combined, fare and advertising revenues are estimated to generate 4% of the lower-bound annual operating cost estimate of $2.5 million.
Shuttle pilots are often funded with external funding via short-term grants from federal, state, regional, and local funding programs. This section describes grant programs that have a potential nexus to a shuttle and some key factors to consider when determining which sources to pursue. Table 7-4 shows the grant sources with the best fit for the pilot and long-term shuttle.
This program is administered by the California Department of Transportation (Caltrans) in coordination with the California Air Resources Board (CARB), with funds distributed monthly by the State Controller’s Office. It allocates a portion of revenues from the Greenhouse Gas Reduction Fund, supported by the state’s cap-and-trade auctions. Funds are distributed by formula to public transit operators (e.g., SFMTA) and regional transportation agencies (e.g., MTC). Eligible uses include launching or expanding transit services within their first five years, operating services expected to increase transit ridership, and purchasing or operating zero-emission buses. A shuttle using EVs or designed to shift travel modes could therefore qualify. However, as a formula-based program, priority for these funds is based on sponsoring agencies and microtransit shuttle operations (e.g. in Bayview or District 4) would need to be considered against other operations funding needs.
This program, administered by the Bay Area Air District (Air District), funds projects that reduce single-occupancy vehicle (SOV) trips during peak hours by encouraging mode shift to shared transportation options. Projects may include up to two years of operating assistance, with a maximum award of $5.5 million per agency per funding cycle. The proposed shuttle could be a potential fit, provided it meets the program’s stringent criteria: demonstrating a transition to a sustainable funding model by the end of the third year, meeting a cost-effectiveness threshold of no more than $500,000 per weighted ton of pollutant reduced, ensuring emission reductions are surplus to existing requirements, and coordinating with a transit operator to serve areas lacking comparable alternatives. The cost-effectiveness target is likely to be the most significant challenge, as it requires a very high level of avoided emissions — equivalent to eliminating over 1.5 million vehicle miles traveled (VMT) by gas-powered passenger cars per ton of pollutants reduced. This translates to roughly $0.33 in funding per VMT reduced. To qualify, the shuttle would need to attract substantial mode shift from former SOV users, with any emissions from the shuttle offsetting some of those gains. Using an electric vehicle would improve the project’s emissions profile and its competitiveness for funding.
The Air District administers a Vehicle Trip Reduction Grant Program to fund projects that reduce single-occupant vehicle trips during peak periods by promoting shared mobility alternatives. Grants may include up to two years of operating assistance, with a maximum award of $5.5 million per agency per cycle. Eligible projects must demonstrate a transition to a sustainable funding model by the third year, meet stringent cost-effectiveness thresholds (e.g. $500,000 per ton of emissions reduced), ensure reductions are surplus to regulatory requirements, and coordinate with transit operators in areas lacking comparable service. Because the program places strong emphasis on emissions avoidance and mode shift from private cars, the cost-effectiveness requirement is often the most significant barrier. For a shuttle to qualify, it would require high participation from former SOV users, and using an electric vehicle would improve its emissions profile and competitiveness. Given its focus on intra-district travel, the proposed service would likely produce a relatively small reduction in GHG and therefore would only qualify for a limited amount of funding through this program.
Because many aspects of the shuttle project may continue to evolve, it is difficult to determine definitively whether it would be a strong candidate for the competitive grant programs discussed above. However, based on its current design, the project does not appear to be either eligible or highly competitive for most of the funding sources reviewed.
Federal funding programs typically prioritize projects that incorporate significant innovation or demonstrate new technologies, neither of which are key features of the current proposal. Similarly, most state and regional funding programs in California focus on emission reductions achieved through vehicle technology improvements or substantial mode shifts, criteria that this project does not fully meet. In addition, many of these programs give preference to equity priority communities, which does not generally describe the demographic makeup of District 4.
It is also worth noting, that most grants, including the sources described above, require the applicant to contribute matching funding (e.g., “local match”) towards project costs. For example, federal funding programs for transportation typically require non-federal matching contributions (i.e., local, regional, state, and/or regional funds) of 10% to 50% of total project costs, depending on the funding source.Source: “Federal Share / Local Match”, Federal Transit Administration, 2021. Further, for programs with a low match requirement, projects showing a higher match are sometimes more favorably during the application review and evaluation.
It is also important to note that most grants, , require the applicant to ensure the support or no objection of the local transit operator (in this case, SFMTA). While SFMTA has expressed concerns about re-directing existing SFMTA resources towards additional supplemental or pilot services during the current climate of fiscal crisis for its operations, the SFMTA is also seeking discretionary grant funds to continue its Bayview Shuttle service beyond the CARB STEP funded award for the initial pilot period of service.
Another critical source of potential funding for both the pilot and long-term operation of the shuttle is locally controlled, non-grant revenue (“locally controlled”). As noted above, many grant programs require a local match, which can also influence competitiveness. Over the long term, given the lack of discretionary grants that can be used to fund ongoing transit operations, local sources are likely to play a larger role in sustaining the service. This section explores the most prominent local funding sources.
The Transportation Authority is the designated County Program Manager for $750,000 per year in TFCA funds.Source: “TFCA 40 Percent Fund”, Bay Area Air Quality Management District, 2023, “County Program Manager Fund Expenditure Plan Guidance for Fiscal Year Ending 2024”, Bay Area Air Quality Management District, 2023, and “Funding Opportunities”, San Francisco County Transportation Authority, 2024. Like the Air District-managed TFCA fund described earlier, this funding program supports operations of new transportation services that are designed to reduce vehicle emissions provided the project can reach the specified cost-effectiveness threshold established in the TFCA guidelines. Application criteria are generally similar between the regional and county programs, although the county-level program has a stronger focus on providing first/last-mile connections to rail stations, ferry terminals, or airports. Because the proposed shuttle would not serve nearby major rail stations such as West Portal or Balboa Park, and is instead focused on improving intra-district mobility, its potential for VMT and GHG reduction is relatively limited.
Administered by San Francisco voters in November 2022, Proposition L (Prop L) established a 30-year expenditure plan describing the types of projects and programs that are eligible to receive funding from the half-cent sales tax, specifying eligible project sponsors, and setting maximum funding levels for each of 28 expenditure plan programs. The shuttle as designed would be eligible under two Prop L programs: the Transportation Demand Management (TDM) program and the Neighborhood Transportation Program (NTP). For the TDM program, eligible projects category should be designed to shift trips to more sustainable modes and/or off-peak travel times; pilots and evaluation of new solutions or technologies also qualify. The most current Five-Year Prioritization Program for the TDM program has a $1.5 million placeholder to implement projects consistent with the recommended actions to be identified through the Prop L-funded TDM Strategic Plan Update, anticipated to be completed in 2026. The shuttle is also eligible under the NTP. The NTP is intended to support community-based neighborhood-scale transportation improvements that would otherwise be eligible for Prop L per the voter-approved expenditure plan. Each five-year period, $700,000 in Prop L funds are directed to each of the supervisorial districts in the city, with projects to be identified by the district supervisor in their role as Transportation Authority Commissioner. District 4 has about $40,000 remaining in the current NTP funding cycle, which ends in FY 2027/28. The next NTP funding cycle will cover FY 2028/29 through FY 2032/33 and will set aside $700,000 for each district for that cycle.
Each year, the San Francisco Board of Supervisors and the Mayor agree to a two-year budget that covers nearly $15 billion in expenditures each year. About half of the budget is composed of the spending plan for the revenues brought in by the City’s four enterprise divisions including the Port of San Francisco, San Francisco International Airport, San Francisco Public Utilities Commission, and the SFMTA. The remaining half of the budget is the spending plan for the City’s General Fund, which is more discretionary in nature, because funds can be shifted to different departments and purposes depending on current needs and priorities. The idea of funding a new shuttle service would need to be balanced against the resources needed to address these and other needs such as public safety, homelessness, and public health, as has been done in the past with “add-backs” as part of the budget process.
In general, City leaders balance the use of scarce resources both within transportation spending and between transportation and other government functions. The current financial environment in San Francisco is challenging, so a project sponsor would need to build a strong case for the use of locally controlled funding sources.
As described earlier, the estimated total cost for implementing the proposed pilot for one year would be $3.1 million to $3.6 million, depending on which labor and vehicle options are selected. Table 7-5 below provides a general example of one funding structure for such a pilot.
Preliminary estimates of potential ridership suggest fare revenues would generate approximately $65,000 per year, and potential advertising revenues could amount to another $45,000 per year. Those two elements total $110,000 in revenues per year, which covers 4% of the total cost of the lower bound cost estimate and 3% of the higher bound of the total cost estimate. The remaining ~96% of costs would need to be covered by other sources.
“Local match” is typically required on the order of 10 to 20% for most transportation grants, and sometimes a higher match can improve competitiveness for a grant award or earmarked funding. Considering the dearth of grant funds, the project sponsor should assume that anywhere from 30 to 75% of the project costs would need to be contributed from local sources. That means that 25 to 45% of the costs would need to be covered by locally controlled sources, such as the TDM and NTP programs of Prop L or the City’s General Fund.
The Transportation Authority has engaged in early conversations with potential corporate sponsors for the shuttle, and initial feedback suggests that this funding approach may be feasible. In the illustrative funding model presented below, the remaining 96% of project costs is allocated evenly across grants or earmarks, locally controlled funds, and community partnerships or sponsorships.
The sections above explore a general framework for how the project sponsor might be able to assemble a funding package for the pilot period. The funding profile for a permanent service has very different requirements and expectations than for a pilot. Most grants only provide operating support for a short period, and they expect to see a transition plan to financial sustainability after a few years. Grant applications may even ask the sponsor to demonstrate a reasonable expectation for financial capacity after the grant-funded period ends as a condition of the award. As a result, it is helpful to identify the potential targets for long-term funding as early in the planning process as possible. The options below all require building wider public support over a multi-year timeframe and many require voter approval as well.
In San Francisco, “Community Benefit Districts (CBD), also known as Business Improvement Districts (BIDs), strive to improve the quality of life on commercial and mixed-use corridors. Each district is a partnership between the City and local communities.”Source: “Community Benefit Districts”, City and County of San Francisco, 2024. To form a CBD, a petition signed by property owners responsible for at least 30% of the proposed assessment budget is first required; then a weighted ballot among all affected owners must yield more than 50% in favor for the district to be approved. A nonprofit created by the neighborhood distributes the funding for various improvements.
CBDs already exist in many communities where businesses and property-owners have a shared interest in maintaining a pleasant public realm and decide to pool resources towards that end. A CBD provides a formal vehicle to collect financial contributions from merchants, residents, and civic organizations to fund a variety of tangible services and benefits such as graffiti removal, litter cleanup, improved lighting and street furniture, and circulator shuttles.
The main challenge of using this approach in District 4 is the fact that the proposed shuttle service area includes only a few commercial activity zones on Irving Street and Taraval Street that are each fairly small and relatively far apart from one another, and they may have differing priorities for neighborhood improvements that make it difficult to generate a single fee structure that covers both areas. The other option would be to form separate CBDs for different neighborhoods, each with its own priority list of items to fund, ensuring that all CBDs include a financial contribution to the shuttle.
Regardless of the structure of a CBD, it should be noted that the two small commercial areas in the district are unlikely to generate a large amount of funding on their own. Since CBDs typically fund a broad portfolio of amenities, it should be assumed that any funds coming from CBDs would be just one part of a larger funding package.There are no BIDs or CBDs in the district at this time. Source: “Community Benefit Districts”, City and County of San Francisco, 2024, , and “Member Districts” San Francisco Benefit District Alliance, 2024.
At present, the City Charter requires that all parking meter funds flow to SFMTA to support its operations. City leaders could propose an amendment to the City Charter to enable the creation of a PBD in the district and then impose higher parking rates within the PBD to generate incremental funding beyond what SFMTA already receives. A PBD could require that the additional meter revenues be spent within the neighborhood in which they are generated. This is akin to the creation of a BID or CBD as described above, although a key difference is that amendments to the City Charter must be approved by a simple majority (50% + 1) of the citywide voters, instead of a small group of property-owners in the immediate neighborhood.
As a point reference, metered parking revenues in District 4 totaled $962,680 in FY 2023/24.This figure also includes revenues from citations, but the contributions from parking and citation revenues are not specified. To facilitate the exercise of calculating potential PBD revenues, it is assumed that all revenues are from parking. A 10% surcharge on these revenues would generate approximately $96,270 per year, or about 4% of the lower-bound annual operating cost estimate of $2.5 million. A 15% surcharge would yield roughly $144,400 (6%), while a 20% surcharge would generate about $192,540 (8%).
The Parking Reform Network provides excellent reference materials on best practices in PBD formation, including a Parking Benefit Resource Guide and case studies on implementations in Austin, Texas, Pittsburgh Pennsylvania, Pasadena, California, Columbus, Ohio, and Portland, Oregon, each with links to additional information. The case studies provide examples of locations where meters were implemented for the first time and locations where existing meter revenue was re-allocated in ways that provide greater benefits at a neighborhood scale.Source: “A Guide for Activists by the Parking Reform Network”, PRN, 2024.
The Center for Innovative Finance Support within the USDOT Federal Highway Administration has produced a fact sheet on PBDs in California. It contains a description of the typical form of a PBD and some considerations related to different forms of parking permits that might be used to help local residents and business owners access priced parking. The fact sheet includes web links to case studies in Bend, Oregon, Fairfax, Virginia, Chicago, Illinois, and Houston, Texas.Source: “California Parking Benefits Districts”, Federal Highway Administration, 2024.
Another potential funding mechanism for the shuttle could involve the establishment of transportation impact or mobility fees tied to new development within the service area. New development could create an opportunity to implement such a fee structure to help fund local mobility improvements.
These fees could be assessed as a one-time charge per new residential unit or per square foot of commercial space and allocated to a dedicated transportation fund supporting shuttle operations and capital costs. Linking fee revenue to new development ensures that growth contributes to the cost of expanded sustainable transportation services, while also providing locally generated funding source that can strengthen the project’s eligibility for matching or supplemental grants. Development fee funding can be a challenging funding source to sustain operations since the amount and timing of revenues is dependent upon the pace of development which is influenced by economic cycles and other factors.
San Francisco already has existing citywide development-linked mechanism, the Transportation Sustainability Fee (TSF), which charges new residential and commercial development to mitigate growth related transportation impacts. TSF revenues fund a variety of citywide and neighborhood transportation improvements, including transit, pedestrian, and bicycle projects. A similar approach could be applied to the shuttle, with a portion of TSF or a supplemental development fee earmarked specifically for shuttle operations.
Another approach would be to redeploy existing SFMTA operating funds towards the shuttle. Local bus routes with low ridership incur substantial total operating costs, and high cost per passenger trip. Customers on those routes might be better served by a dynamically-routed, on-demand service that may potentially provide higher coverage and lower wait times at similar total cost levels. If an externally funded pilot demonstrates that a shuttle is sufficiently viable and achieves the desired outcomes, SFMTA could evaluate whether local networks could be reconfigured and free up enough money to support the continuation of the shuttle. Any such process would need to follow established SFMTA procedures, including Title VI requirements relevant to service changes.
Most of the long-term funding options described in this section require multiple years of lead time and community support to establish, including voter approval, if required.
Table 7-6 below provides a general example of the conceptual funding structure for the long-term implementation of the service. It assumes that the selected contractor continues as the long-term operator, thereby eliminating the initiation and startup costs incurred during the pilot phase. Similarly, the sponsoring agency’s staffing needs are adjusted to exclude installation activities prior to launch and evaluation efforts following pilot completion. Under these assumptions, the project’s annual budget is reduced to $2.75 million on the low-end estimate and $3.25 million on the high-end estimate.
In terms of funding sources, fare revenue and advertising are assumed to generate the same amounts as in the pilot phase. The project, however, could not rely on external grant funding or earmarks for long-term implementation, as there were no such sources identified that may be used for this purpose. Locally controlled sources (such as a potential future funding measure or reallocation of resources from existing fixed-route services) would still be needed. Similarly, it is assumed that corporate sponsorship funding would continue during this phase. The final source of funding would come from District 4 community-based sources, which could include mechanisms such as a CBD, a PBD, or development fees.
As such, Table 7-6 presents a model in which the remaining 96% of project costs is distributed equally among locally controlled funds, corporate sponsorships, and District 4 Community Funding.
Following completion of the service design process and the development of a preliminary framework for implementing and funding both a pilot and potential long-term service, The Transportation Authority conducted a second round of community outreach in Summer 2024. The purpose of this outreach was to confirm community support for the proposed service design and to gather feedback on key elements of the funding strategy, with particular attention to the potential role of the District 4 community in supporting permanent operations.
Outreach methods included a virtual town hall held on June 26, 2025, attended by various community leaders and residents, as well as a presentation at the Outer Sunset Merchants and Professionals Association meeting on July 21, 2025. In addition, the study team engaged directly with local stakeholders and community members through one-on-one conversations to gather more detailed feedback and perspectives.
Overall, community members expressed broad support and enthusiasm for the proposed on-demand shuttle service, while offering thoughtful feedback on key aspects of its design and operation. Participants emphasized the importance of ensuring that the service is fully accessible to seniors, people with disabilities, and monolingual speakers. Several participants also recommended accepting alternative forms of payment for individuals who may not use Clipper cards. Additional feedback included suggestions to establish clear policies regarding age limits for unaccompanied minors using the service and to consider the potential travel needs of students, who may rely on the shuttle more frequently than other groups.
On the funding side, community feedback was more limited. Some participants noted that the proposed shuttle represents a premium service and could warrant a higher fare than standard Muni service. Others suggested exploring advertising or sponsorship opportunities as a way to offset operating costs. Long-term funding concepts, such as the creation of a PBD, the use of development fees, or shifting funding from existing services, did not elicit specific feedback from participants.
Peer agencies operating on-demand services have experimented with a variety of procurement practices and management approaches for delivering their services, which have yielded some important lessons for future services. This chapter briefly summarizes key considerations in the areas of regulatory considerations, contracting issues, and agency roles and responsibilities during the pilot.
The sponsor of a pilot will need to ensure that the shuttle service adheres to applicable laws and regulations. Since pilot projects are only a temporary commitment of resources, they often receive exemptions from some of the requirements that would apply to a permanent service. However, in the interest of testing how the shuttle would function over the long-term, it may be worth designing the service to meet most or all the requirements now, so that planners can develop robust conclusions about its feasibility and sustainability.
The exact requirements that will apply to the shuttle depend partly on future implementation choices such as the size and powertrain of the vehicle selected for the service. Also, state and federal funding programs often include a variety of obligations as part of their master funding agreements which may apply to the shuttle. If a contract operator provides the service and federal funding is used to pay for it, then it is likely that the requirements of FTA Circular 4220.1F (“Third Party Contracting Guidance”) will also apply to the procurement.Source: “Third Party Contracting Guidance”, Federal Transit Administration, 2013. It is beyond the scope of this study to enumerate every potential law and regulation that could apply, but the following examples illustrate the kinds of requirements that could be especially relevant to a new shuttle service.
If the project sponsor contracts with a third-party service provider to deliver the service, there are several issues that must be considered when writing the request for proposals and subsequent contract with the selected vendor. The following examples illustrate the kinds of policy topics that could be especially relevant to a new shuttle service.
Implementing an on-demand shuttle service requires significant effort, including to design and launch the service, as well as managing ongoing operations. As noted previously, this study recommends that the pilot’s agency sponsor contract with a third-party vendor to provide the actual shuttle service as a turnkey operation during the initial pilot, both to support more efficient deployment at the outset of the pilot and to allow for more rapid prototyping during the two-year operating period. This is the approach taken by SFMTA for their Bayview Community Shuttle, discussed further below. This will help to simplify the customer service aspects and the physical operation of the shuttle.
A number of agencies are potential options to take on each of the various administrative and oversight functions that will be required before, during, and after the pilot. Briefly, these include:
SFMTA is using the contract operator approach for the Bayview Community Shuttle pilot. Their 2023 RFP yielded three valid bids, and their selected provider, Via, launched the service in November 2024. SFMTA also uses the vendor Transdev to deliver ADA paratransit service, through a contract that was recently renewed through the end of FY 2025/26.Source: “An Update on the SF Paratransit Program and Five Year Contract Option”, San Francisco Municipal Transportation Agency, 2021. Their experience with managing these third-party vendors and integrating those services with the overall Muni service offering could be useful in deploying a new contracted service in a different part of the city. As noted above, there may be internal and external economies of scale from combining a new shuttle service area with one of these existing contracts.
The Transportation Authority has relevant experience including procurement and management of contract operations in the agency’s capacity as the Treasure Island Mobility Management Authority (TIMMA). More specifically, TIMMA contracted with the company Beep to deploy the Loop, a five-month pilot of a fixed route shuttle on Treasure Island using autonomous shuttles, and is currently advancing implementation of an internal on-demand shuttle service on the islands.
Most funding partners require a designated lead agency on grant applications. Any agency sponsor must coordinate with SFMTA throughout the pilot to support effective Clipper deployment, customer messaging, and financial management. Any agency sponsor will also lead coordination with other relevant parties such as engagement with MTC.
A pilot project with at least one year of operations would allow sponsors to assess the performance and viability of the shuttle and make interim refinements to align the service to community needs. It also allows the vendor to tailor their operating procedures to local conditions and refine costs.
Piloting first is the standard practice in the industry. The majority of the peers researched for this study started with pilots — some were brief, and some extended for as long as four to five years before being converted into permanent service. Pilot services that did not survive were often canceled with manageable community concern, because they were introduced as pilots. Those services that succeeded were able to evolve and scale based on what they learned during the pilot. Another benefit of a pilot is that it helps to build community support for the service that may be necessary to secure funding a to sustain service beyond the pilot phase.
If the project is successful in obtaining pilot funding, then planners will need to shift to the procurement phase. The traditional procurement phase takes approximately twelve months after funding award to execute the procurement, which will need to include all of the following steps:
One interesting procurement option to the traditional bidding process is the two-stage bid, as was used by the Los Angeles County Metropolitan Transportation Authority (LA Metro) for their on-demand service. In this model, the first phase is used to pre-qualify multiple shuttle providers using a set of minimum requirements. The successful pre-qualified bidders are then offered a short “development phase” contract, during which they receive modest compensation for their assistance in refining the overall shuttle concept and implementation plan. Then, once the final plan is developed, the development phase firms bid on the refined service plan. This approach is not necessarily shorter than a traditional procurement. However, sponsors may benefit from having vendors provide insights on the large number of design decisions and policy considerations.
Project planners should determine in advance of issuing the RFP what criteria they will use to judge the success of the shuttle and determine whether service should be continued, pending funding availability, after the end of the pilot period. During the peer research and industry interviews conducted early on in this study, multiple peer transit operators recommended that on-demand services should not be judged entirely on traditional transit operating metrics such as cost per hour, ridership productivity, or farebox recovery ratio. They emphasized that these services fill an important role in the continuum of transportation services, so other outcomes such as network coverage, customer satisfaction, improving access, and may be more important considerations. At the same time, measures of productivity and cost-efficiency will be important for deciding whether the shuttle is a worthwhile expenditure of public funds compared to other types of transportation investments, especially when resources are limited.
The evaluation should help planners confirm whether the shuttle is successful in meeting the specific goals that led to the launch of the service, based on metrics that are specifically linked to each goal. This study proposes a variety of candidate metrics that could potentially be used to evaluate shuttle performance for each of the three goals. The suggestions below offer multiple ways to understand whether the addition of the shuttle to the set of public-access transportation options provides a value-added service to the community in alignment with its core objectives.
The information in this report can be used to begin developing preliminary targets for some of the metrics above. For example, Figure 4-1 shows a map of the walkshed areas near SFMTA transit stops in the district. This map could be combined with the demographic maps in Appendix C to estimate the number and share of residents of different demographic groups who have different levels of access to transit under current conditions. A similar map could be produced once the set of virtual stops is confirmed by the shuttle vendor, allowing for a before-vs-after comparison of how much access changes with the addition of the shuttle. Similarly, it is possible to compute typical access time for transit under current conditions by combining the average walk time to the nearest stop with the expected wait time based on the frequency of the transit line(s) that serve that stop. Once shuttle operations begin, the vendor can report data on wait times and the walk time between the customers’ origin points and pickup points in order to compute an average access time and for comparison to the corresponding transit data. It is expected that a shuttle would have shorter walk times and wait times compared to transit.
Other metrics already have implied targets based on the forecasts and analysis developed for the service plan presented in this report. For example, the demand forecast indicates that total shuttle ridership is expected to be approximately 294 customers per weekday and 196 customers per day on weekends and holidays, for a combined total of 96,000 per year. As discussed before, based on the operating cost for the service plan proposed in this study ($2.5 million to $3.0 million per year), the resulting operating cost per customer trip would be in the range of $26.04 to $31.25 per trip. Based on data from the 2024 NTD, this is higher than the current cost per trip on SFMTA fixed route bus ($6.59), or light rail ($8.53); while demand response costs are considerably higher ($91.19).
It should be noted that the actual cost per trip for the shuttle will be highly dependent on customer trip patterns within the service area and the resulting vehicle utilization, i.e., the number of customers that can be served by the same vehicle at the same time. High levels of utilization (above 3.5 to 4 trips per vehicle hour) will result in more customers carried using fewer service hours, which reduces the operating cost and the cost per trip. If trip patterns are not well suited to shared rides (less than two trips per vehicle hour), more vans and service hours are needed, and the cost per trip will go up.
Ongoing monitoring of the shuttle will enable refinement over the course of the pilot, with the intent of improving progress towards desired outcomes. In addition to the core evaluation metrics described above, project sponsors will also need to monitor the performance of the shuttle during the period of pilot operations to help refine the service offering, tailor periodic adjustments to the shuttle, and report back to funding partners about performance outcomes.
Different reporting activities require varying levels of effort, and so it is expected that some types of metrics would be collected and reported quite often while other monitoring will only happen a few times during the pilot. This study contains a potential set of monitoring metrics and a proposed timeline for their reporting and analysis. Items shown in italics are lower priority for managing the pilot deployment, but they may still be informative for contractor oversight or long-term planning.
A pilot would provide evaluation results to inform whether the shuttle has advanced local goals and meets performance expectations, and whether it should be recommended for continuation.
The project sponsors should also incorporate findings from and compare performance to the Bayview Community Shuttle pilot and the planned Treasure Island shuttle (which may also be implemented before the District 4 pilot) when making a recommendation about whether to seek long-term funding for the pilot or a refinement thereof.
A permanent service could continue with a contract operator arrangement or look to SFMTA to directly operate the shuttle. As noted earlier in this report, this will not be an all-or-nothing question, because the City can decide to subcontract only some of the operational functions to a third party.
Another option to consider would be shifting the shuttle administration and general oversight to a quasi-independent organization such as a Transportation Management Association (TMA) or a BID or CBD (as discussed above in the funding options section). These organizations typically pool resources to manage common neighborhood needs, and they may be a more appropriate entity to manage a small-scale operation, particularly if they are also the primary source of local funding.
Once these decisions are made, it will be possible to explore other ways to gain efficiencies. If the service were to become part of SFMTA’s operations, this might include software integration with existing data and reporting systems, such as Automated Vehicle Location, Automated Passenger Counters, driver scheduling, dispatching, ridership reporting, revenue management, and data collection for NTD reporting. If the service is brought under the auspices of a neighborhood TMA or BID or CBD, the sponsor might pursue further refinements to the service plan or developing marketing partnerships to promote and support the service over the long run.
This study considered a microtransit shuttle as a strategy to improve intra-district transit travel in District 4, in alignment with the District 4 Mobility Study findings. Transit is not competitive with private vehicle travel for many local trips, particularly those between residential areas and commercial corridors, due to required transfers or long walk distances. These challenges are especially significant for seniors and people with mobility disabilities.
Following District 4 Mobility Study guidance, an on-demand shuttle is the option considered in this report to address this need. Industry research and peer reviews indicated that an on-demand service is a good match for the district’s size, land use make up, and mobility patterns. Typically, on-demand services are deployed in less dense areas so the initial ridership estimate for this service of 294 passenger trips per day or nearly 100,000 passenger trips per year amounts to a high level of ridership compared to observed data from peer on-demand services offered in less densely developed areas.
The approximate cost of a one-year pilot as described in this report would be in the range of $3.1 million to $3.6 million. This estimate is slightly higher than other peer on-demand services, primarily due to cost of living in San Francisco. The range in cost is driven largely by variations in cost inputs for driver labor and vehicles, which are driven by policy decisions that the project sponsor would make.
The project does not appear to be either eligible or highly competitive for most existing external grant funding sources reviewed: however, there is possibility for a new round of grants at the state and regional levels associated with climate and adaptation, as well as demand management and equitable access which may open new funding opportunities. There is also potential to pursue community-directed funding through the legislative budget process. A pilot would likely require support from non-governmental sources, such as revenues from operations (fares or advertising), and corporate or community sponsorships. The pilot would test both mobility performance outcomes and explore stakeholder level of support around the project’s importance and long-term value to the community.
The Transportation Authority’s Westside Network Study is an opportunity to evaluate the potential value of a District 4 on-demand shuttle within the context of other local mobility offerings, such as the SFMTA’s Essential Trip Card. Additionally, as the SFMTA’s Bayview Community Shuttle approaches the completion of its initial pilot phase and funding, and a new on-demand shuttle is planned for Treasure Island, local agencies will learn more about the performance profile of on-demand microtransit in San Francisco — and help inform how the District 4 shuttle fits within San Francisco’s menu of mobility and access options for reducing automobile mode share.
This appendix presents information collected through a literature review of research reports and online sources for 25 on-demand services across the country.
Internet research on a variety of service types (on-demand vans, TNC partnerships, and fixed route shuttles) at 25 locations in the U.S. yielded the following high-level findings:
Services were compared based on the following attributes:
Some data, particularly financial information and ridership statistics were not readily available online. Moreover, some of those data that were available were not always comparable across agencies. Table A-1 at the end of the appendix summarizes the research results for the 25 organizations.
On-demand service has been and is being deployed widely across the county to address different challenges and policy goals. Several agencies have operated on-demand services for many years, initially starting as a pilot and transitioning to an established and ongoing service offering. This suggests that the concept has succeeded in many locations, moving from pilot phase to ongoing operation as an established service option. The literature review and research provided several lessons learned on best practices for an on-demand shuttle service. The most common use of on-demand services is to either replace low ridership routes or to supplement fixed route networks.
Some transit agencies, such as the Alameda-Contra Costa Transit District, Pinellas Suncoast Transit Authority, and Dallas Area Rapid Transit (DART) implemented on-demand services to replace low performing bus routes. On-demand services can be more productive than fixed routes in areas with lower density and ridership demand. These services are particularly successful as a first/last-mile connection to fixed routes, particularly at transit centers or rail station hubs.
Other agencies use on-demand services to complement fixed route services by serving trips that are not well-served by fixed routes. Examples of such applications include:
Some agencies found that on-demand services were able to serve an equity need, specifically providing needed access for their senior and people with disabilities populations. These services typically do not see very high ridership, so success should be measured in different ways (i.e., access to jobs, healthcare, transit connections, etc.). It is important to note that many on-demand services that provide an alternative to fixed route services recognize the importance of the service in improving access to opportunity for target populations, such as low-income residents.
Ten agencies were selected for staff interviews from the list in Appendix A. These agencies’ services operate in areas like the district in terms of demographics and size. In addition, selection was based on the agency’s industry reputation and existing contacts between staff and the project team. The ten agencies included:
The project team reached out to each agency to conduct a 60-minute interview to gain insights that could not be determined from their website. Interviews were conducted with eight of the agencies between January and March 2023: METRO, DART, LAVTA, LA Metro, CapMetro, City of Jersey City, City of West Sacramento, and King County Metro (SacRT and C-TRAN were not available for interviews). Questions asked during the interviews focused on three topics: planning, operations/evaluation, and additional lessons learned.
Table B-1 shows a summary of the findings from the interviews grouped by topic, with detailed interview summaries included later in this appendix.
In addition to the interviews, the project team also requested and received various data from each agency (including SacRT and C-TRAN) that are shown in Table B-2. Some services had multiple zones that had higher densities and are shown in the table for further comparison. The district has a smaller area and denser population than the services that were interviewed, potentially indicating that the district would be a strong on-demand service area.
The Operating Model Variables Summary Table (provided at the end of this appendix) shows various operating variables determined from the agencies that were interviewed and is grouped by service information, service area characteristics, service information, and service performance.Results for GoLink (DART) and Metro Micro (LA Metro) are not included in the table due to lack of available data. The table provides as much data as the agencies were able to provide with some cells left blank due to lack of information. Most of the agencies provide service Monday to Saturday between 7:00 a.m. and 7:00 p.m. Service areas ranged from 1.4 (Rose Village in Vancouver, Washington) to 66 square miles (Go Tri-Valley in Dublin/Livermore/Pleasanton, California) with an average of 12 square miles. Utilization of the services was an average of three rides per hour.
This section presents information from each of the agencies that were interviewed regarding planning, operations, evaluation, and lessons learned.
Interview Date: Wednesday, January 25th, 2023
curb2curb is an on-demand service provided by METRO. The service is available in certain communities without immediate access to a METRO bus route. It operates in a defined zone and doesn’t travel standard route. Customers can either board the vehicle at a specific anchor point or schedule a pick-up at a requested location.
METRO began its System Reimagining Project for their local bus network in September 2012. At the time, there were many routes classified as “poor performing services” on which the total subsidy per boarding exceeded 100% above the total subsidy per boarding for all local bus routes. The concept for the curb2curb service was to offer an alternative to fixed route service that would be implemented at a comparable total subsidy per boarding or less from the existing poor performing services. Criteria for the proposed zones included areas with low ridership, high concentrations of older and low-income residents, circuitous and disconnected street patterns, and poor pedestrian environments. The agency has since implemented four zones. Each zone has an anchor pick-up point where customers can access the service every hour.
METRO currently has a contract with RideCo that provides app service and route scheduling. METRO also has a contract with MV that provides the agency with both paratransit and on-demand services. METRO provides a certain number of on-demand and paratransit vehicles while MV provides maintenance, scheduling, and some operators. Each year METRO staff evaluate all services on four indicators: boardings per revenue hour, boardings per revenue mile, fare recovery/operating ratio, and total subsidy per boarding. While the service is very costly (total subsidy per boarding far exceeds the total subsidy per boarding on local fixed route services), curb2curb enjoys high customer satisfaction, growing ridership, and increasing demand.
While curb2curb is generally considered a success within the agency, staff mentioned some ways to ensure success of a future similar service. Creating an easy-to-understand concept is crucial for the public and stakeholders to understand how and where the service will operate. After implementation, it is important to have strong buy-in within the agency to ensure rash decisions are not made if there are some initial issues with the service. Staff mentioned that the main challenge moving forward is the ability of the service to be sustainable from both a financial and a resource standpoint.
Interview Date: Thursday, January 26th, 2023
Go Tri-Valley is a ride share program run by LAVTA. Go Tri-Valley replaced the original Go Dublin program in April 2020. The service offers discounted ride share trips using Uber and Lyft for up to $5 in Dublin, Pleasanton, and Livermore.
Planning for Go Tri-Valley began with LAVTA launching a comprehensive analysis of their fixed route network after years of declining bus ridership. The analysis concluded with a recommendation to implement a ride share discount program. LAVTA worked with Uber and Lyft to set up agreements and determine the pay structure for the program. LAVTA’s goal was for the program to complement rather than compete with the existing fixed route network. The program has experienced high ridership and a relatively positive reputation.
LAVTA has a contract with Uber and Lyft to run the program. Uber and Lyft operate as they normally do in other locations with the customers receiving a discount on their fare if they take a trip within the service area. The dynamic nature of this program allows LAVTA to provide service to areas that are not currently served by their fixed route network. LAVTA has realized that Uber and Lyft are increasingly eager to work with transit agencies and they have a positive relationship with the companies. Uber and Lyft have offered to send out surveys to gauge satisfaction of the service. LAVTA regularly reports ridership for the program to their Board.
LAVTA mentioned plenty of best practices to both follow and avoid. If the decision is made to move forward with a similar ride share discount program, it is important to request as much data as possible to gauge the effectiveness of the program and determine any necessary changes. Ensuring quality customer service and quality control of the program can be difficult on the agency’s side when most of the program’s logistics are handled by Uber and Lyft. Keeping the program as simple as possible (easy to understand service area and fare structure) is key to building public support for the program. While implementing a turn-key solution like Go Tri-Valley can be an easier option, it does require giving up some control over the program. LAVTA also stressed the important of educating the public on the program. For many, this will be a new concept that may be difficult to understand.
Interview Date: Monday, January 30th, 2023
Via Rideshare is an on-demand curb-to-curb ride share program run by the City of West Sacramento and operated through a partnership by Via. The service is available to customers throughout the city for a flat fare of $3.50. Customers with disabilities and seniors can ride with a discounted fare of $1.75.
The City of West Sacramento has a $2.2 million annual contract with Via to operate the program. Each trip is highly subsidized by the city with the total cost per customer totaling between $9 and $10 depending on the month. Program operations, including customer service and drivers, are mainly provided by Via; however, vehicles are rented from the city and maintenance is outsourced. The city tracks buyers of weekly passes and has asked Via to collect additional data but does not track any other data via dashboard. In 2022, the city conducted a survey of customers to better the usefulness of the service and identify important destinations. A project manager and success manager from Via meet biweekly with the city. Ideally, the city would like to better integrate the program with fixed route transit service. The program has been successful with ridership recently surpassing pre-COVID levels.
The city stressed the importance of centering equity as a guiding principle when developing an on-demand service. The city noted that in the case where there is a trade-off between cost and need, it is crucial that disadvantaged communities are prioritized in decision-making. On-demand service is a costly but essential service for people who have no alternative means of transportation, especially in a city where fixed route transit is unreliable or nonexistent. While funds from the TDA have been used to support the program, the city recommended exploring other funding sources.
Interview Date: Tuesday, January 31st, 2023
Via Jersey City is an on-demand, dynamically routed, mobile-app powered shuttle service provided in partnership with the City of Jersey City. The service is open to all residents, workers, and visitors to Jersey City. There are two service areas: the Central Zone and the Outer Zone. All trips are allowed except for those within the Central Zone only.
The service was launched in February 2020 in response to service cuts to the existing fixed route network. The cuts to New Jersey Transit routes negatively affected the transit-dependent population of the city and service was still required to fill these gaps. The city decided to partner with Via to develop a shuttle service broken into two zones: the Central Zone and the Outer Zone. Trips within the Central Zone are not allowed so that the service does not compete with the existing fixed route network. The service is mainly used to access the city’s various transit hubs to connect to rail service to New York City.
Contracting with Via allowed Jersey City to implement a turnkey option. Most of the operations for the service are provided by Via including drivers, vehicles, and route technology. This provides a seamless package for the city, albeit at a higher cost. Via also provides robust data to the city. Quarterly performance reports are developed to provide data on ridership, wait times, on-time performance, and origins and destinations of trips. The city and Via meet regularly to review performance and determine any necessary changes to the service. The service has been extremely popular, and the city has already expanded operations in 2021.
City staff mentioned that the popularity of the service can be an obstacle to overcome. It can be difficult to provide enough supply to meet the increased demand. Coordination with Via has been key for the city to address this issue. The city mentioned that conducting outreach to advertise the service is key to ensuring high usage. Starting with a smaller service area to test the effectiveness of the service and work out any issues before expanding was mentioned as something to keep in mind. The city mentioned they have a positive relationship with Via and the data they receive allows them to make changes to the service to better serve those that are using it the most.
Interview Date: Thursday, February 2nd, 2023
Via to Transit (now Metro Flex) is a point to hub on-demand service and is one of three on-demand programs run by King County Metro. The service is open to all customers and operates in four service areas: Othello, Rainier Beach/Skyway, Renton, and Tukwila. Ride Pingo to Transit is the other point to hub on-demand service and operates in Kent and Community Ride, a point-to-point service, operates in the Juanita Area and Sammamish. While each program has a different operator, King County Metro recently signed a contract to consolidate these three services into one program with the same operator. The existing service zones will not change.
Through their new consolidated service, King County Metro is aiming to provide greater accessibility and mobility to jobs, community assets, and fixed route transit service in areas that are difficult to serve with traditional fixed route transit. King County Metro’s core values of equity, environment, and sustainability have guided the planning process. When developing the existing service zones, King County Metro used a prioritization method based around transit hubs. They started with 140 transit locations and developed a two-mile walkshed around each one with a density filter to look for low to moderate population densities. Equity scores at the block group level were assessed to identify BIPOC and low-income communities as well as block groups with high populations of immigrants and refugees, English language learners, and people with disabilities. Accessibility scores were also evaluated to identify the number of jobs and services within a 45-minute transit ride to prioritize areas with low fixed route transit accessibility.
King County Metro currently has contracts with Via, Pingo, and Hopelink/Spare Labs to operate Via to Transit, Ride Pingo to Transit, and Community Ride. Once consolidated into one program, all service will be point to point and customers will be expected to walk 600 meters to be picked-up unless they have mobility difficulties. Under the new service contract, King County Metro’s operator will provide a call center, maintenance, vehicles, driver staffing and subcontracting, fare collection, testing, training for drivers and call center operators, and data sharing and serving. King County Metro will provide marketing and communications, with support from the contractor.
Labor was one of King County Metro’s biggest concerns when planning their service. They highlighted the importance of paying drivers a livable wage and ensuring that their values as an agency were prioritized in the planning process. King County Metro also noted the financial challenges associated with running separate on-demand programs with different operators such as differing costs per customer.
Interview Date: Wednesday, February 22nd, 2023
Pickup is an on-demand service provided by CapMetro. Pickup operates in ten service zones. It is a shared-ride service that takes multiple customers heading in the same direction and books them into a shared vehicle. The customer enters their destination into the app and CapMetro will match them with a vehicle going their way. The customer will be picked up at their destination and dropped off at their destination.
Pickup began as a dial-a-ride service that was not effective in serving customers’ needs. CapMetro released an RFP for the service in 2017 and piloted a software with Via in 2018. The pilot operated in a part of Austin that was experiencing high levels of growth and development. The service has expended to serve ten zones spread throughout the city. The service is typically used to either replace poor-performing fixed routes, provide first/last-mile connections, or provide an alternative service to paratransit users. The zones are kept small, no larger than three square miles so the agency can provide pick-up times under 15 minutes. The service is focused on equity and bridging gaps in the city’s transportation network. The service focused on serving populations with high concentrations of households under the poverty line, seniors, and zero-vehicle households.
CapMetro began utilizing ADA paratransit operators for Pickup operations. The agency also repurposed some of their old paratransit vehicles to use for the service. Pickup uses different service providers, but they all provide wheelchair accessible vehicles that also have bicycle racks. The vehicles seat about 13 customers and are like an airport shuttle. The service sees about 3.5 customers per hour across the ten zones with about five vehicles used per zone. The service beings operating two vehicles in the morning and then deploy more throughout the day as needed. The vehicle operators are unionized even though they are with a service provider. CapMetro established target metrics for the zones at first and re-evaluated the zones six months after implementation.
CapMetro suggested that utilizing a turnkey service is useful in the number of zones is small and there are no more than 20 vehicles in operation. Pickup found they were more successful when the service zones were smaller as that helped with operational costs. CapMetro mentioned that evaluating the service holistically is important and solely looking at costs will not provide an accurate sense of the success of the service. The agency also discussed their difficulties in marketing the service. CapMetro said it was useful to wrap the vehicles and educating the public was a key component of implementing the service. Most importantly, CapMetro emphasized that it’s important to not cut corners on the service and ensure it is of the highest quality to serve customers best.
Interview Dates: Thursday, March 2nd, 2023, and Monday, March 6th, 2023
GoLink is an on-demand service provided by DART. GoLink provides curb-to-curb service within a designated zone for customers using a variety of vehicles and providers. GoLink has expanded to serve 32 zones throughout the DART service area. GoLink is available from 5:00 a.m. to 12:00 a.m., seven days a week in most zones.
DART on-demand service began as a call-in operation in 2000. In 2007, the service expanded and incorporated software from Trapeze to schedule trips. GoLink began in 2018 with eight service areas. In 2022, the service expanded to 30 zones to alleviate a reduction in fixed route bus service. As part of the recent DARTzoom Bus Network Redesign project, GoLink expanded to its current number of zones and increased their service hours to match the fixed route bus network. The expansion of GoLink was primarily to lower density and lower ridership zones that saw a loss of fixed route service as part of the redesign project. DART has also begun expanding service areas to cover commercial zones as well as residential areas. Each zone provides service to a rail station or transit center for connections to other DART services via an anchor point. Most customers use GoLink to transfer to one of these anchor points.
DART has a unique partnership with Uber to provide service for GoLink. Using DART’s GoPass app, customers can book a trip and will either be paired with a DART-operated vehicle or an Uber driver. The process is seamless, and the customer is presented with the best option to complete their trip. DART aims to keep GoLink pick up times under 15 minutes and the integration with Uber allows for the agency to meet that benchmark. DART also uses benchmarks such as customers per revenue hour and subsidy per customer to measure performance of the service. When a zone performs under 75% of the overall average, a review is conducted to determine how to improve performance.
Despite the overall success of the service, DART has experienced negative feedback in some parts of the agency’s service area. Customers in these areas were upset that GoLink replaced fixed route bus service. DART recommended strong messaging about the benefits of the service to help overcome this. DART also indicated they tried to keep their zones around six square miles in size. Technology has played a huge role in the success of GoLink. DART mentioned that sophisticated technology on the back end should be in place before implementing a coordinated service like GoLink.
This appendix documents the results of an analysis of travel patterns and estimates ridership for on-demand service in the district. The analysis includes demographic and travel demand data for the district and key destinations just outside of the district. It also includes a high-level estimate of ridership based on methodologies and statistics from peer agencies.
The District 4 Mobility Study determined the focus of the potential on-demand service to be for trips within the district, primarily to and from commercial areas. The service would provide an alternative to residents using a private vehicle for such trips. As shown in Figure C-1, the district is bounded by John F Kennedy Drive to the north, 19th Avenue to the east, Buckingham Way/Winston Drive/Lake Merced Boulevard/Sloat Boulevard to the south, and Great Highway/Pacific Ocean to the west.
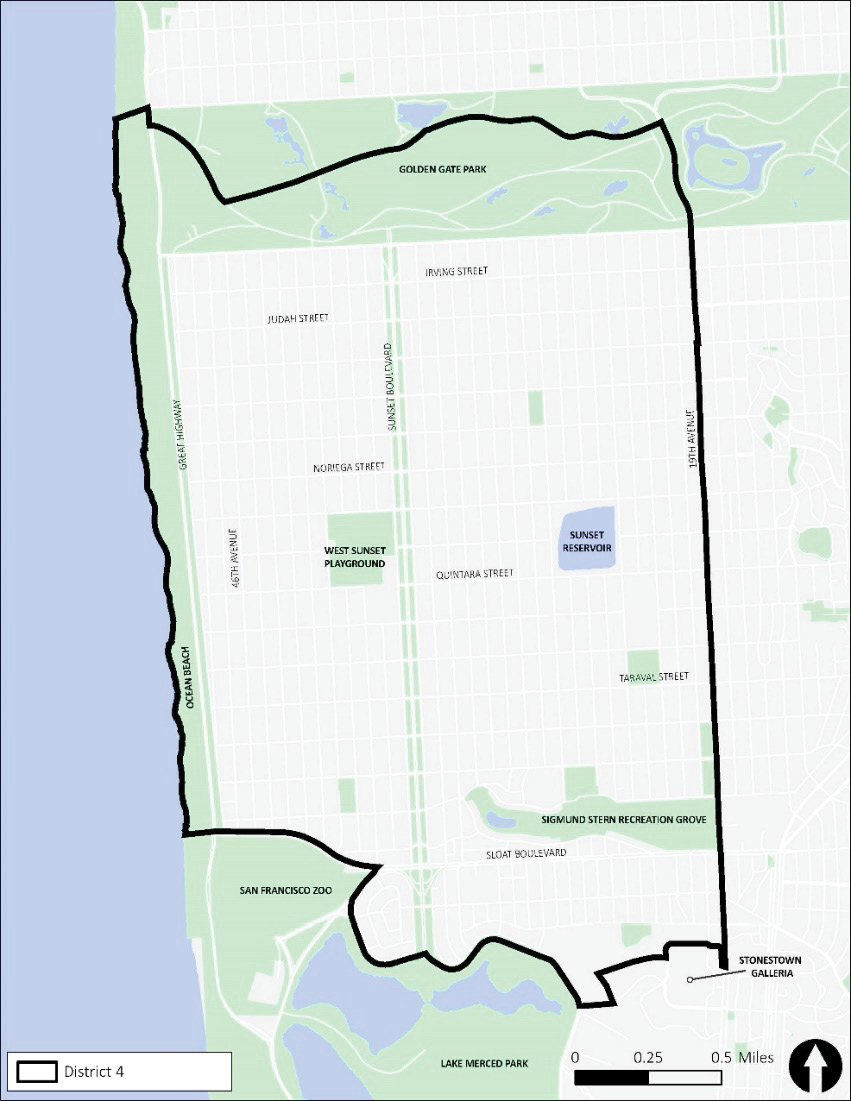
Table C-1 provides a comparison of demographics between the district and the entire City of San Francisco. The district has fewer people and jobs per square mile but has higher levels of minority populations and seniors. The low percentage of zero-vehicle households indicates the need for a better alternative to SOV use.
The district encompasses roughly 4.9 square miles on the west side of San Francisco. Over 85,000 residents live in the district, with a population density of nearly 17,500 people per square mile. This is higher than historically dense cities such as Chicago, Philadelphia, and Washington, D.C. but lower than San Francisco’s overall population density of over 18,000 people per square mile. It is also higher than many on-demand service areas, which, based on research, tend to be lower-density areas. As shown in Figure C-2, higher population densities are scattered throughout the district with some denser areas in the middle of the district (between Noriega Street and Taraval Street) and towards the southern end of the district (between Sloat Boulevard and Stonestown Galleria).
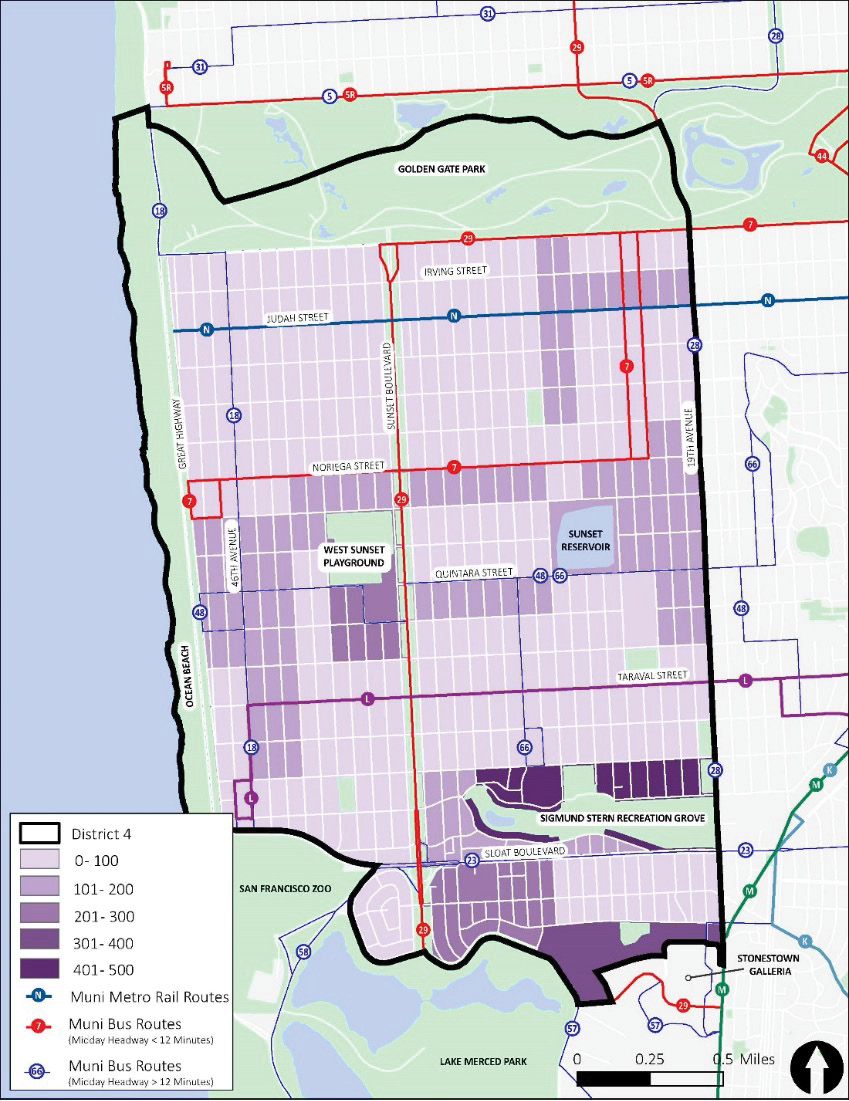
Source: United States Census Bureau, 2023.
The distribution of jobs within the district provides insight into where ridership demand might be higher. As shown in Figure C-3, jobs are concentrated along commercial corridors such as Judah Street and Taraval Street. Some schools also show on the map, including Francis Scott Key Elementary School west of Sunset Boulevard and north of Noriega Street, and Sunset Elementary School and St. Ignatius College Preparatory west of the West Sunset Playground.
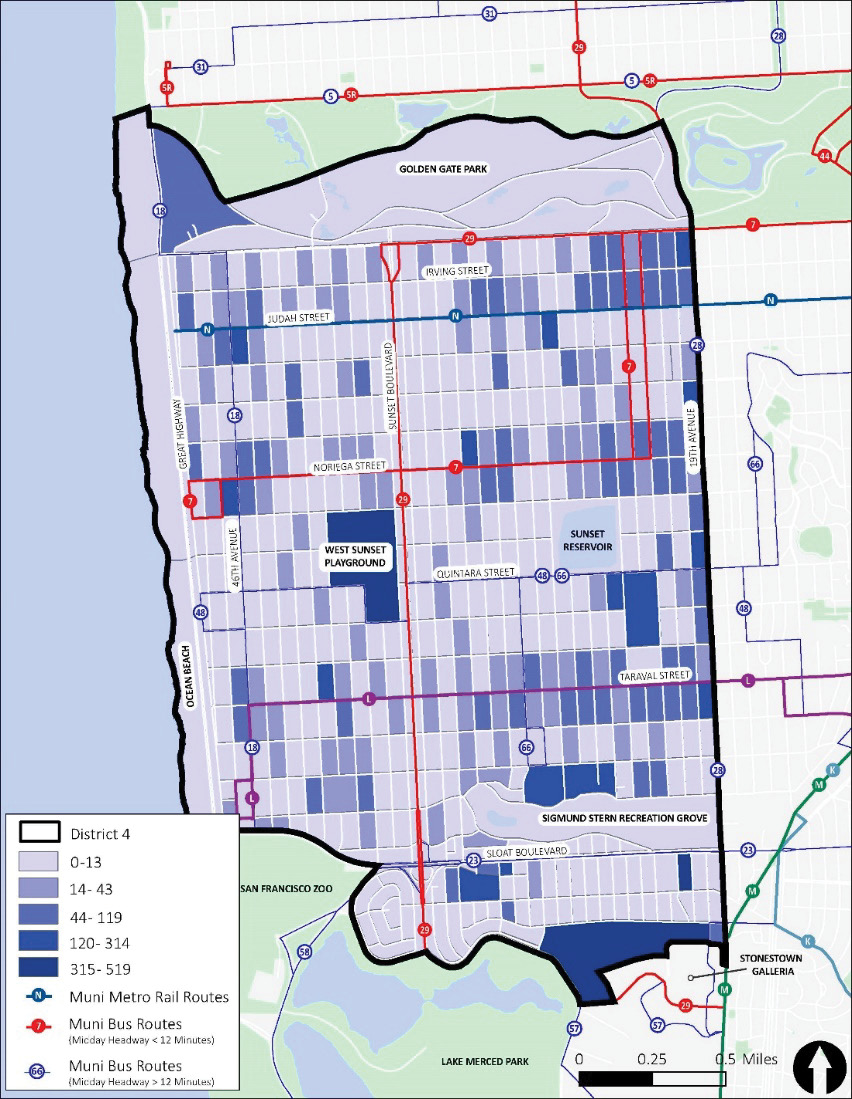
Source: United States Census Bureau, 2023.
Low-income households rely more on transit than higher-income households since automobile availability can be influenced by income. In addition, transit can be a cheaper alternative than driving for some trips, especially if the trip involves paying for parking. While the percentage of households below the poverty levelThe United States Census Bureau uses a set of money income thresholds that vary by family size and composition to determine who is in poverty. If a family’s total income is less than the family’s threshold, then that family and every individual in it is considered in poverty. in the district is relatively low compared to the rest of the city, the largest concentration is in the southwest quadrant of the district as shown in Figure C-4.
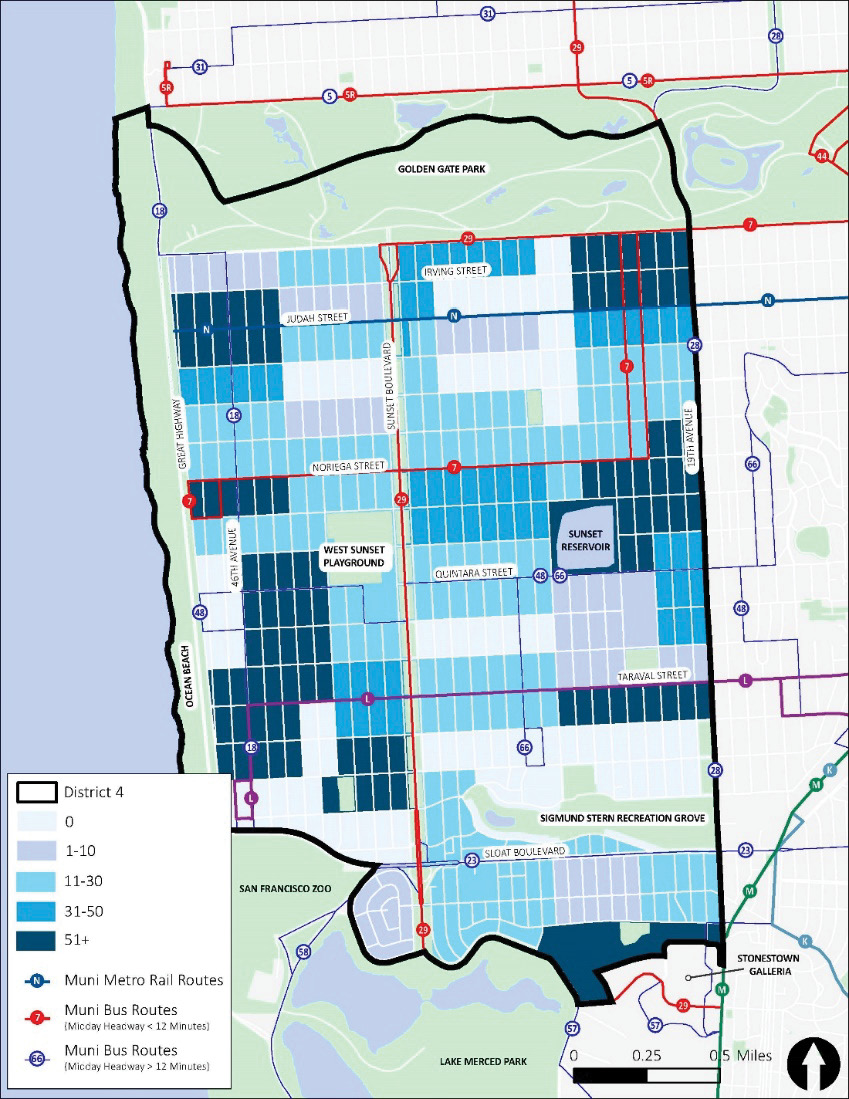
Source: United States Census Bureau, 2023.
Like the city, the district has a majority-minority population. As show in Figure C-5, people of color are dispersed throughout the district with some concentration in the center.
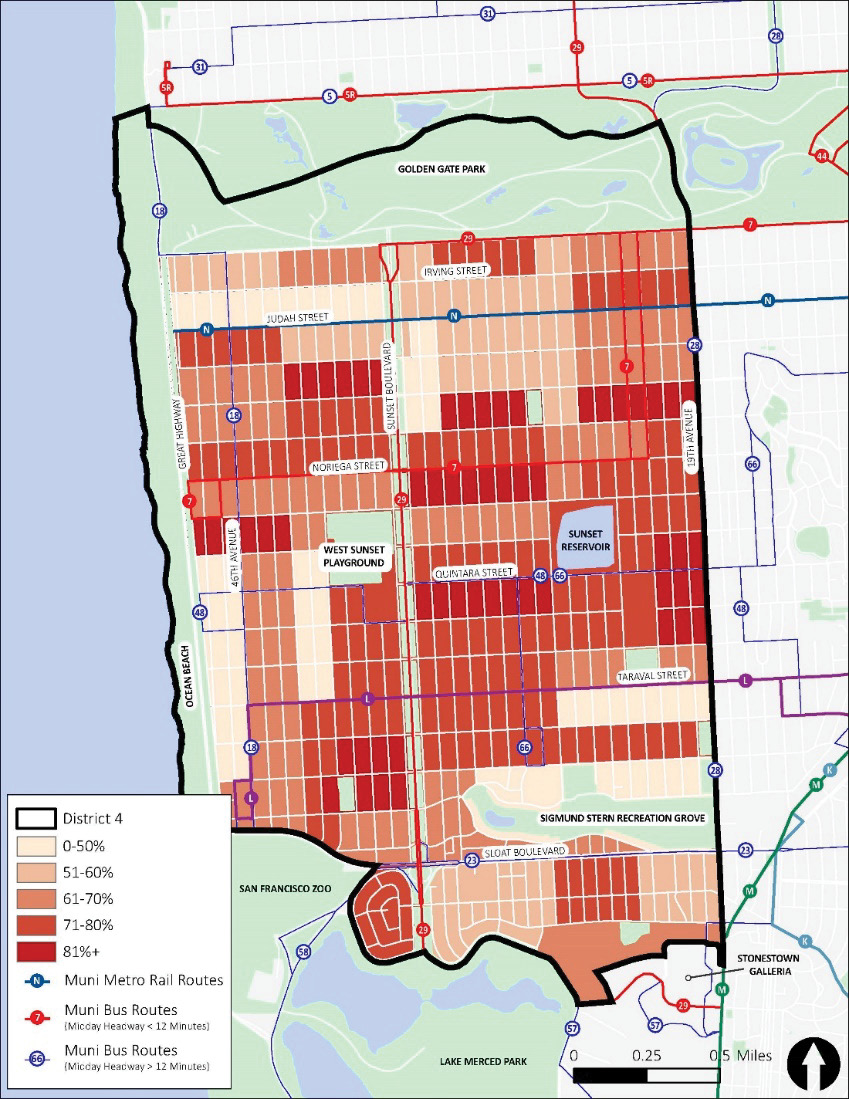
Source: United States Census Bureau, 2023.
Figure C-6 shows a higher concentration of seniors east of Sunset Boulevard. These populations experience more barriers to mobility and are also more likely to live on fixed incomes compared to other populations.
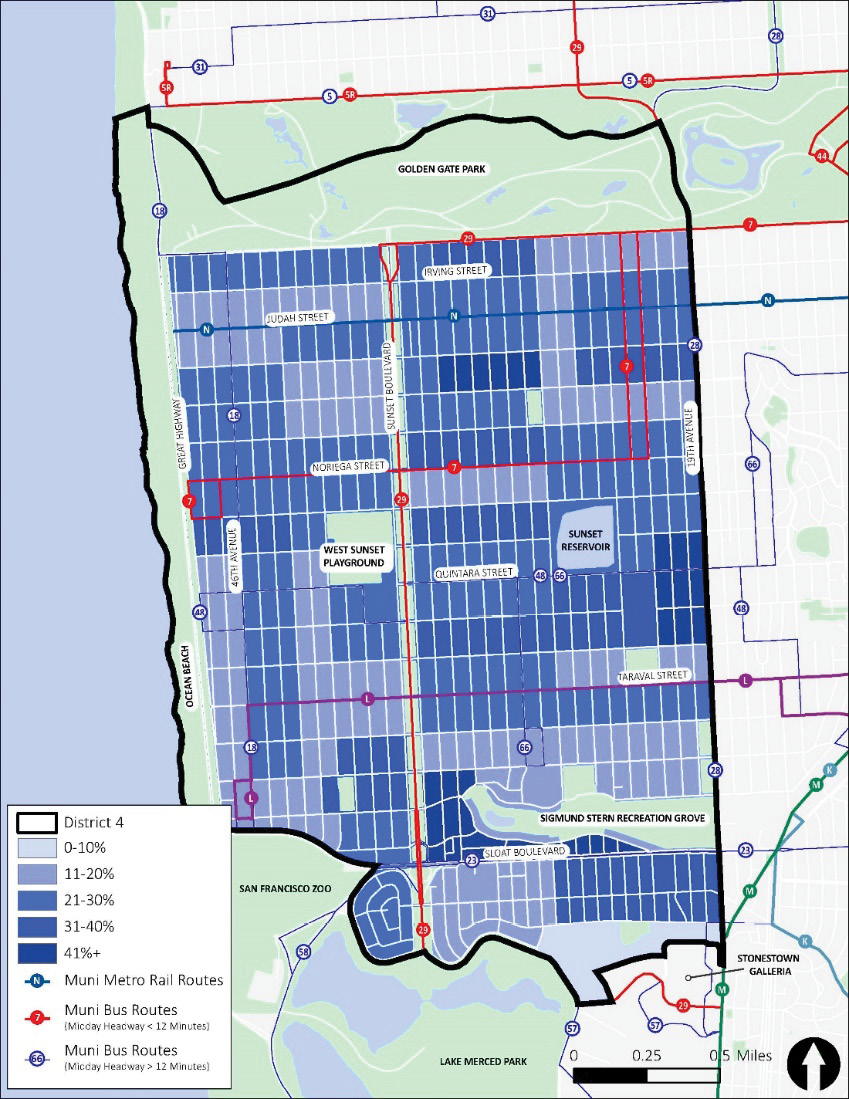
Source: United States Census Bureau, 2023.
Figure C-7 shows that the census tracts along the eastern and western edges of the district have percentages of people with disabilities that exceed the city’s average of 10%.
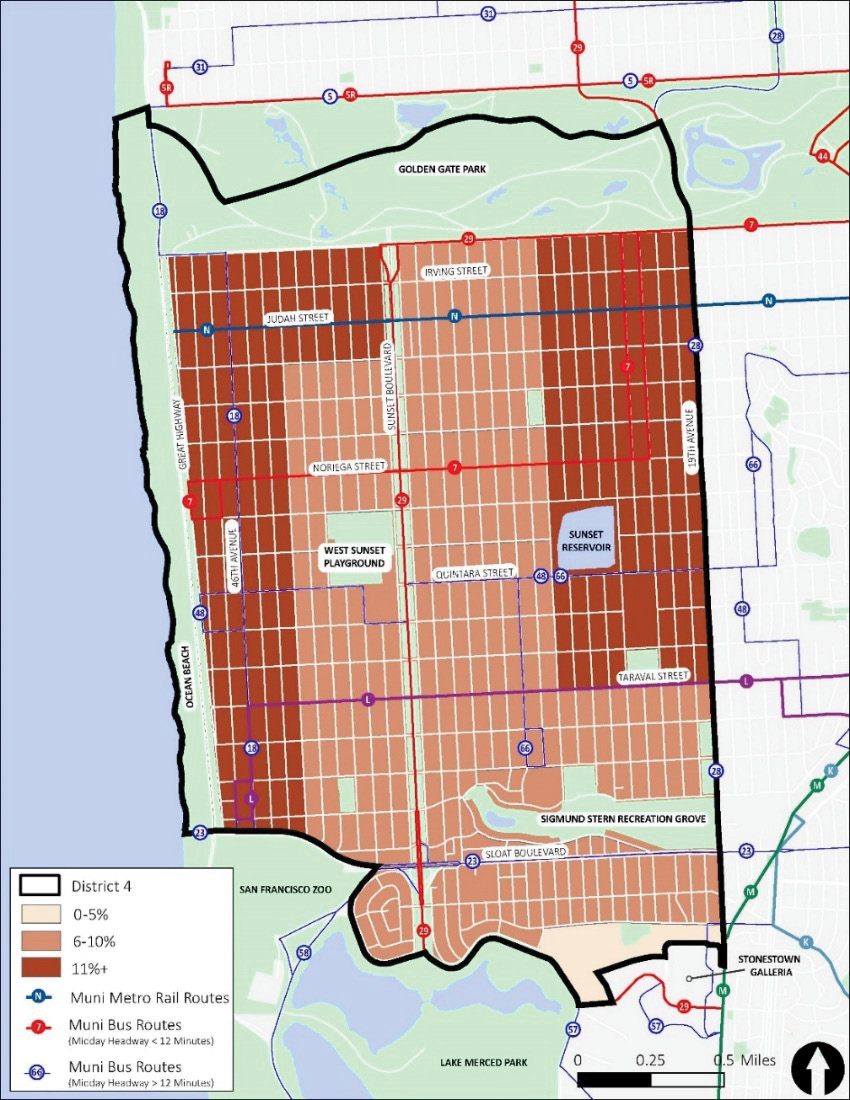
Source: United States Census Bureau, 2023.
The census tract in the southeast corner of the district adjacent to Stonestown Galleria has the highest concentration of zero vehicle households as shown in Figure C-8. The southwest area also has a higher concentration of zero vehicle households relative to the rest of the district.
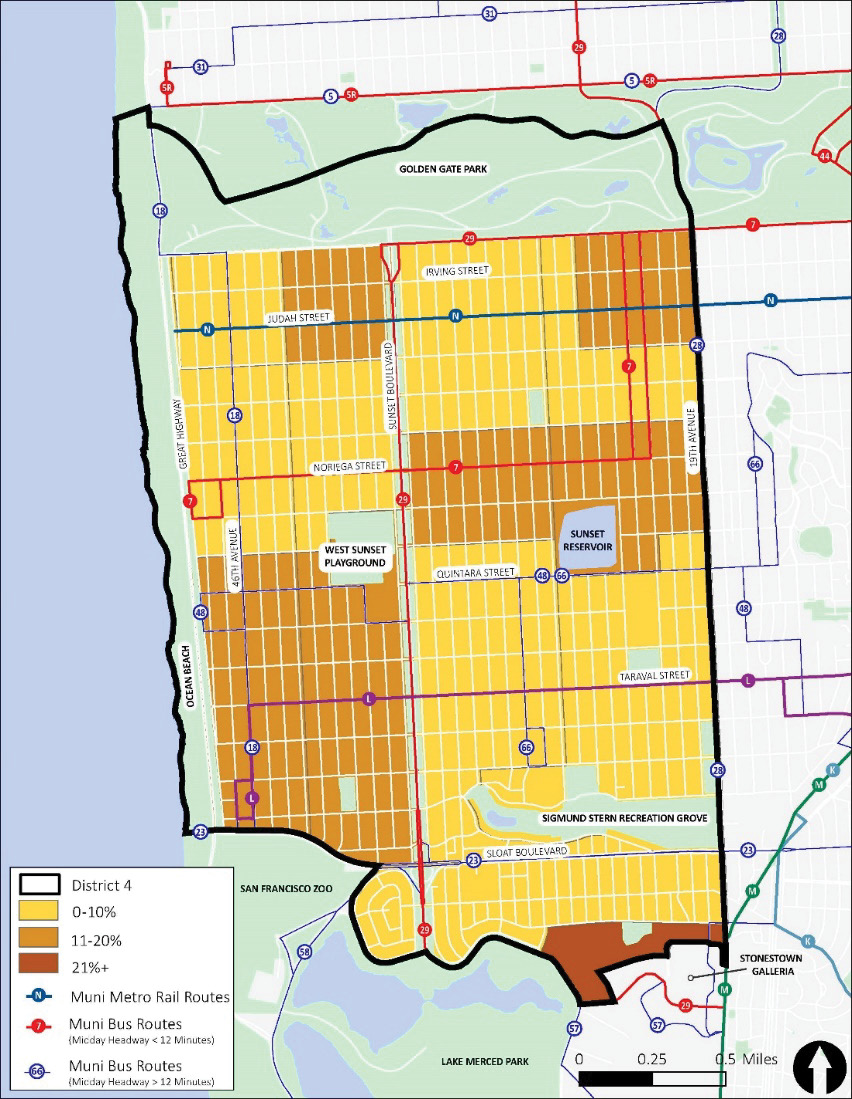
Source: United States Census Bureau, 2023.
As shown in Table C-2, the dominant mode of transportation to get to destinations within the district is a private vehicle. Nearly 63% of trips are performed via a private vehicle, which is a result of short intra-district trip distances, the need to carry large items, the unavailability of frequent transit connections, and spread-out locations of key destinations within the district.
Transit service in the district primarily runs east-west with limited north-south connectivity. Two frequent light-rail lines, N Judah and L Taraval, run east-west at street-level and encounter traffic delays that impact reliability. Table C-3 shows the various transit lines that serve the district.
Figure C-9 shows the existing transit network in the district with bus lines color coded by weekday midday frequency (red for routes that have headways of 12 minutes or shorter in the midday and blue for less frequent service). By this definition, only two bus lines in the district provide frequent service (7 and 29) while the others (18, 23, 28, 48, 57, 58, and 66) are not as frequent. The network provides greater connectivity to destinations outside of the district than it does for shorter, intra-district trips. For example, a trip from the southwest part of the district (an area with higher percentage of low-income and zero-car households) to the northeast part of the district (Irving Street commercial corridor) requires a transfer or long walk to a transit stop, adding time and inconvenience to a short trip compared to driving.

Source: San Francisco Municipal Transportation Agency, 2023.
Figure C-10 shows that most of the district’s residents live within a quarter-mile (green), or a seven-minute walk for a healthy, able-bodied person, from a transit stop, However, substantially fewer people live within one-eighth of a mile (yellow), or a three-minute walk, from a transit stop. For people with physical disabilities and mobility impairments, a three-to-seven-minute walk might not be feasible.Source: “Ability to Walk ¼ Mile Predicts Subsequent Disability, Mortality, and Health Care Costs”, National Library of Medicine, 2023. Furthermore, transit might not be the most efficient way for people to get to their destination, despite living within a quarter-mile or one-eighth of a mile from a transit stop.
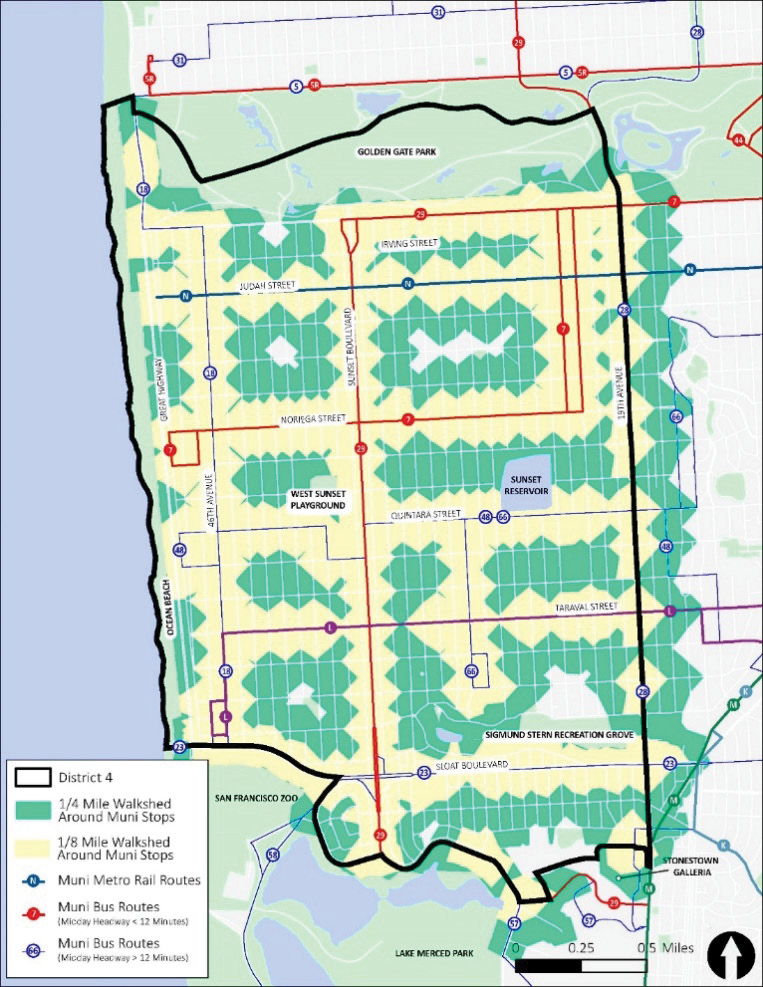
Source: San Francisco Municipal Transportation Agency, 2023.
Key destinations in the district include schools, parks and playgrounds, community spaces, and commercial corridors. As shown in Figure C-11 and Table C-4, some destinations can be found along corridors with transit service like Judah Street, Noriega Street, Quintara Street, and Taraval Street; however, many destinations are spread out in areas of the district with gaps in the transit network. The map also shows Invest in Neighborhoods Areas which is an initiative to create more vibrant neighborhoods and create economic opportunities for residents of the city’s low- and moderate-income neighborhoods.
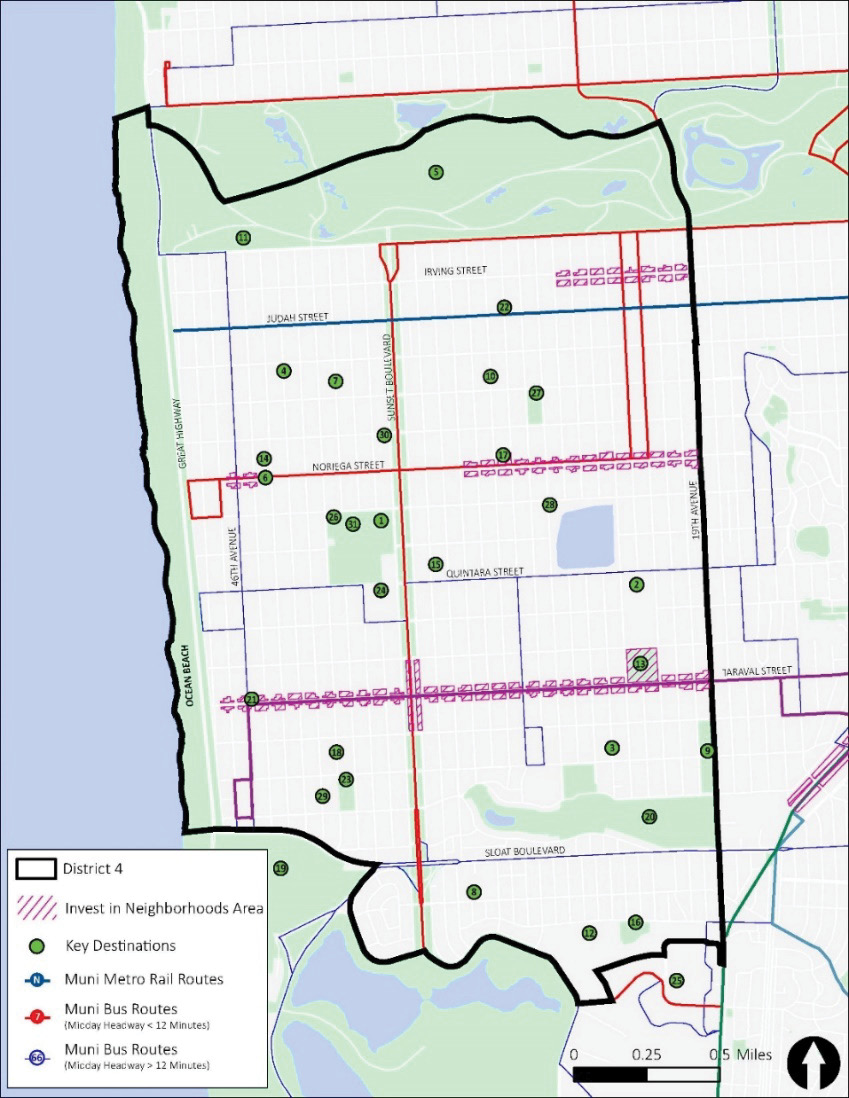
The district’s reliance on vehicles for travel is further explained in Figure C-12, Figure C-13, and Figure C-14. Based off SF-CHAMP data, the maps depict the ratio of average weekday transit to SOV (driving) travel times from each traffic analysis zone to all other zones within the district. Higher ratios indicate longer transit travel times compared to driving. SOV driving trips are faster than using transit throughout the district. Overall, it takes about five times as long to complete a trip within the district via transit than SOV. This is due to the very short trip distances for many intra-district trips. Transit trips include the time it takes to walk to and from transit stops and average wait times for the bus or train to arrive. For short trips, these walk and wait times exceed the time spent on the bus, making it much faster to drive or even walk than to take transit. SOV travel times can also be affected by the time needed to find a parking space and to walk to and from the SOV, which could increase the attractiveness of on-demand service for trips to busy commercial districts that have paid on-street parking.
Longer transit travel times are most notable in transit gaps, such as between 19th Avenue and Sunset Boulevard, that are outside of the one-eighth mile transit stop walkshed.
Midday and afternoon ratios are higher, possibly due to less frequent transit service during the midday and higher ridership that slows transit vehicles in the afternoon.
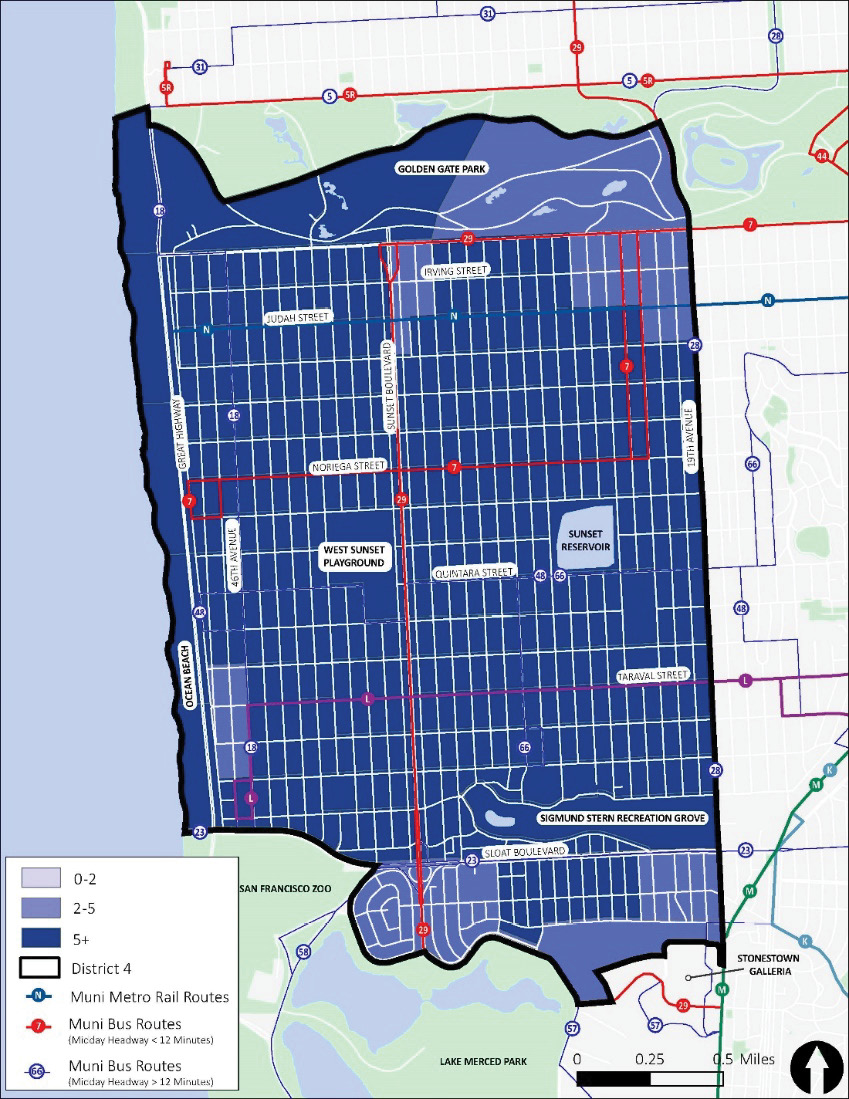
Source: San Francisco County Transportation Authority, 2023.
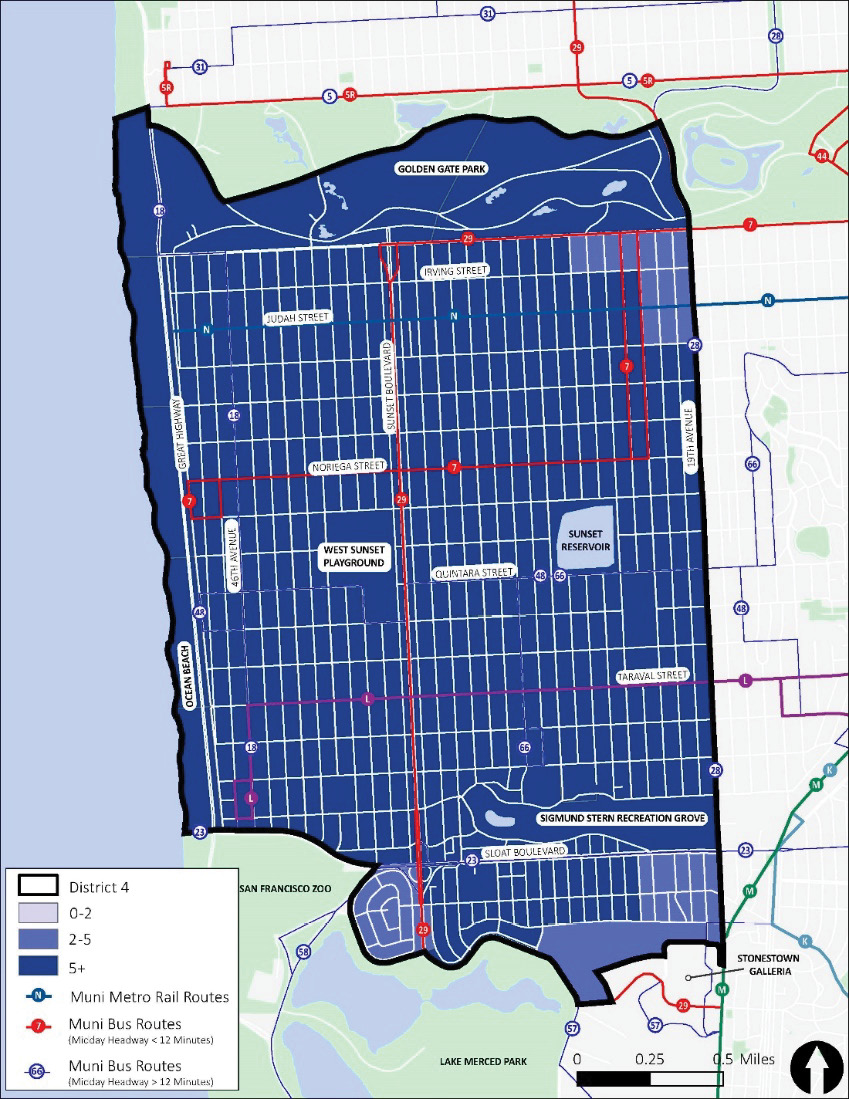
Source: San Francisco County Transportation Authority, 2023.
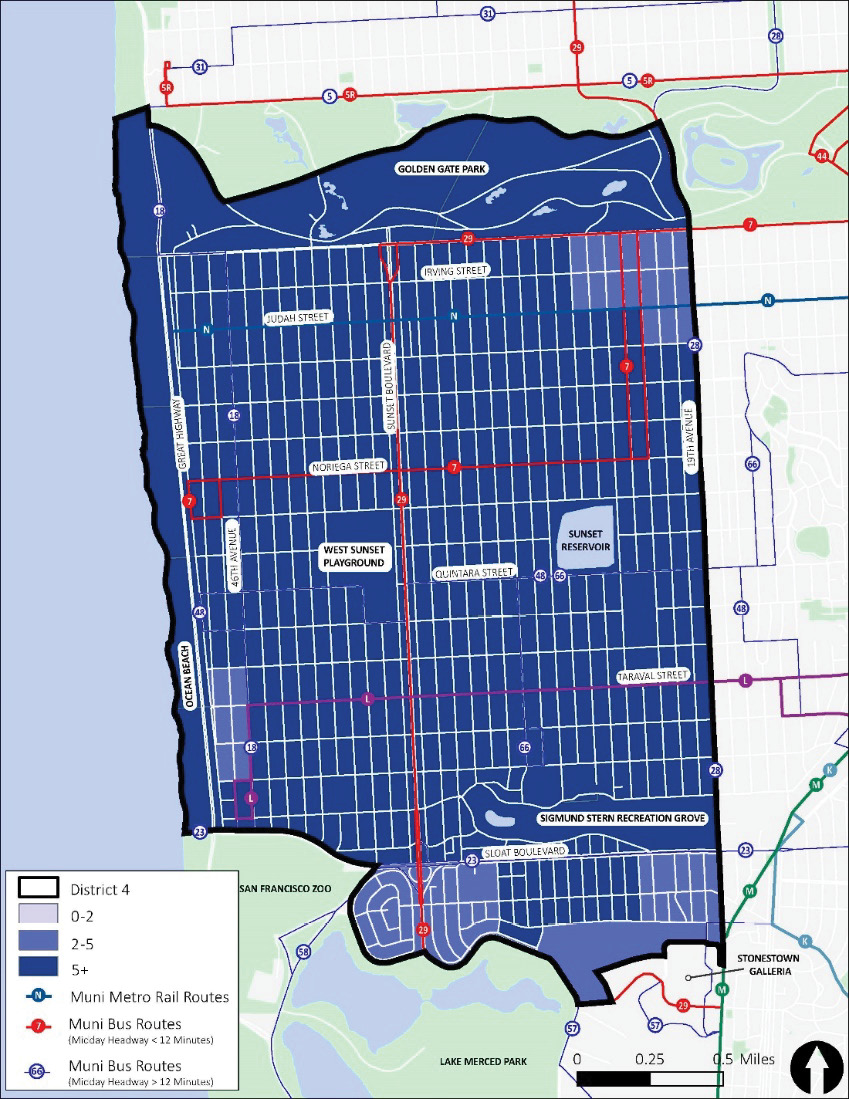
Source: San Francisco County Transportation Authority, 2023.
Several characteristics of the district make it a potentially viable on-demand service market. While the density of the district is high compared to on-demand service zones in peer cities, the district is still less dense than the entire City of San Francisco. Density appears to thin out in between the east-west transit routes in the district creating less dense areas that are farther away from transit stops. On-demand service would address these gaps in connectivity (due to the limited availability of frequent transit service in some areas and during some times of day) by providing access for customers to destinations that are more difficult to reach by transit.
An on-demand service would also provide basic access for disadvantaged communities within the district. Areas with higher numbers of households living below the poverty line have higher percentages of zero vehicle households. These are populations that can benefit from the flexibility of an on-demand service that is more affordable than a traditional TNC service while not having to rely on their own vehicle to get around the district. Additionally, many of the areas with high percentages of senior residents coincide with those that have the highest percentages of people with disabilities. There is also a notable overlap between areas with more seniors and more zero vehicle households. On-demand service is needed in these areas to improve mobility and facilitate access to resources within the district.
While most of the district is within a quarter mile (seven-minute) walk of a transit stop, that walk might not be feasible for some people, thus necessitating more of a point-to-point service. Although paratransit service is provided by SFMTA, on-demand service can provide an alternative and more flexible means of mobility for those making trips within the district. Some current SFMTA Paratransit trips could divert to an on-demand services because customers find these services more convenient for those trips. In addition, an on-demand service would likely have a lower average cost per ride than paratransit.
Private vehicles are the dominant mode of travel in the district. This is contributed by the lack of frequent transit service in the district which contributes to a higher travel time for transit trips compared to those made via private vehicles. The small size of the district means that a transit trip requiring a transfer can be unnecessarily long. Outside of the key commercial corridors like Irving Street and Taraval Street, most key destinations are dispersed throughout the district which makes it difficult to access without a vehicle if the destinations are not walkable or bikeable. An on-demand service would help fill in the gaps in the existing transit network and provide a faster option for residents to travel to key destinations throughout the district while not needing to rely on a private vehicle.
While the district boundaries serve as a natural on-demand service area, there are potential areas outside the district that may warrant on-demand service. These service areas could act as hubs that connect to the on-demand service area. As shown in Figure C-15, there are high concentrations of SOV and transit trips from the district to the areas around Stonestown Galleria and San Francisco State University, Balboa Park and City College of San Francisco, and the University of California San Francisco. While expanding on-demand service areas increases operating costs, this can result in higher ridership and provide a better alternative to using an SOV to access these key destinations outside the district. Figure C-16 shows the three potential service areas.

Source: San Francisco County Transportation Authority, 2023.
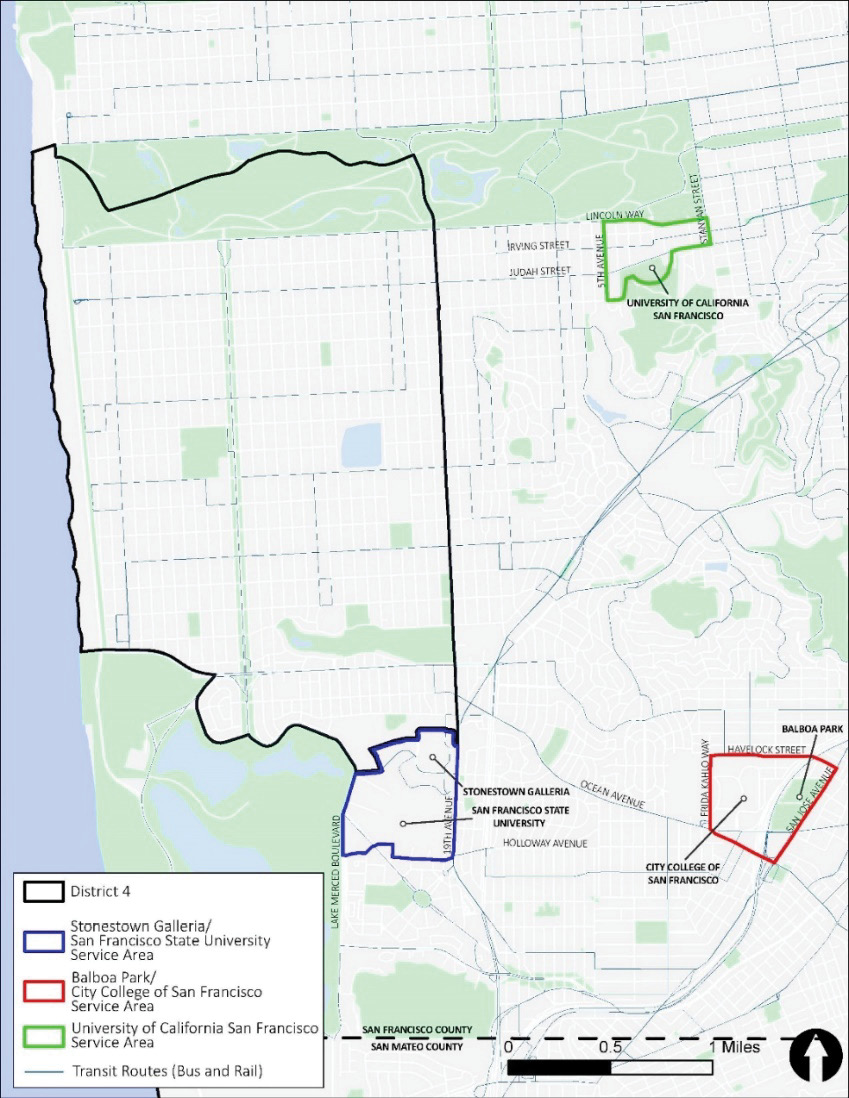
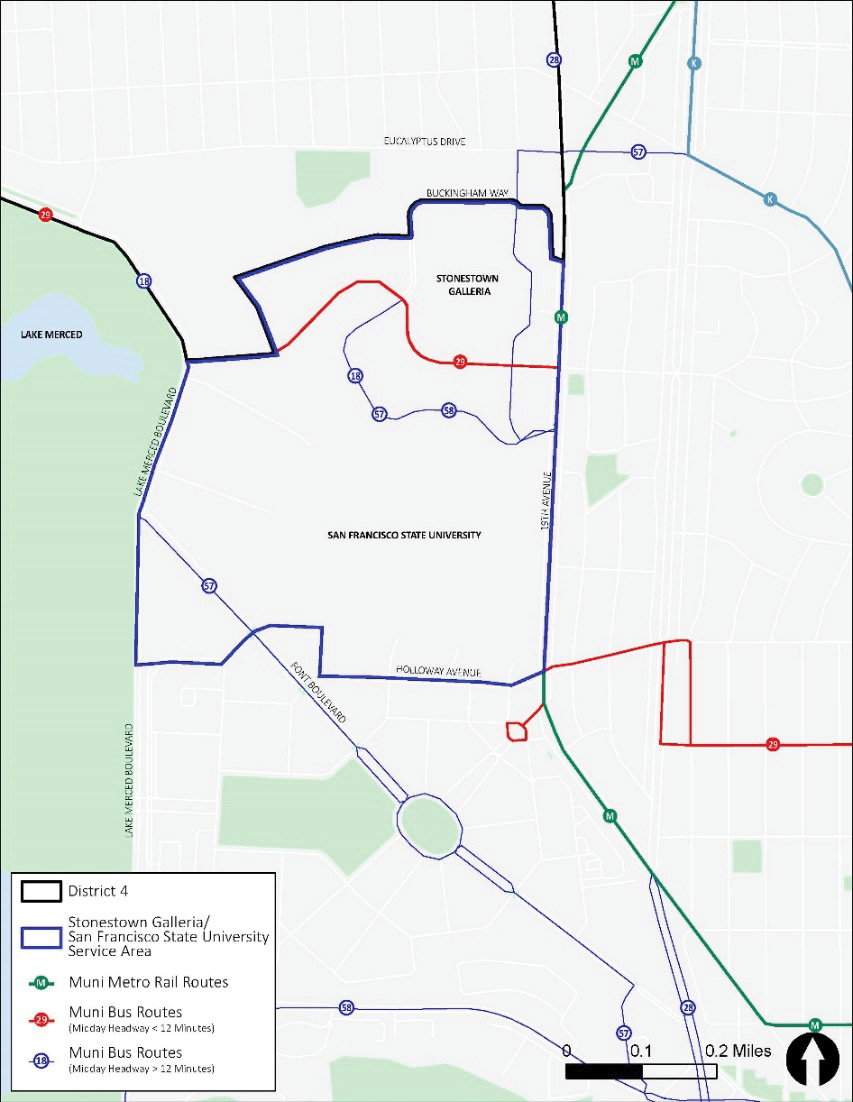
0.28
Serves key destinations such as Stonestown Galleria and San Francisco State University, directly south of the district boundary, provides connection to the M Ocean View.
Proximity to the district would require pick-up times to be short to provide competition to automobile trips.
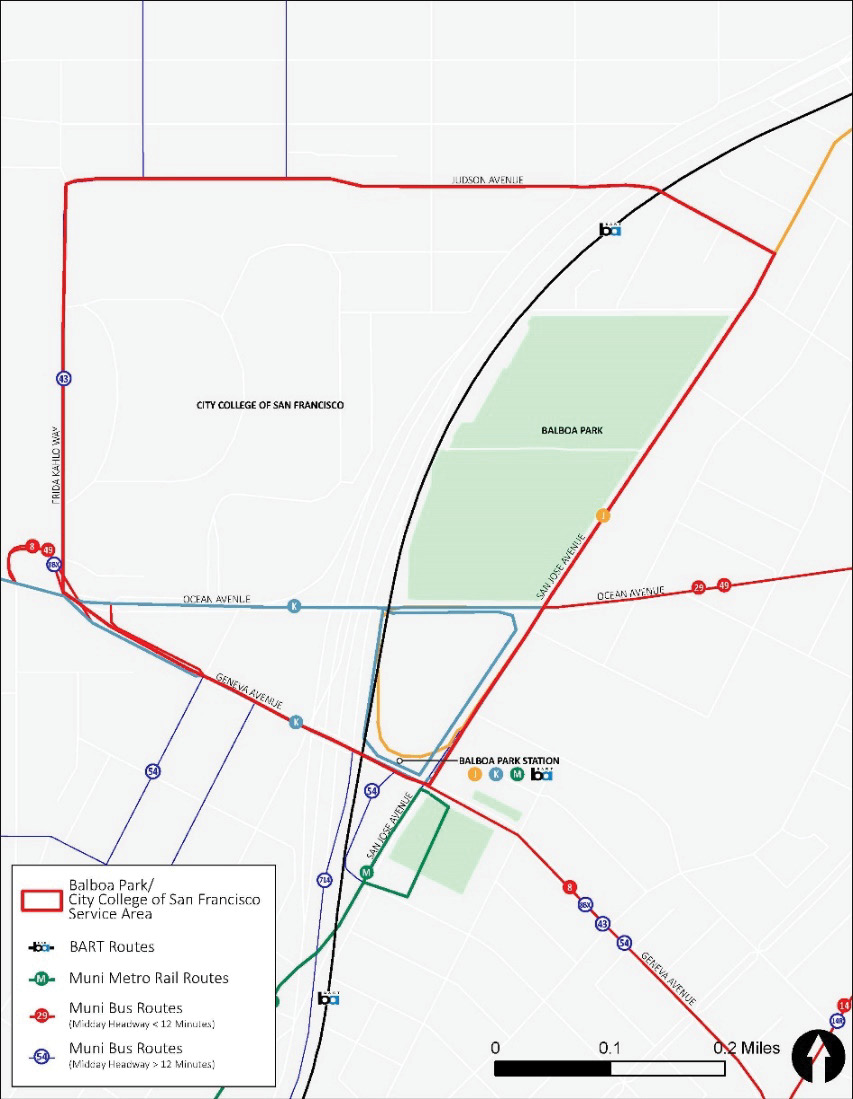
0.23
Serves key destinations such as City College of San Francisco and Balboa Park, provides connections to BART at the Balboa Park Station.
Farthest from the district of the three potential areas (approximately two miles from the boundary), pick-up times would need to be low to not create an overly long trip, vehicles may experience congestion along Ocean Avenue.
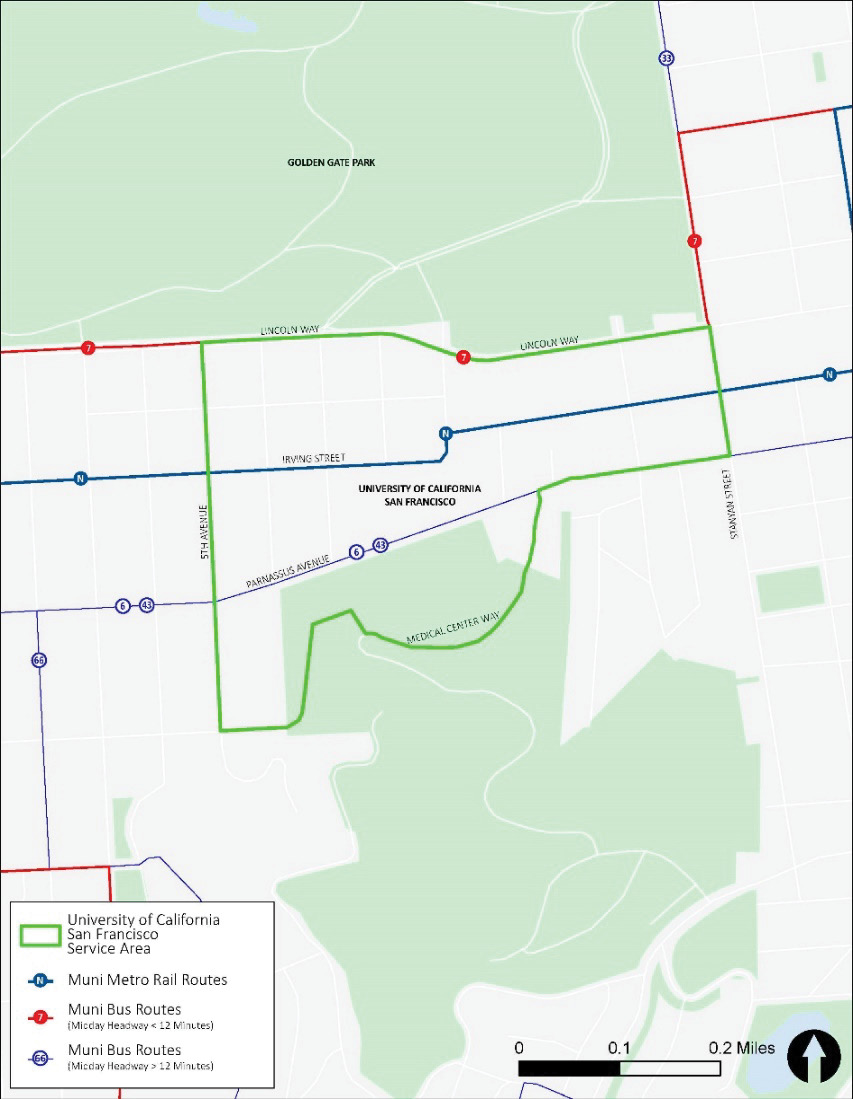
0.11
Serve key destinations such as the University of California San Francisco and Irving Street corridor, less than a mile from the district boundary, dense area that could serve large amount of trips.
May compete with transit trips using N Judah, vehicle may experience congestion along Irving Street and Judah Street. some potential customers might walk or bike to this area rather than use on-demand service.
An initial range of ridership estimates for an on-demand service was developed using two different methods. The first was based on the performance of on-demand services in Appendix A for which ridership and service area data were available. The methodology correlates ridership on on-demand services with their service area and performance characteristics. These correlations were then applied to the district’s characteristics to develop a preliminary ridership estimate for the service area. The second method used mode share assumptions to estimate how many trips would use the service.
As described in Appendix B, detailed information was collected from ten peer on-demand services including planning documents, reports, publicly-available vendor contracts, and interviews with project/agency leadership. Regarding ridership, many agencies indicated these services are not designed to yield high usage, but to provide basic coverage or to serve a specific need such as access for low-income residents. Ridership effectiveness for the services researched mostly ranged from three to four rides per hour with only a few services experiencing more than four rides per hour. This range of ridership effectiveness is expected due to low population and employment densities in most of the service areas and, in denser areas, to the presence of fixed route service within the on-demand service zones. In addition, on-demand services have inherent limitations on maximum feasible customers per hour because on-demand vehicles travel circuitous paths to pick-up or drop-off customers at various locations based on customers’ requests.
Data collected from the peer on-demand services were used to develop a market share factor and determine the number of estimated rides per day. As shown in Table C-5, the market share factor was calculated by dividing the combined total ridership for the services by the combined total number of people and jobs which yielded a market share factor of 0.003.
|
Calculation |
Market Share Factor |
|---|---|
|
Total ridership (5,105) / total number of people and jobs (1,383,222 + 523,843) |
0.003 |
Applying the methodology to the district yields a ridership estimate of 294 daily rides. Calculations for the estimate is shown in Table C-6.
|
Calculation |
Estimated Rides Per Day |
|---|---|
|
Market share factor (0.003) * District 4 total number of people and jobs (85,496 + 12,585) |
294 |
Assessing how many of the existing intra-district weekday person trips could use an on-demand service was also used to estimate ridership. There are 69,705 intra-district weekday person trips. Research conducted by the C2SMARTER Center looked at on-demand mode share for intra-district trips in five cities.Source: “Urban Microtransit Cross-sectional Study for Service Portfolio Design”, C2SMARTER Center, 2021. The mode shares averaged 0.30%, which aligns with the market capture rate of 0.30% (0.003). The highest mode share was 0.40% (Austin, Texas) and the lowest was 0.16% (Cupertino, CA). As shown in Table C-7, applying the 0.30% mode share to the 69,705 intra-district trips results in 209 daily rides. In addition to these 209 intra-district trips, there would be some trips that would use an on-demand service to connect to destinations or from origins outside the district, which would increase the total ridership above 209 intra-district trips per day.
Table C-8 shows ridership based on a range of assumed mode share percentages for intra-district trips.
Primary service parameters for the proposed on-demand service were developed by analyzing the results from the peer agencies, results for the community outreach conducted in September 2023, and a review of transit service levels in the district.
Based on the interviews conducted with peer on-demand services, the primary service parameters that drive operating cost and ridership are: average pick-up time, average trip time, pick-up locations, service area, and span of service.
The outreach results support the proposal to include Stonestown Galleria and San Francisco State University in the service zone area. The results also showed a preference to adjust the initially-proposed weekend span from 8:00 a.m. to 8:00 p.m. to 9:00 a.m. to 9:00 p.m. The online survey was on the Transportation Authority’s project website in September 2023. It asked questions about residents’ interest in a shuttle including where and when the service should operate, payment options and fare amount for the shuttle, and desired pick-up times and locations. The survey responses including the following:
As shown in Figure D-1, two routes provide consistent headways better than ten minutes throughout the weekday. It’s also evident that transit service is more frequent earlier in the morning than later in the evening. The span of service should reflect this lack of service later in the evening, particularly after 8:00 p.m., by having a later ending time.
|
Route |
Hour |
|||||||||||||||||||||||
|---|---|---|---|---|---|---|---|---|---|---|---|---|---|---|---|---|---|---|---|---|---|---|---|---|
|
0 |
1 |
2 |
3 |
4 |
5 |
6 |
7 |
8 |
9 |
10 |
11 |
12 |
13 |
14 |
15 |
16 |
17 |
18 |
19 |
20 |
21 |
22 |
23 |
|
|
N Judah |
20 – 29 Minutes |
15 – 19 Minutes |
10 – 14 Minutes |
10 – 14 Minutes |
10 – 14 Minutes |
10 – 14 Minutes |
10 – 14 Minutes |
10 – 14 Minutes |
10 – 14 Minutes |
10 – 14 Minutes |
10 – 14 Minutes |
10 – 14 Minutes |
10 – 14 Minutes |
10 – 14 Minutes |
10 – 14 Minutes |
10 – 14 Minutes |
15 – 19 Minutes |
15 – 19 Minutes |
20 – 29 Minutes |
20 – 29 Minutes |
||||
|
L Taraval Bus |
15 – 19 Minutes |
10 – 14 Minutes |
0 – 9 Minutes |
0 – 9 Minutes |
0 – 9 Minutes |
0 – 9 Minutes |
0 – 9 Minutes |
0 – 9 Minutes |
0 – 9 Minutes |
0 – 9 Minutes |
0 – 9 Minutes |
0 – 9 Minutes |
0 – 9 Minutes |
0 – 9 Minutes |
0 – 9 Minutes |
15 – 19 Minutes |
15 – 19 Minutes |
10 – 14 Minutes |
||||||
|
7 Haight/Noriega |
15 – 19 Minutes |
10 – 14 Minutes |
10 – 14 Minutes |
10 – 14 Minutes |
10 – 14 Minutes |
10 – 14 Minutes |
10 – 14 Minutes |
10 – 14 Minutes |
10 – 14 Minutes |
10 – 14 Minutes |
10 – 14 Minutes |
10 – 14 Minutes |
10 – 14 Minutes |
10 – 14 Minutes |
10 – 14 Minutes |
15 – 19 Minutes |
20 – 29 Minutes |
|||||||
|
18 46th Avenue |
20 – 29 Minutes |
20 – 29 Minutes |
20 – 29 Minutes |
20 – 29 Minutes |
20 – 29 Minutes |
20 – 29 Minutes |
20 – 29 Minutes |
20 – 29 Minutes |
20 – 29 Minutes |
20 – 29 Minutes |
20 – 29 Minutes |
20 – 29 Minutes |
20 – 29 Minutes |
15 – 19 Minutes |
20 – 29 Minutes |
20 – 29 Minutes |
||||||||
|
23 Monterey |
20 – 29 Minutes |
20 – 29 Minutes |
20 – 29 Minutes |
20 – 29 Minutes |
20 – 29 Minutes |
20 – 29 Minutes |
20 – 29 Minutes |
20 – 29 Minutes |
15 – 19 Minutes |
20 – 29 Minutes |
20 – 29 Minutes |
20 – 29 Minutes |
20 – 29 Minutes |
20 – 29 Minutes |
30+ Minutes |
30+ Minutes |
||||||||
|
28 19th Avenue |
20 – 29 Minutes |
10 – 14 Minutes |
10 – 14 Minutes |
10 – 14 Minutes |
10 – 14 Minutes |
10 – 14 Minutes |
10 – 14 Minutes |
10 – 14 Minutes |
10 – 14 Minutes |
10 – 14 Minutes |
10 – 14 Minutes |
10 – 14 Minutes |
10 – 14 Minutes |
10 – 14 Minutes |
10 – 14 Minutes |
10 – 14 Minutes |
15 – 19 Minutes |
20 – 29 Minutes |
20 – 29 Minutes |
|||||
|
29 Sunset |
15 – 19 Minutes |
10 – 14 Minutes |
0 – 9 Minutes |
0 – 9 Minutes |
0 – 9 Minutes |
0 – 9 Minutes |
0 – 9 Minutes |
0 – 9 Minutes |
0 – 9 Minutes |
0 – 9 Minutes |
0 – 9 Minutes |
0 – 9 Minutes |
10 – 14 Minutes |
10 – 14 Minutes |
15 – 19 Minutes |
15 – 19 Minutes |
20 – 29 Minutes |
20 – 29 Minutes |
20 – 29 Minutes |
|||||
|
48 Quintara/24th Street |
30+ Minutes |
30+ Minutes |
30+ Minutes |
30+ Minutes |
30+ Minutes |
20 – 29 Minutes |
20 – 29 Minutes |
15 – 19 Minutes |
15 – 19 Minutes |
15 – 19 Minutes |
15 – 19 Minutes |
15 – 19 Minutes |
15 – 19 Minutes |
15 – 19 Minutes |
15 – 19 Minutes |
15 – 19 Minutes |
15 – 19 Minutes |
15 – 19 Minutes |
20 – 29 Minutes |
20 – 29 Minutes |
20 – 29 Minutes |
20 – 29 Minutes |
20 – 29 Minutes |
20 – 29 Minutes |
|
57 Parkmerced |
20 – 29 Minutes |
20 – 29 Minutes |
20 – 29 Minutes |
20 – 29 Minutes |
20 – 29 Minutes |
20 – 29 Minutes |
20 – 29 Minutes |
20 – 29 Minutes |
20 – 29 Minutes |
20 – 29 Minutes |
20 – 29 Minutes |
20 – 29 Minutes |
20 – 29 Minutes |
20 – 29 Minutes |
20 – 29 Minutes |
20 – 29 Minutes |
20 – 29 Minutes |
|||||||
|
58 Lake Merced |
30+ Minutes |
30+ Minutes |
30+ Minutes |
30+ Minutes |
30+ Minutes |
30+ Minutes |
30+ Minutes |
30+ Minutes |
30+ Minutes |
30+ Minutes |
30+ Minutes |
30+ Minutes |
30+ Minutes |
30+ Minutes |
30+ Minutes |
30+ Minutes |
30+ Minutes |
|||||||
|
66 Quintara |
20 – 29 Minutes |
20 – 29 Minutes |
20 – 29 Minutes |
20 – 29 Minutes |
20 – 29 Minutes |
20 – 29 Minutes |
20 – 29 Minutes |
20 – 29 Minutes |
20 – 29 Minutes |
20 – 29 Minutes |
20 – 29 Minutes |
20 – 29 Minutes |
20 – 29 Minutes |
20 – 29 Minutes |
20 – 29 Minutes |
20 – 29 Minutes |
||||||||

Source: San Francisco Municipal Transportation Agency, 2023.
Figure D-2 shows the recommended service area and Table D-1 shows the recommended primary service parameters. The recommended service area is bounded by Lincoln Way to the north, 19th Avenue to the east, Holloway Avenue/Lake Merced Boulevard/Sloat Boulevard to the south, and Great Highway/Pacific Ocean to the west.
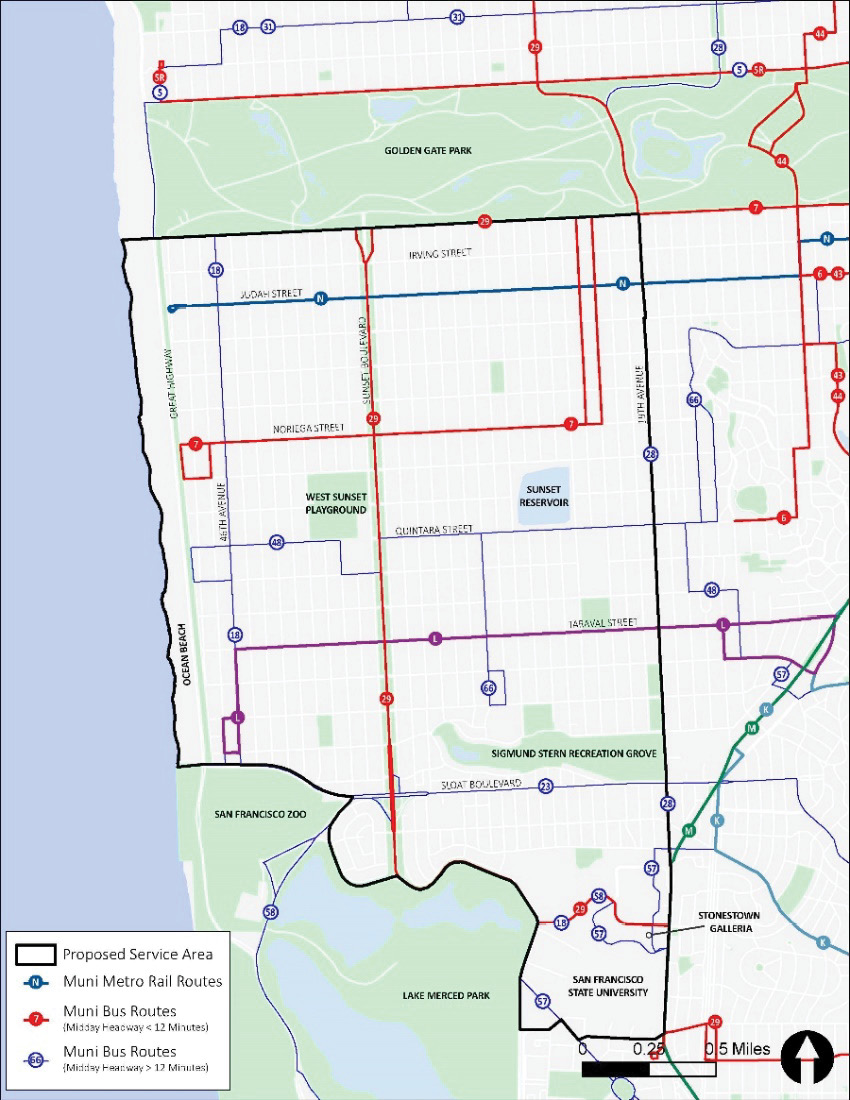
An initial range of operating resource requirements and costs were developed based on the findings from the previous appendices. Input assumptions for ridership, vehicle occupancy and travel times used to estimate costs are selected to be conservative and maximize potential costs of the service, so as to not underestimate resource requirements. The calculations are summarized below in . Private on-demand providers have proprietary software to simulate operating costs that could be requested as part of the procurement process to help validate these numbers.
The following ten-step process was used to determine the required vehicle hours and annual operating cost. Costs were estimated separately for weekdays and weekends and then added together to obtain an annual total. Given the service area and ridership demand, key drivers of cost are the span of service (item two) and the assumed hourly operating cost (item nine).
Input cost per vehicle hour
A range of costs per vehicle hour was developed based on publicly available information from several operating services that use contracted drivers (Palo Alto Link, Metro Flex, Via Rideshare, and Via Jersey City). Cost components vary by service but can include driver pay and benefits, vehicle cost, project management support, performance monitoring and reporting, marketing and promotions, implementation fees, customer support, service planning, and TNC fees. The low estimate is based on the average of these four services adjusted for inflation and San Francisco cost of living and assumes contracted drivers. The high cost assumes drivers are employees and receive union-equivalent wages. A 10% contingency is added to each to account for uncertainty in the procurement or unforeseen circumstances. The low estimate for contract labor drivers is $97 per vehicle hour and the high is $112 per vehicle hour with employee drivers with union wages. Table E-1 shows the information used to develop the low and high estimates assuming use of each vehicle. Note that hourly costs can be impacted somewhat according to vehicle size. Smaller vans could have lower cost, but they also have less capacity which could result in longer wait times for customers.
In addition, operating costs were developed for use of battery electric vehicles assuming one year to amortize costs (based on the one-year pilot duration), no rebates or credits for use of EVs, no salvage/resale revenues for the charging equipment, and minimal cost for electric grid connection. Charger assumptions include procurement and installation of one Level 2 (7.2 kilowatts per hour) slow charger and one Level 3 fast charger (i.e., Heliox 180 kilowatts per hour). A premium of $10,000 vehicle (six total including one spare) is also assumed. Finally, operating cost savings of $0.13 per mile are assumed for EVs.
Table E-2 summarizes the estimated increase in hourly operating costs for electric vehicles.
Calculate annual operating cost
Annual operating costs are calculated by applying the hourly cost for each of the four service types to the number of annual hours as shown in Table E-3, Table E-4, and Table E-5.
|
Statistic |
Estimate |
Input or Calculation |
Source/Calculation |
|---|---|---|---|
|
Average Daily Customers |
294 |
Input |
Appendix C: District 4 Travel Patterns and Ridership Estimates |
|
Service Hours Per Day |
16 |
Input |
|
|
Average Customers Per Hour |
18.4 |
Calculation |
Average Daily Customers/Service Hours Per Day |
|
Average Customers Per Vehicle Trip Request |
1.2 |
Input |
CapMetro NTD Report February 2023 |
|
Required Vehicle Trips Per Hour |
15.3 |
Calculation |
Average Customers Per Hour/Average Customers Per Vehicle Trip |
|
Maximum Vehicle Trips Per Hour |
3.5 |
Input |
|
|
Vehicles Required in Service |
5 |
Calculation |
Required Vehicle Trips Per Hour/Maximum Vehicle Trips Per Hour |
|
Vehicle Hours |
80 |
Calculation |
Service Hours Per Day*Vehicles Required |
|
Cost Per Vehicle Hour |
ICE Vehicles and Contract Labor Drivers: $97 EVs and Contract Labor Drivers: $102 ICE Vehicles and Employee Drivers with Union Wages: $112 EVs and Employee Drivers with Union Wages: $117 |
Input |
|
|
Annual Operating Cost |
ICE Vehicles and Contract Labor Drivers: $1,940,000 EVs and Contract Labor Drivers: $2,043,241 ICE Vehicles and Employee Drivers with Union Wages: $2,240,000 EVs and Employee Drivers with Union Wages: $2,343,241 |
Calculation |
Vehicle Hours*Cost Per Vehicle Hour*Number of Weekend Days and Holidays (250) |
|
Statistic |
Estimate |
Input or Calculation |
Source/Calculation |
|
|---|---|---|---|---|
|
Average Daily Customers |
196 |
Input |
Appendix C: District 4 Travel Patterns and Ridership Estimates |
|
|
Service Hours Per Day |
12 |
Input |
||
|
Average Customers Per Hour |
16.3 |
Calculation |
Average Daily Customers/Service Hours Per Day |
|
|
Average Customers Per Vehicle Trip Request |
1.2 |
Input |
CapMetro NTD Report February 2023 |
|
|
Required Vehicle Trips Per Hour |
13.6 |
Calculation |
Average Customers Per Hour/Average Customers Per Vehicle Trip |
|
|
Maximum Vehicle Trips Per Hour |
3.5 |
Input |
||
|
Vehicles Required in Service |
4 |
Calculation |
Required Vehicle Trips Per Hour/Maximum Vehicle Trips Per Hour |
|
|
Vehicle Hours |
48 |
Calculation |
Service Hours Per Day*Vehicles Required |
|
|
Cost Per Vehicle Hour |
ICE Vehicles and Contract Labor Drivers: $97 EVs and Contract Labor Drivers: $102 ICE Vehicles and Employee Drivers with Union Wages: $112 EVs and Employee Drivers with Union Wages: $117 |
Input |
||
|
Annual Operating Cost |
ICE Vehicles and Contract Labor Drivers: $535,440 EVs and Contract Labor Drivers: $563,935 ICE Vehicles and Employee Drivers with Union Wages: $618,240 EVs and Employee Drivers with Union Wages: $646,735 |
Calculation |
Vehicle Hours*Cost Per Vehicle Hour*Number of Weekend Days and Holidays (115) |
Data gathered from peer agencies around the country were used to develop a methodology for estimating ridership and annual weekday operating costs for the potential service. In addition, ridership and operating resource methodologies from research studies and other feasibility studies provided a basis for the service area estimates.
To review and affirm the ridership and operating cost estimates, the project team reached out to the following agencies:
These agencies were chosen based off their responsiveness from previous tasks and their relative similarities to the proposed service area. Responses were received from the City of West Sacramento and SacRT and their responses are summarized in Table F-1.
The District 4 Community Shuttle Study was conducted as part of the District 4 Microtransit Business Plan, which was funded through the San Francisco County Transportation Authority's Neighborhood Program at the request of Commissioner Gordon Mar. The Neighborhood Program was established to fund community-based efforts in San Francisco neighborhoods, especially in underserved neighborhoods and areas with vulnerable populations (e.g., seniors, children, and/or people with disabilities). The Neighborhood Program is made possible with San Francisco’s half-cent sales tax for transportation funds.