Image

San Francisco has become a leading hub for autonomous vehicle (AV) testing and deployment. AV activity has expanded rapidly over the years: one major operator is currently providing full commercial passenger service, several others are actively testing, and a major operator that previously tested and deployed extensively has since ceased operations. AVs provide a new mobility option in San Francisco while also introducing novel safety and operational concerns, as evidenced by San Francisco’s experiences with crashes, interference with emergency response, and traffic violations involving AVs.
Current state regulations, administered by the California Department of Motor Vehicles (DMV) and the California Public Utilities Commission (CPUC), have enabled significant and rapid AV growth but lack sufficient transparency, performance standards, and mechanisms to effectively manage public risk. These gaps have created a regulatory environment with unclear — and therefore ineffective — safeguards for public safety and local mobility.
To address these challenges, the San Francisco County Transportation Authority (SFCTA) has developed a conceptual framework for incremental, performance-based permitting of AVs. It provides a structured pathway intended to manage public risks, recognizing that setbacks are a natural part of innovation. The framework enables public accountability and learnings to be applied as the sector grows and matures over time.
The framework outlines five progressive deployment stages — from initial testing with a safety driver to full commercial driverless operations — each governed by specific operational constraints such as fleet size, geography, hours of operation, and weather conditions. Advancement through each stage depends on an AV operator’s ability to meet performance standards across critical safety metrics, including collision rates, first responder obstructions, unplanned stops, disengagements, and vehicle retrieval events. The framework emphasizes data transparency to ensure that AV deployment decisions are evidence-based, open to public review, and aligned with established road safety and mobility policy goals.
A simulated case study of a hypothetical AV operator demonstrates how the framework would function in practice, validating its ability to track performance, manage risk, and inform regulatory actions — including advancement through deployment stages, assignment of provisional status, or reversion to a prior stage.
The framework calls for transparent performance evaluation and recommends regulatory discretion to address context-specific issues, providing administrative flexibility in conducting oversight.
Following the passage of Senate Bill 1298 (Padilla) in 2012, the California Department of Motor Vehicles (DMV) established regulations for AV testing with a safety driver on public roads in 2014, and later, for driverless AV testing and deployment in 2018. The California Public Utilities Commission (CPUC), in turn, adopted regulations for piloting AV passenger services in 2018 and 2020, and for commercial AV passenger services in 2020 and 2021. According to the DMV, autonomous miles driven on California’s public roads reached 9.1 million in 2023.This figure reflects drivered and driverless testing VMT reported to the DMV, but not deployment VMT, which providers are not required to report. In 2024, reported testing VMT dropped to 4.5 million, likely due to a further shift in Waymo's operations from testing to deployment https://www.dmv.ca.gov/portal/vehicle-industry-services/autonomous-vehicles/disengagement-reports As of June 2025, there are 30 operators authorized to test AVs with a safety driver in the state, 6 operators authorized to test AVs without a safety driver, and 3 operators authorized to deploy AVs.
A significant portion of AV operations has been concentrated in San Francisco. Waymo and Cruise were the first companies to receive permits for testing AVs with a safety driver on California public roads in 2014 and 2015, respectively. In 2020, Cruise became the first company to receive a permit for driverless testing in parts of San Francisco. By 2022, both Cruise and Waymo were authorized to test and operate without a safety driver throughout the city. In 2023, both companies were granted approval to provide unrestricted, fared passenger services across all of San Francisco. However, later that same year, Cruise’s permits for driverless testing and deployment were revoked following a serious injury collision. Waymo, meanwhile, continues to operate in San Francisco and has expanded its operations to parts of San Mateo, Santa Clara, and Los Angeles counties. More recently, Apollo received a permit for driverless testing in San Francisco in 2023, and Zoox was granted one in 2024.
The arrival of driverless AVs has added mobility options in San Francisco while introducing new safety and operational considerations to the city’s transportation system. According to CPUC data, AV usage in San Francisco increased from 3,576 trips in March 2022 when the first commercial passenger service permits were issued to 400,731 trips in December 2024, indicating rapid growth of AV passenger services in the city.California Public Utilities Commission, Autonomous Vehicle Programs: Quarterly Reporting, accessed August 15, 2025, https://www.cpuc.ca.gov/regulatory-services/licensing/transportation-licensing-and-analysis-branch/autonomous-vehicle-programs/quarterly-reporting. Starting in 2025, Waymo, the only company currently licensed to provide commercial passenger service in San Francisco, stopped publicly disclosing local trip numbers. The National Highway Traffic Safety Administration (NHTSA) data shows that between July 1, 2021 and May 15, 2025, AVs were involved in 681 reported collisions in San Francisco.National Highway Traffic Safety Administration. Standing General Order, ADS Incident Report Data. https://www.nhtsa.gov/laws-regulations/standing-general-order-crash-reporting. Accessed June 16, 2025. The most serious incident occurred on October 2, 2023, when a Cruise AV struck, dragged and pinned a pedestrian until emergency responders arrived. Other reported operational issues have included interference with first responders, failure to yield to pedestrians, driving into oncoming traffic, blocking travel lanes and transit vehicles, and other traffic law violations. The lack of public data makes it unfeasible for city officials and other key stakeholders to conduct objective safety and operational assessments of the cumulative impacts (positive and negative) of AVs and may affect public confidence in the AV sector.
Current regulations in California and at the federal level lack transparent mechanisms to assess AV performance or mitigate the safety and operational risks AVs present to local jurisdictions. Even basic data needed to understand the extent of AV operations within any given jurisdiction, such as total autonomous miles driven by any given AV operator, is not made publicly available.
San Francisco’s experience highlights the need for regulations that guide the testing and deployment of AVs in an incremental, performance-based, and transparent manner. Such an approach would facilitate the successful integration of AVs while fostering greater public trust in their operations. Current regulations place much of the responsibility and decision-making in the hands of AV operators, who may not fully internalize the risks and broader costs that inadequate AV performance imposes on the traveling public. Regulations should permit the scaling and increasing complexity of AV operations only when operators can demonstrate strong performance against critical safety metrics. Additionally, local governments should have access to operational data to verify performance, provide input on mitigating risks, and ensure alignment with broader local transportation objectives.
The purpose of this document is to demonstrate what an incremental, performance-based AV permitting framework and process could look like, and how it could be applied in practice to mitigate some of the risks of AV deployment on public roads. The proposed framework incorporates the concept of incrementalism through a series of constraints on where and how AVs are tested and deployed, such as geographic area, hours of operation, fleet size, maximum speeds, and weather conditions. At each permit stage, these constraints are gradually lifted, allowing for broader and more complex AV operations. A performance-based approach is advanced through a series of safety metrics, including crashes, first responder obstructions, unplanned stops, and disengagements. Operators must meet specific performance standards over a predetermined number of vehicle miles traveled across these various metrics in order to advance to the next permit stage. Finally, the document provides an illustrative application of the proposed incremental permitting framework.
All vehicles, including AVs, are subject to a broad range of federal and state regulations in order to operate on public roadways. Federal authority primarily relates to establishing vehicle safety and emissions standards. State authority primarily addresses permitting of drivers and vehicles to operate on public roadways, carry passengers, establishing and enforcing traffic laws, and establishing liability and insurance regulations.National Highway and Traffic Safety Administration, Federal Automated Vehicles Policy, September 2016 State and local jurisdictions enforce traffic laws, though local jurisdictions, including San Francisco, have little control or oversight of AVs on their streets.
The Federal government is primarily responsible for establishing vehicle (rather than operational) safety standards. NHTSA is responsible for establishing and enforcing Federal Motor Vehicle Safety Standards (FMVSS), as well as monitoring, investigating, and communicating with the public about motor vehicle safety issues and defects. NHTSA has issued guidance to states developing AV regulations, but has not adopted regulations that set minimum safety standards for automated driving systems (ADS). Purpose-built AVs may self-certify their compliance with FMVSS or NHTSA must approve an exemption, for example from the requirement to include a steering wheel. These exemptions, however, do not regulate any element of the software that performs the driving task. NHTSA, through its Standing General Order (SGO) requires reporting of autonomous vehicle collisionsSpecifically, collisions on public roads, when the ADS was engaged at least 30 seconds prior to the collision, and where the collision results or allegedly results in property damage, injury, or fatality and related fatalities, injuries and property damage, but does not require reporting of vehicle miles traveled (VMT), first responder obstructions, traffic rule violations, unplanned stops, and other important road safety information. Moreover, not all data reported to the SGO, is made available to the public, notably detailed location and other incident specifics.
The California Department of Motor Vehicles (DMV) has authority to permit AVs to operate on public roads in California and the mandate to develop regulations to “ensure the safe operation of autonomous vehicles on public roads.”California Vehicle Code 38750(d)(2). https://leginfo.legislature.ca.gov/faces/codes_displayText.xhtml?lawCode=VEH&division=16.6.&title=&part=&chapter=&article= California DMV regulations require permit applicants to identify the Operational Design Domain (ODD) and self-certify that a vehicle can safely operate within it. An ODD may include limitations on the geographic area, roadway type, speed range, environmental conditions (weather; time of day) or other constraints within which the manufacturer expects the vehicle to operate safely. The DMV may revoke a permit for operating outside the approved ODD.
The California DMV has established three levels of AV testing permits:https://www.dmv.ca.gov/portal/vehicle-industry-services/autonomous-vehicles/autonomous-vehicle-testing-permit-holders/
Under the first two DMV testing permits, the DMV requires reports on collisions, disengagements, and VMT, but these reports are limited in scope and are released only once per year. At this time, the DMV has not adopted regulations that set minimum safety performance standards for AVs operating under a testing permit. Under the deployment permit, there are no data reporting requirements, and the DMV has not adopted regulations that set minimum safety performance standards.
The CPUC oversees the testing and deployment of AVs for the purpose of providing commercial transportation services to the public. The CPUC has adopted broad goals for AV testing and deployment including protecting passenger safety, but the CPUC has not specifically articulated how to define or achieve these broad goals and declined to specify performance targets in relation to these goals.
The CPUC has established four levels of permitting:https://www.cpuc.ca.gov/regulatory-services/licensing/transportation-licensing-and-analysis-branch/autonomous-vehicle-programs
From 2018 to 2021, the CPUC established data reporting requirements that remained in place until December 2024.See decisions 18-05-043, 20-11-046, and 21-05-017 Operators with testing permits were required to provide aggregated data on VMT, waiting times, vehicle occupancy, and wheelchair-accessible rides. Operators with deployment permits were required to report trip-level data, including trip origin and destination, collisions, citations, complaints, and pickup/drop-off details. Following Decision 24-11-002, the CPUC revised its data reporting requirements to take effect in January 2025. The updated requirements align reporting for both testing and deployment permits and include more detailed information on VMT, collisions, complaints, citations, and vehicle stoppages (and subsequent obstructions of the right of way). However, initial reports have been highly redacted due to requests for confidential treatment. These claims are not public and have not been adjudicated by the CPUC, whose website lists them as “under review” going back more than 3 years. This issue mirrors the lack of disclosure of ridehail sector data from the CPUC, despite consistent rulings and decisions by the CPUC finding in favor of disclosure dating back 5 years.To date, however, only one year of TNC reports has been released publicly for 2021. See SFCTA’s report TNCs 2020, here: https://www.sfcta.org/tncs-2020 Moreover, despite these changes, the CPUC has not yet adopted regulations setting minimum safety performance standards for AVs operating under its permits.
The methodology consists of three primary steps in developing this conceptual, incremental, performance-based permitting framework for AV passenger services.
First, a panel of experts in automation and roadway safety provided guidance on the operational constraints and parameters to ensure safe outcomes, proposed metrics and performance standards, and helped conceptualize permitting phases and how regulated entities would progress through these permitting phases. They also clarified the distinction between the concepts of “risk management”, which is concerned with limiting the exposure of the public to potential danger arising from AV operations, and “proof-of-safety”, which is concerned with demonstrating with statistical rigor the safety outcomes of AV operations. This conceptual framework is primarily concerned with risk management. However, the data reporting outlined in this document could be used to support proof-of-safety analyses in the long term.
The second step, informed by the guidance and feedback of the experts, developed a conceptual framework for incremental, performance-based autonomous vehicle permitting. The conceptual framework consists of an ordered set of operational phases defined by a set of operational parameters. Earlier phases are more restrictive in their operational parameters. As regulated entities progress to later phases, these operational parameters become increasingly permissive. Progression through these phases is contingent upon satisfying quantitative performance thresholds associated with specific performance metrics. The metrics and thresholds were informed by existing data reporting and automotive safety standards, iteratively refined with automation and roadway safety experts, and assessed for feasibility and reasonableness. The conceptual framework identifies the specific data items required to calculate the performance metrics.
The third step applied the incremental, performance-based autonomous vehicle permitting framework using example “synthetic” data to demonstrate how an entity would progress through the framework. Use of synthetic data was necessary because current AV data reporting requirements are inadequate to support a demonstration of the proposed framework. Application of the framework using synthetic data allowed the framework to be stress-tested and iteratively refined by illustrating potential issues and demonstrating how the process would work.
This section introduces a conceptual framework for incremental performance-based deployment of AVs with a focus on safety. The framework consists of phases that are constrained by operational parameters that become increasingly permissive as a company advances through the phases. This section first describes the operational parameters that define where, when, and at what scale AVs may operate in the conceptual framework. Next it outlines the deployment phases and the operational parameters at each phase. Then it describes the metrics to be used to evaluate performance at each phase, followed by “placeholder” performance standards for each metric used to evaluate a company’s fitness for remaining in the current phase or advancing to the next phase. Finally, it provides guidance for how a regulator should use performance data to inform incremental permitting decisions.
The first structural element of the framework are the operational parameters that have an impact on road safety outcomes. The framework is set up so that, initially, these various parameters are strategically restricted, so as to allow AV operators to gain experience and understanding of the new geography with minimum risk of impacts on road safety and the efficient operation of the transportation system. As the entity accrues experience, improves their technology, and demonstrates good performance, the framework incrementally loosens the restrictions on these parameters, ultimately arriving at the stage in which there are no restrictions for driverless operations within the given geography.
The table below describes the parameters selected, the rationale for inclusion, potential negative impacts of their inclusion, and additional considerations of the parameter specific to the San Francisco context.
The second element of the framework is the sequencing of authorized activities or deployment stages, i.e. how operators would incrementally progress along a series of stages for any given location, culminating in unrestricted commercial driverless service to passengers in that location. The proposed framework is composed of five incremental deployment stages, and puts in place a clearly defined path wherein access to the next stage of AV deployment is contingent on satisfactory performance under the prior stage. The proposed stages are:
The table below describes the increasingly permissive operational parameters throughout the five incremental deployment stages outlined above.
Advancement through the incremental stages of deployment shown in the framework should be contingent on demonstrated performance. This section proposes some potential key metrics for assessing an operator’s road safety performance.
The proposed metrics combine a set of lagging metrics, i.e. actual negative road safety incidents involving the operator in question, and a set of leading metrics, i.e. events that may not necessarily compromise road safety on their own (although at times they do), but may be earlier indicators of higher risk of future poor performance.
Table 3 identifies a set of basic safety metrics, primarily presented as rates, to reflect differences in scale of operations by different entities. This table shows only the metrics used in the incremental, performance-based permitting framework illustrated in this document.
The performance standards for each metric would identify what constitutes acceptable performance to remain in a stage or advance to the next. For injury rates, fatality rates, and PDO collision rates, the standard included is a “placeholder” set to the national rates for human drivers as documented by NHTSA, and remains the same throughout all stages, reflecting that it should never acceptable to have worse-than-human traffic safety outcomes. National rates are used for illustrative purposes in this document, understanding that national standards may not be the appropriate point of comparison for any specific jurisdiction due to differences in operational context and challenges with under reporting of human collisions. Implementation of this framework would require further work to establish the appropriate performance standards, like geographically specific rates, with full data on all relevant incidents from human drivers. It is also worth considering a higher bar than the rate for all human drivers, such as rates derived from alert and attentive human drivers. The thresholds for non-collision metrics are lowered (made more stringent) as the stages advance and the AVs are authorized to operate in more complex environments and at scale.
The framework outlines a process with clear metrics and performance standards which provide guidelines for a company’s progression from more restrictive phases into more permissive phases. Failure to meet thresholds may also lead to the demotion of a permittee to a more restrictive phase, the revocation of a permit, or other enforcement actions. While the performance standards provide guidance on when enforcement actions may be appropriate, the decision to take an enforcement action and the severity of the action should be at the discretion of the regulator and should consider the severity of the triggering incident(s) and the context in which they occurred. The purpose of the guidelines is to convey expectations to industry and promote consistency in regulatory actions, while the purpose of regulatory discretion is to provide some flexibility to consider context. The decision to take, or not to take, an enforcement action should be justified and documented.
For example, an AV company may be involved in an injury collision early on in its deployment in which the other party is deemed at fault by investigators, and that no reasonable human driver in the AV’s place would have been able to prevent it. In this case, if the incident results in minor property damage and no injuries, the regulator may choose to take no action, or if it results in serious injury, they may place the company into a provisional status. Alternatively, if the company was found to have acted negligently, or the technology created or exacerbated a situation that a human driver should have been able to avoid, the regulator may choose to restrict or revoke their operating license. In any case, the company should file the appropriate crash reports, and the regulator should track and publish their performance.
The framework requires standardized, frequent data reporting from AV companies to establish their performance. These reports should be available to the public with limited exceptions for personally identifiable information. Public transparency will help ensure consistent and fair oversight by the regulator, help build public confidence in the technology and its oversight, and provide researchers with objective information on AV performance. Appendix A provides example templates that contain no personally identifiable information that can be made fully public. These reports are:
This section presents an example application of how companies would proceed through an incremental performance-based permitting process. The example application demonstrates how data, metrics, and performance standards support the permitting framework, and how the framework can help mitigate risks to public safety. The example application uses synthetic performance data for a hypothetical AV company because current AV data reporting requirements are inadequate to support the proposed framework.
Current AV data reporting is inadequate to support an incremental performance-based permitting process. AV mileage and crash reporting is incomplete and fragmented, and other than disengagements, no non-crash incident data was collected by any California regulator prior to January 1, 2025. This section identifies the reports that are required to support the proposed conceptual AV regulatory framework and describes methods for synthesizing data for an example application.
The following reports are required, for the purposes described below. See Appendix A for templates and example data.
Synthetic examples of the reports above were generated using simulation. The simulation represents a company with a fleet of vehicles that evolves over time. The fleet has operational constraints based on the active permit phase, targets to maintain that phase or advance to the next. Each vehicle within the fleet is simulated as a series of vehicle days with VMT from a distribution and event probabilities (for collisions, disengagements, and unplanned stops) based on event rates per VMT. The parameters used in the simulation were developed using the data sources below:
The simulation was performed using the AV Data Synthesizer found here: https://github.com/sfcta/av_data_synthesizer.
This example application follows the progress of a hypothetical AV company, Omicron, through the incremental, performance-based permitting process.
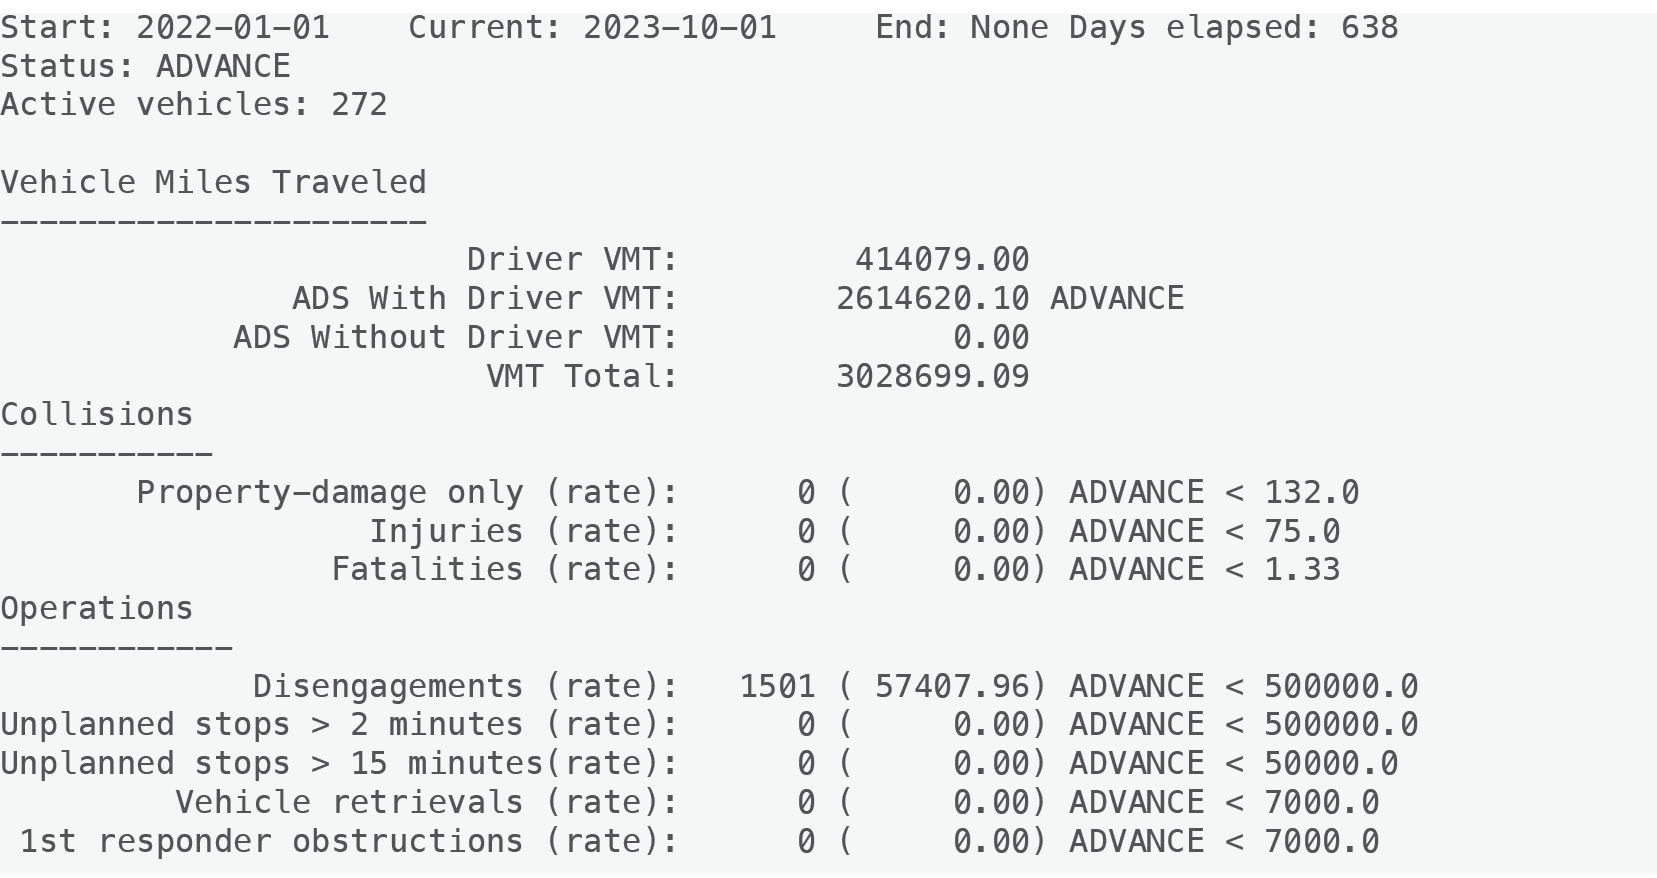
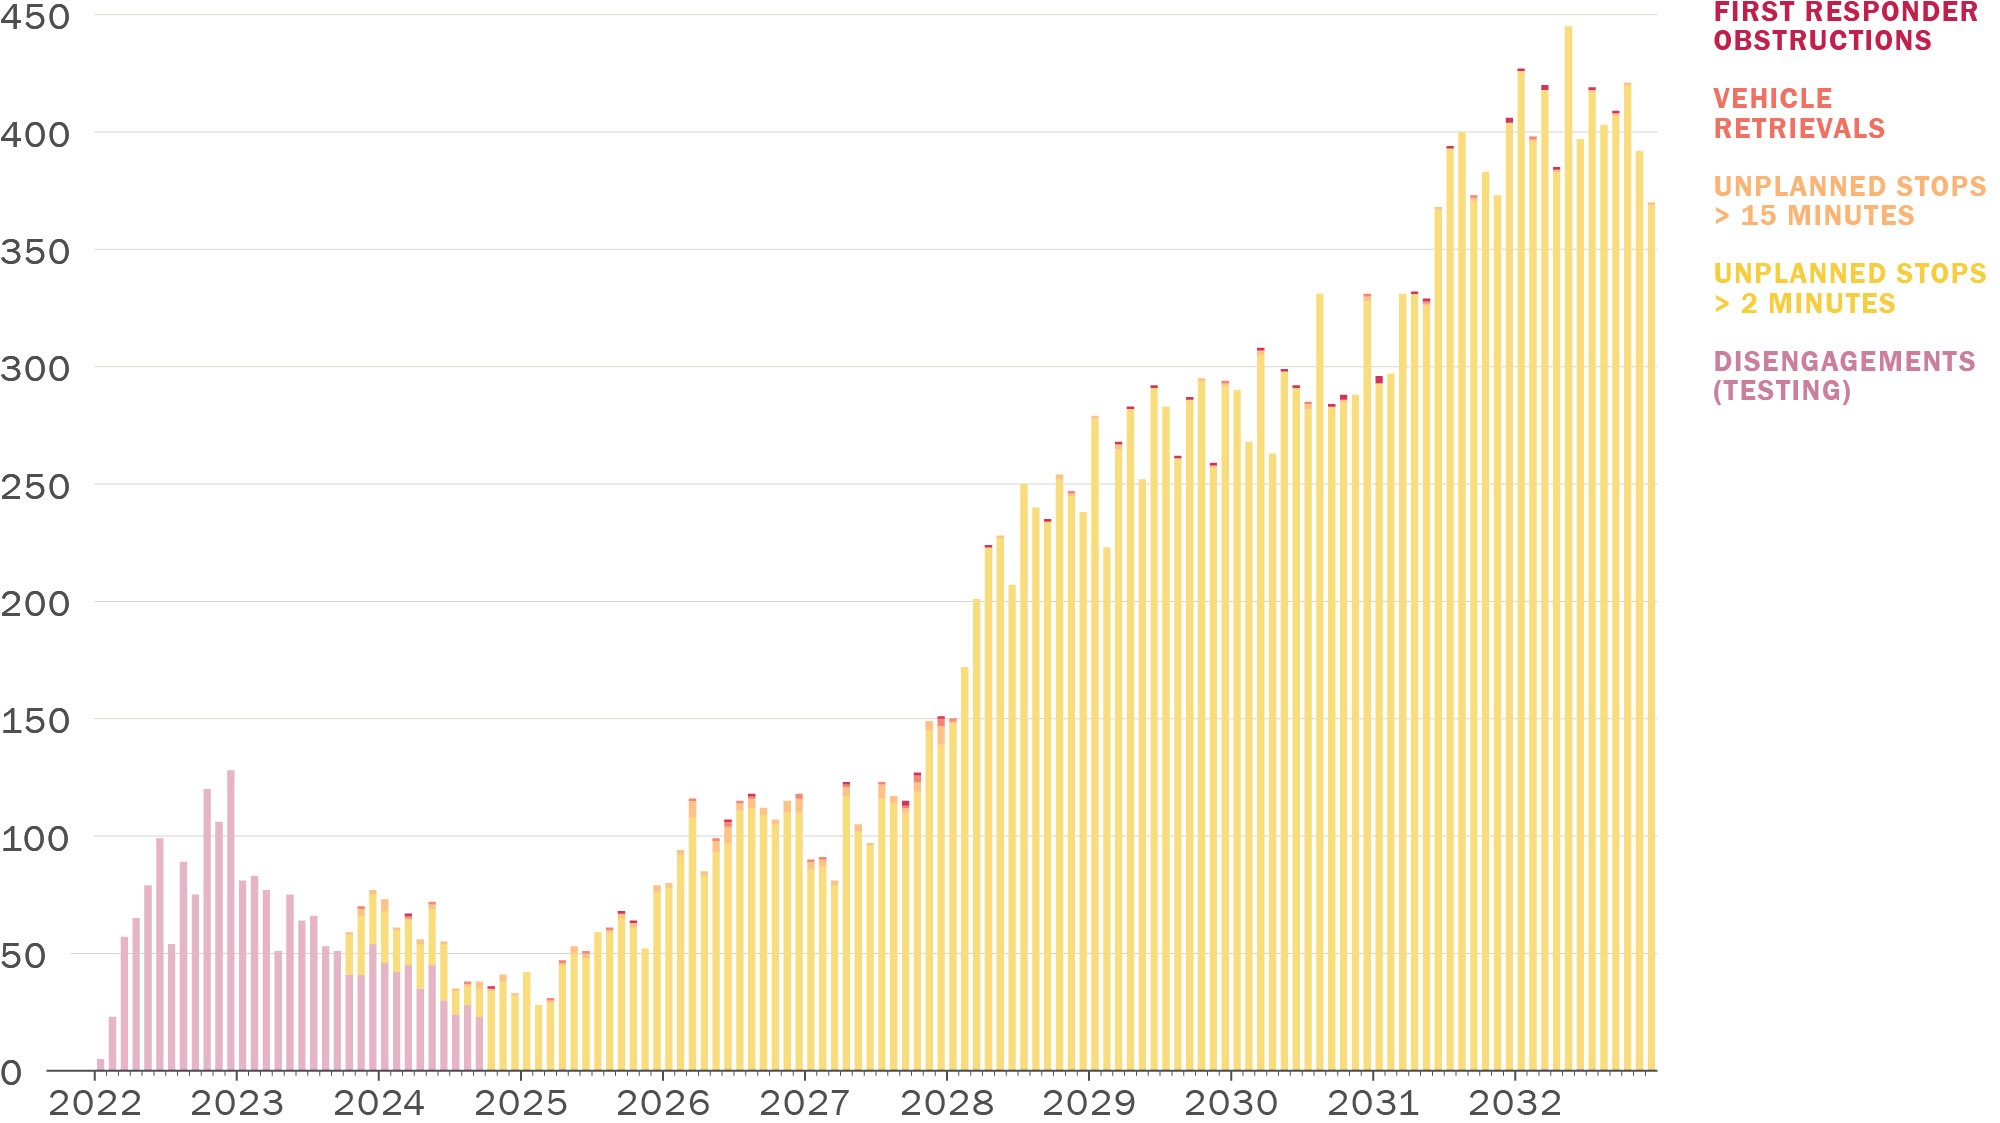
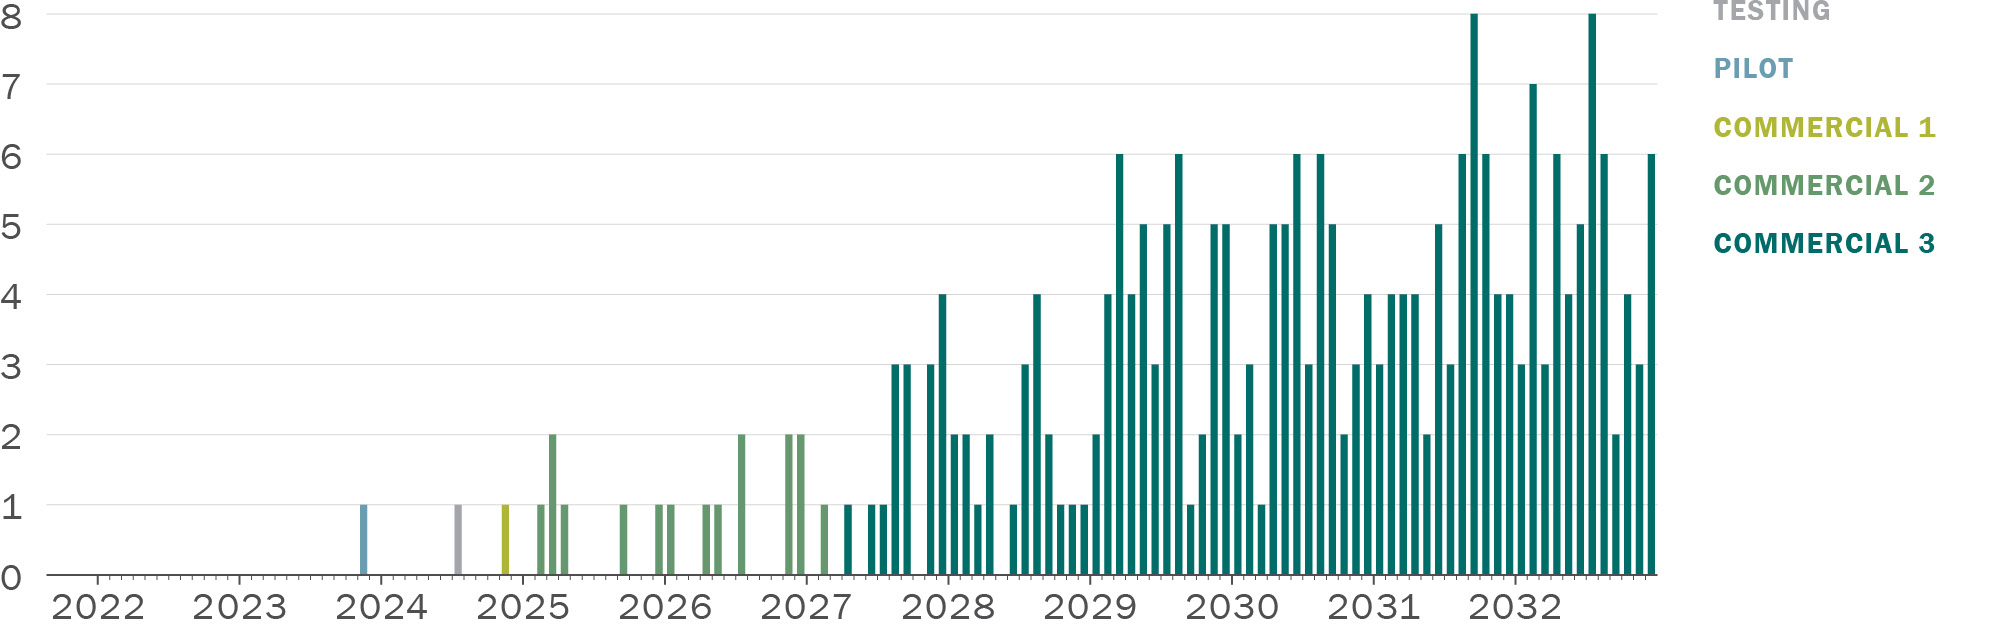
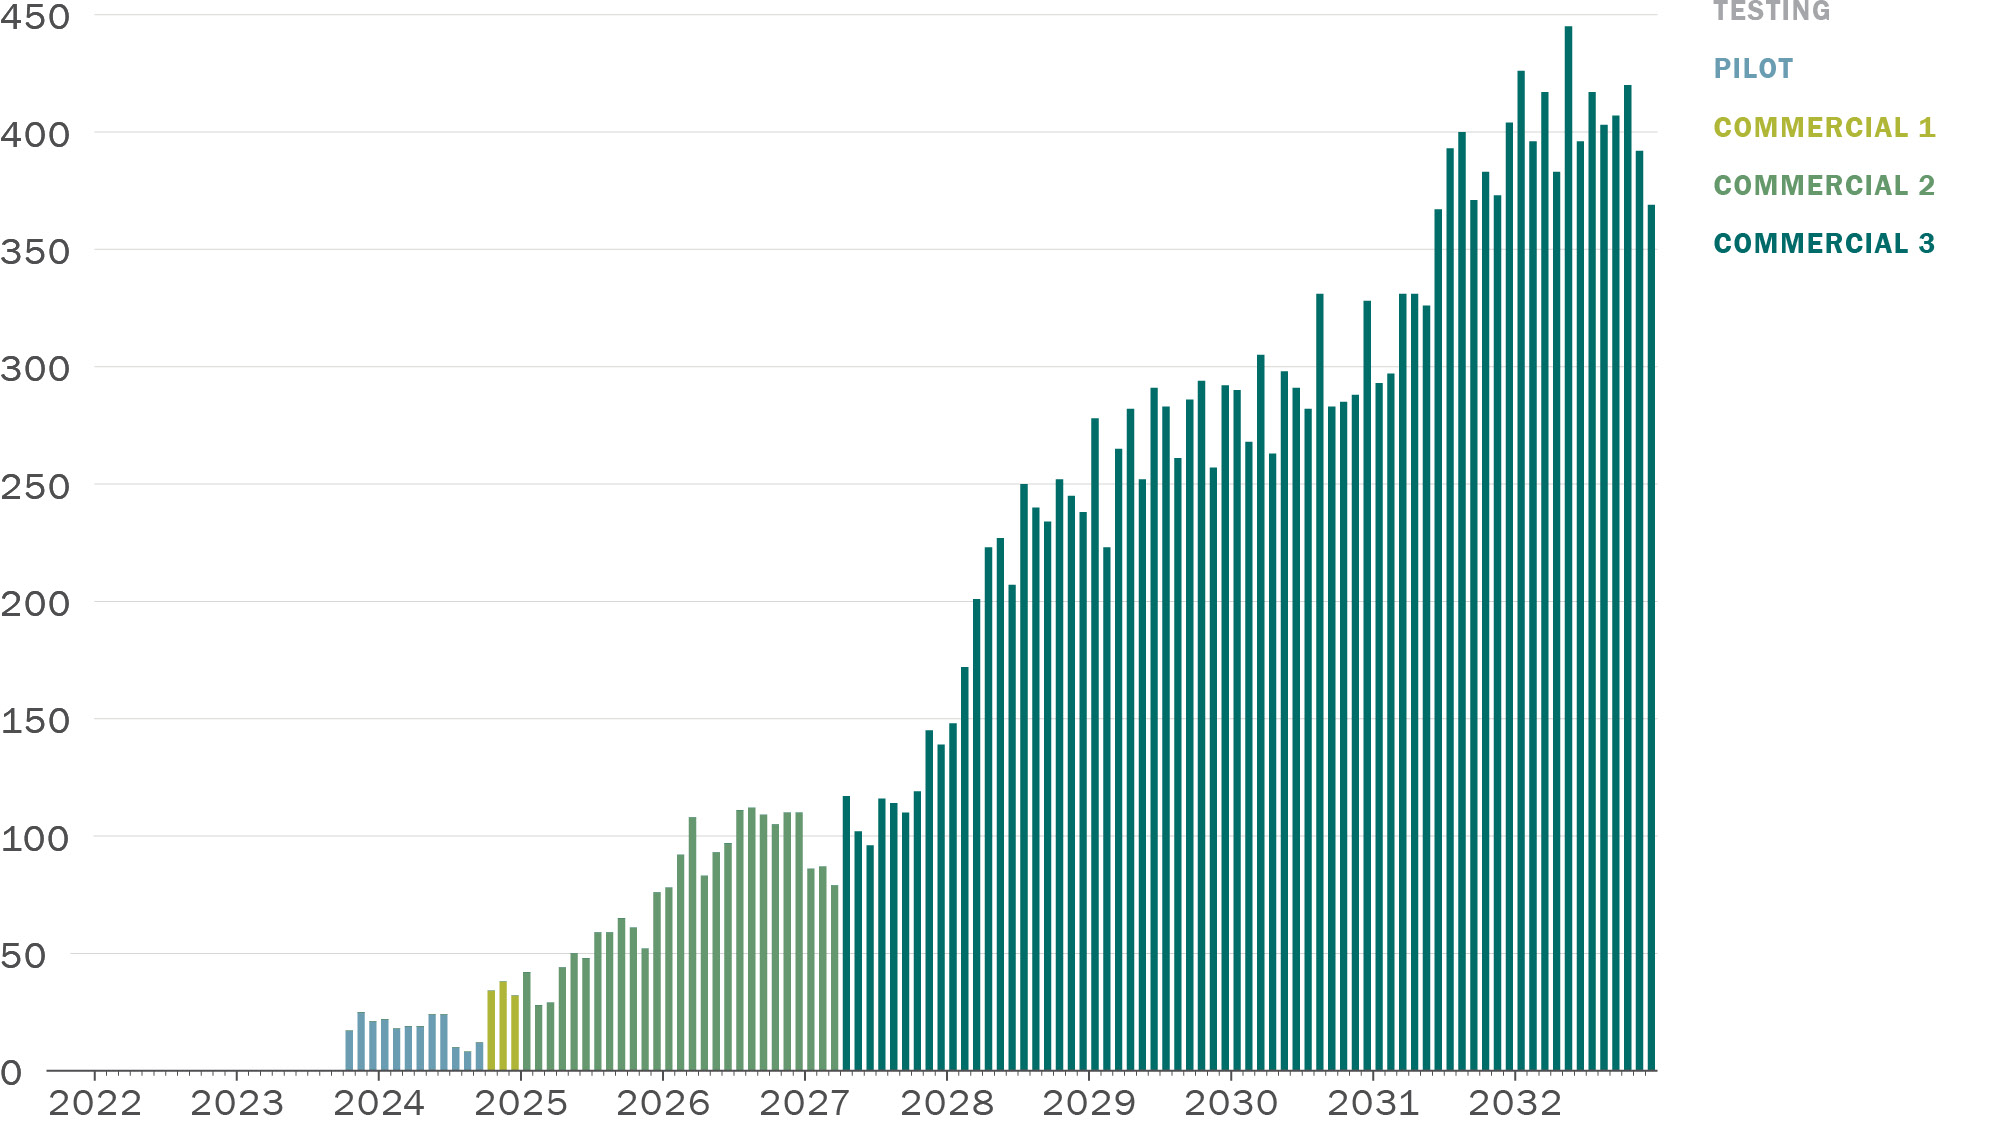
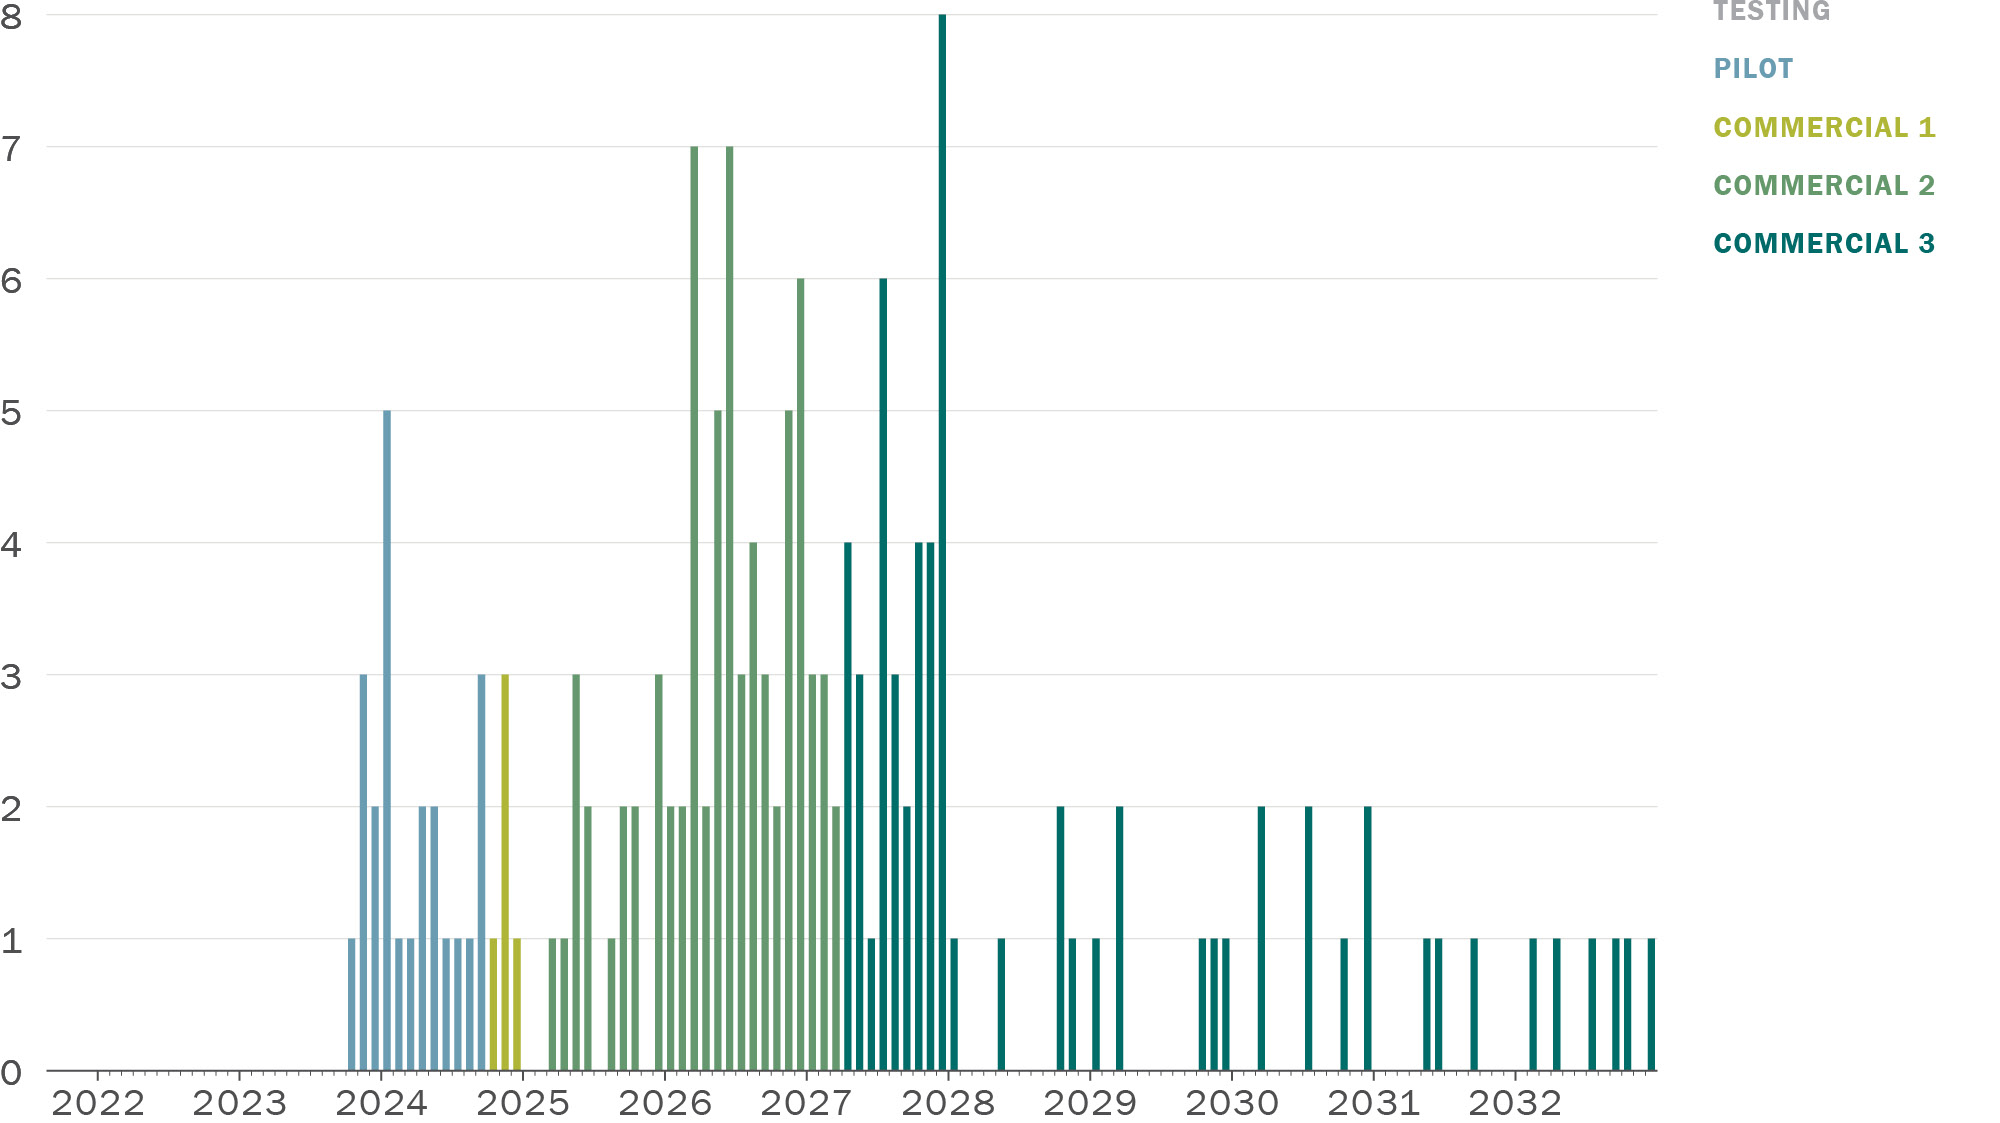
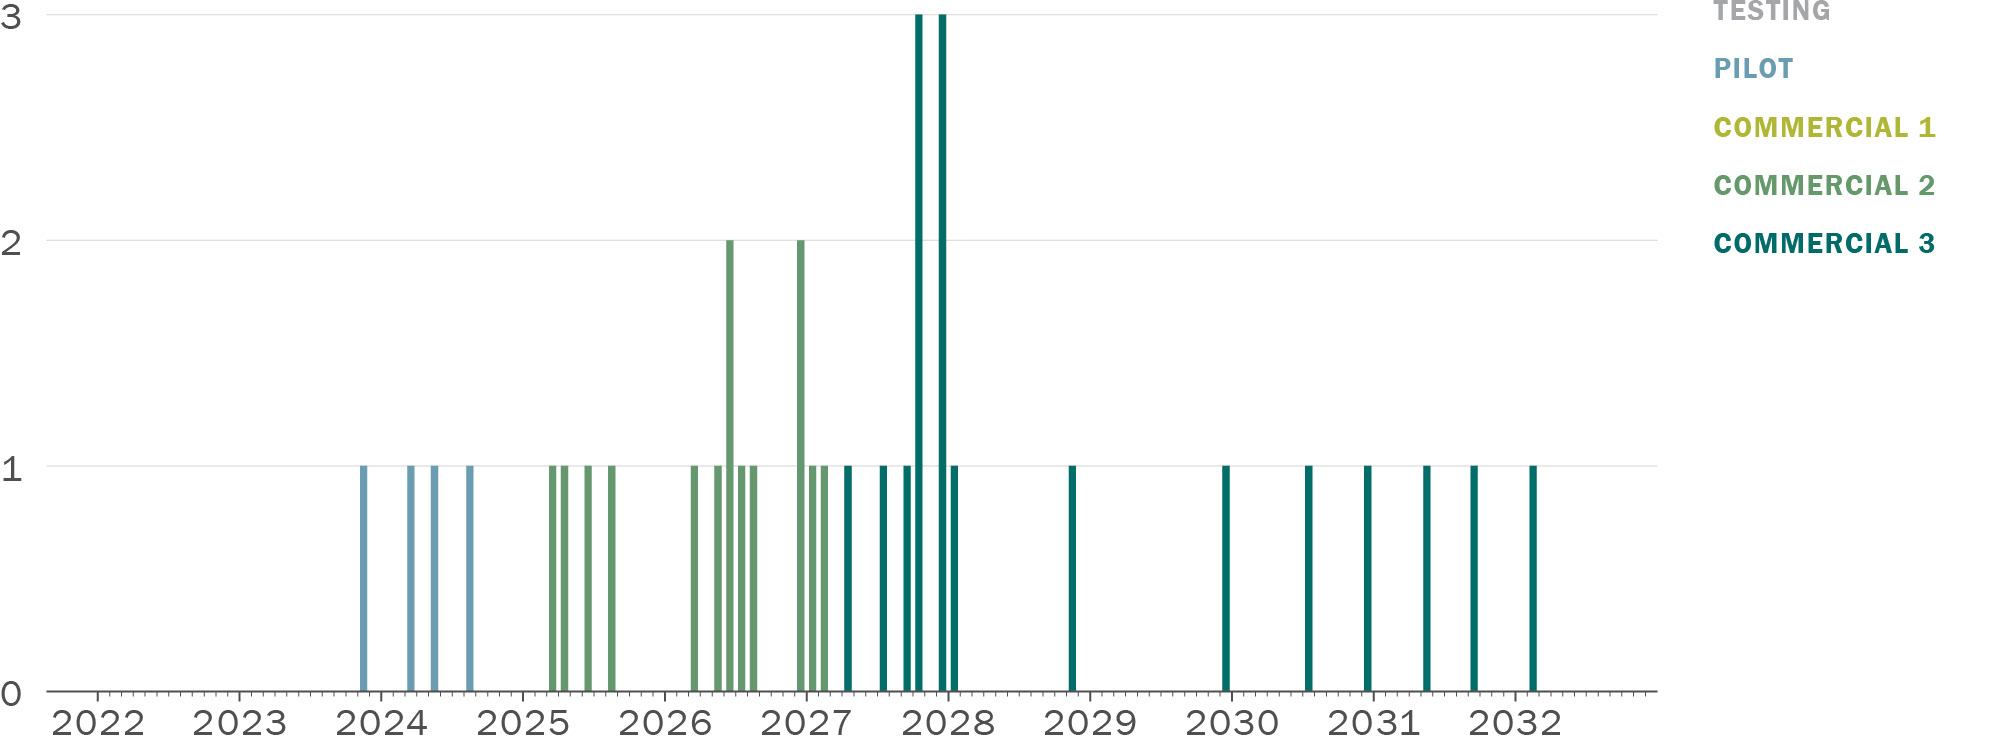
Omicron began testing in January 2022. They conducted testing with a driver for 22 months to accumulate 2 million miles. During their entire testing phase, their safety and operational incident rates remained below acceptable thresholds (see Figure 1). As shown in Figure 2, at first their disengagements (in pink) increased throughout 2022 as number of vehicles in operation scaled up, then began to level off and decline as performance improved, then trailed off and ultimately disappeared as testing ended.
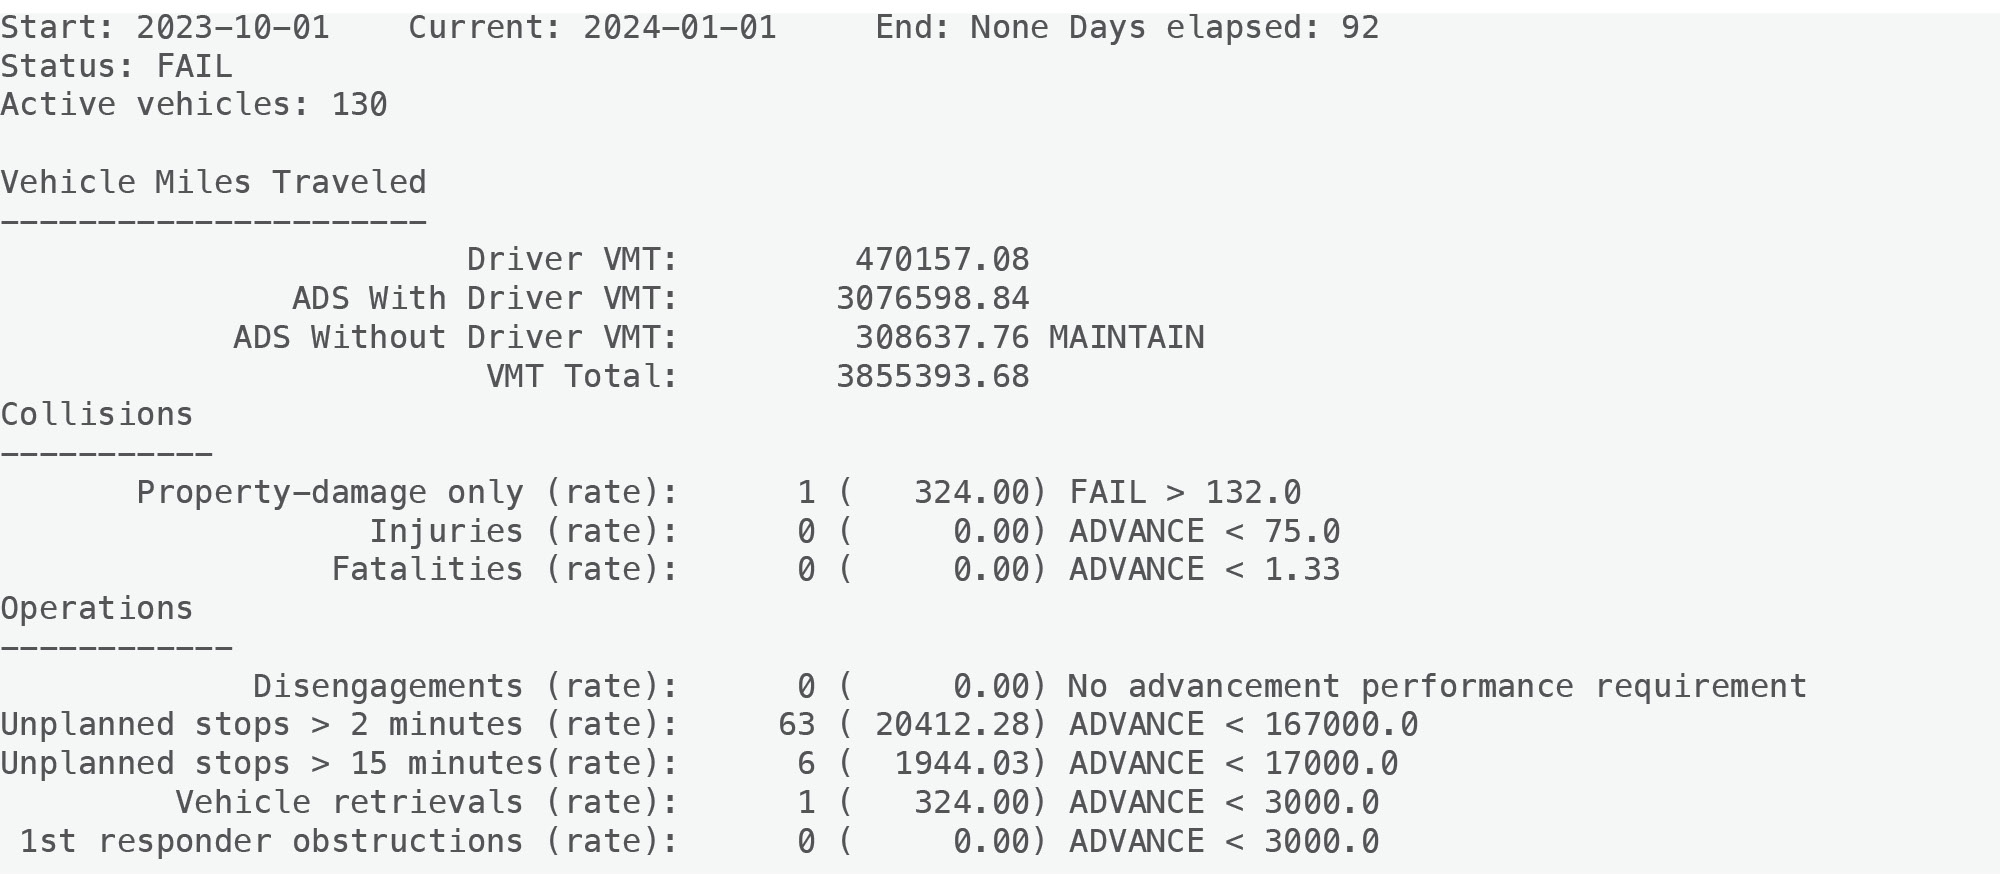
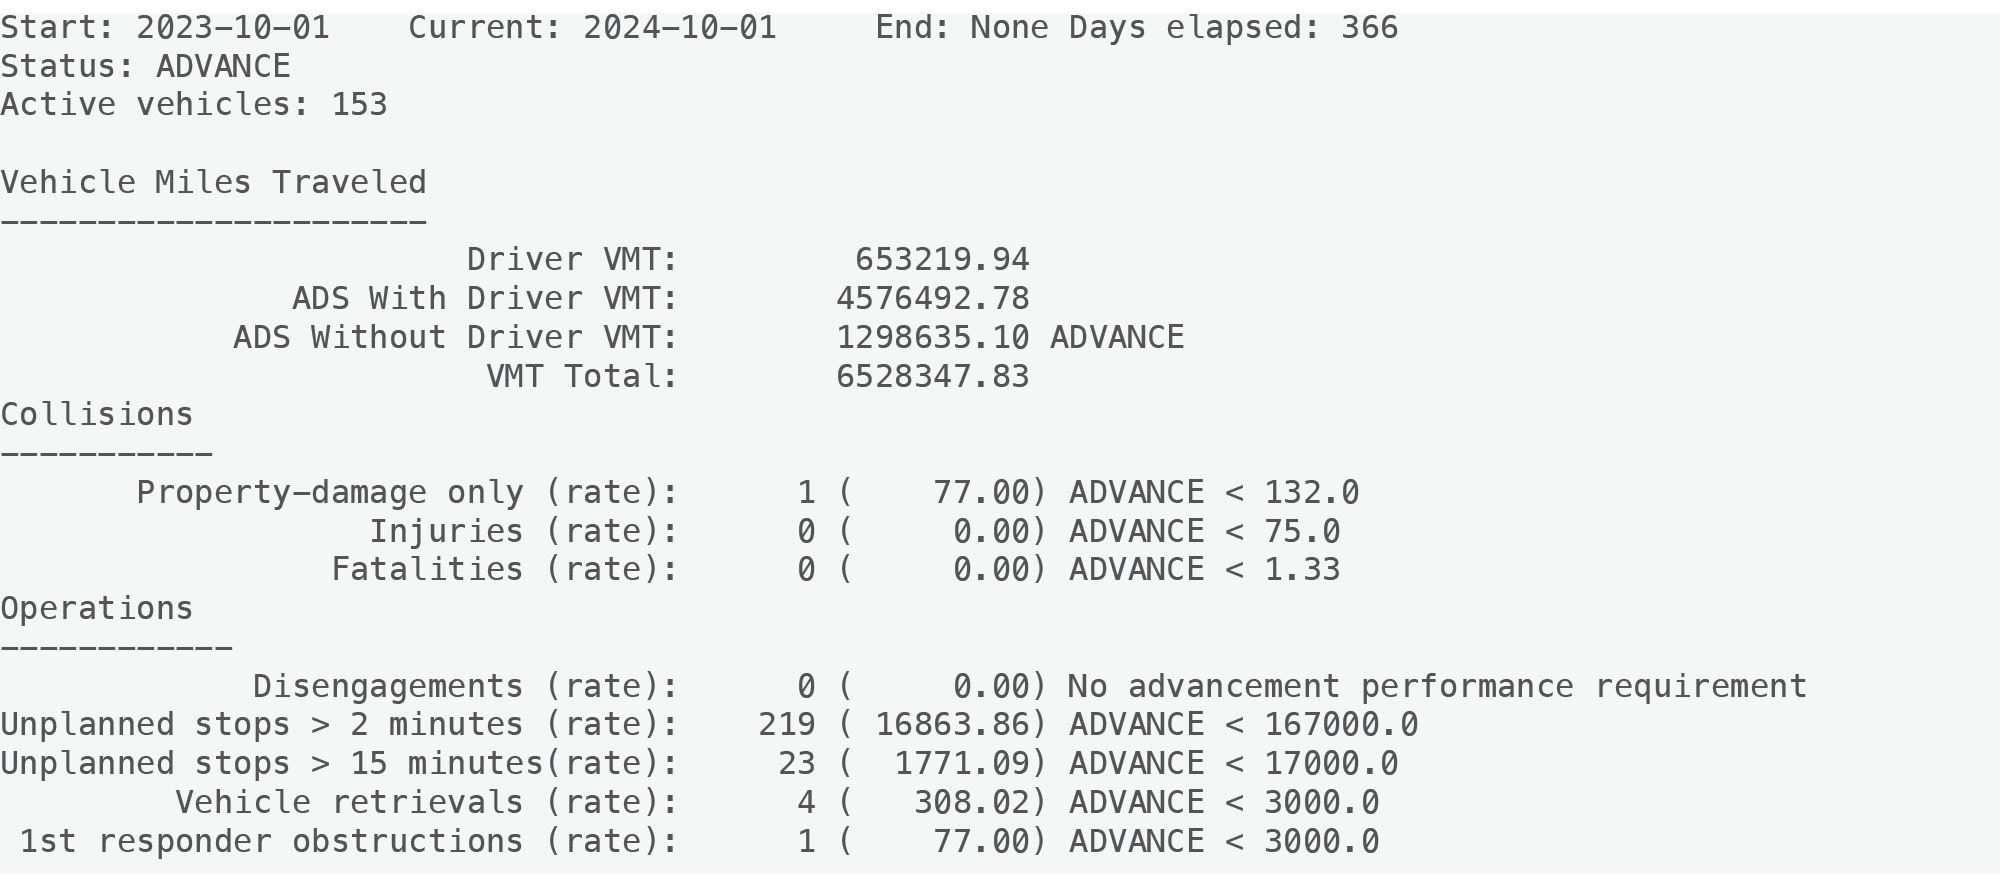
Omicron began driverless pilot service in October 2023, operating with 170 vehicles, while the balance of vehicles in Omicron’s fleet continued testing. They reported their first property damage only collision the following month in November 2023, as shown in Figure 4. Because they had only accumulated 309,000 driverless miles in their first quarter, this caused their injury rate to climb to 324 injuries per 100 million VMT, exceeding the acceptable threshold of 132 property damage only collisions per 100 million VMT. Omicron was placed on provisional status requiring that every quarter they report a declining injury rate until they fell back below the 132 property damage only collisions per VMT threshold. Their rate continually declined and ultimately fell below the threshold in May 2024. By the end of the third quarter of 2024, Omicron reached the required 1 million VMT threshold and were permitted to advance to commercial service phase 1 (see Figure 6).
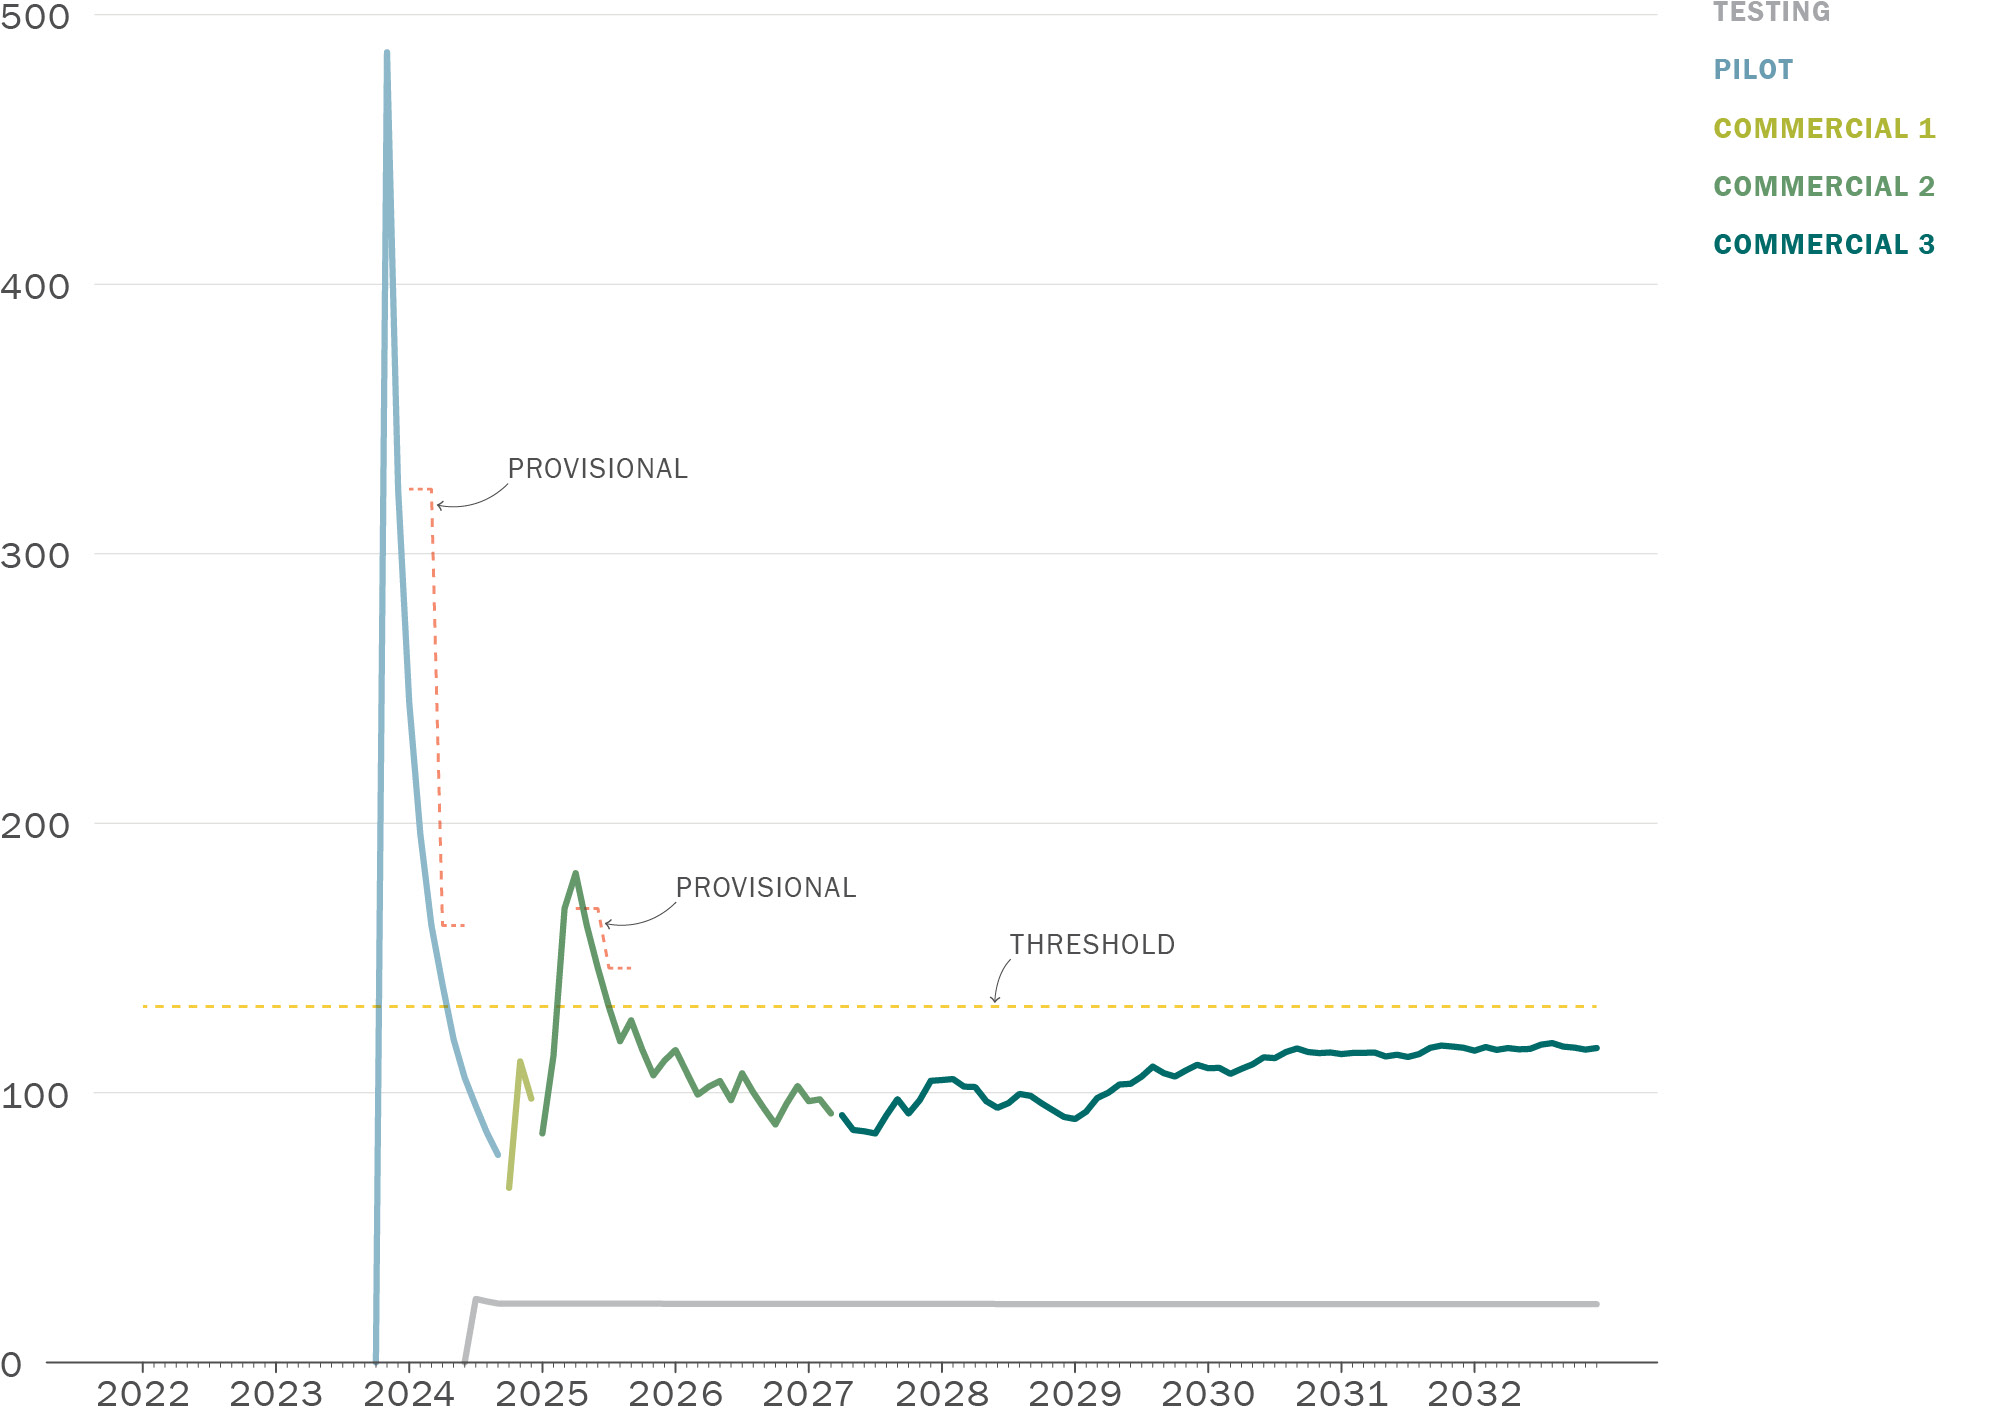
Operating with 340 vehicles, Omicron moved quickly through commercial service phase 1, meeting all required thresholds and accumulating over 2 million driverless within a single quarter. By the end of Commercial Phase 1, their driverless operations had accumulated 2 property damage only collisions, 1 injury, and no fatalities. They had 4 vehicle retrieval event, 28 unplanned stop exceeding 15 minutes, and 323 unplanned stops exceeding 2 minutes (see Figure 2). During this period, they used their entire fleet for commercial operations, and did not conduct further testing with a safety driver.

Omicron began commercial service phase 2 in January 2025, and began to expand their fleet up to the permitted 1,700 vehicles. At the beginning of driverless commercial service phase 2, they were driving 250,000 miles per month (see Figure 8), and by the end had increased to over 1 million miles per month. They had a cluster of collisions that resulted in exceeding the property damage only collision rate threshold (see Figure 5) and injury rate threshold (see Figure 9). Both rates fell below the applicable thresholds later that year. Over this time, Omicron’s rate of unplanned stops exceeding 2 minutes fell from 15,500 (above the threshold) to 12,300 (below the threshold). Omicron was permitted to advance to Commercial Phase 3 in April 2027. Had they brought down their rate of unplanned stops exceeding 2 minutes earlier, they could have advanced as early as October 2025.
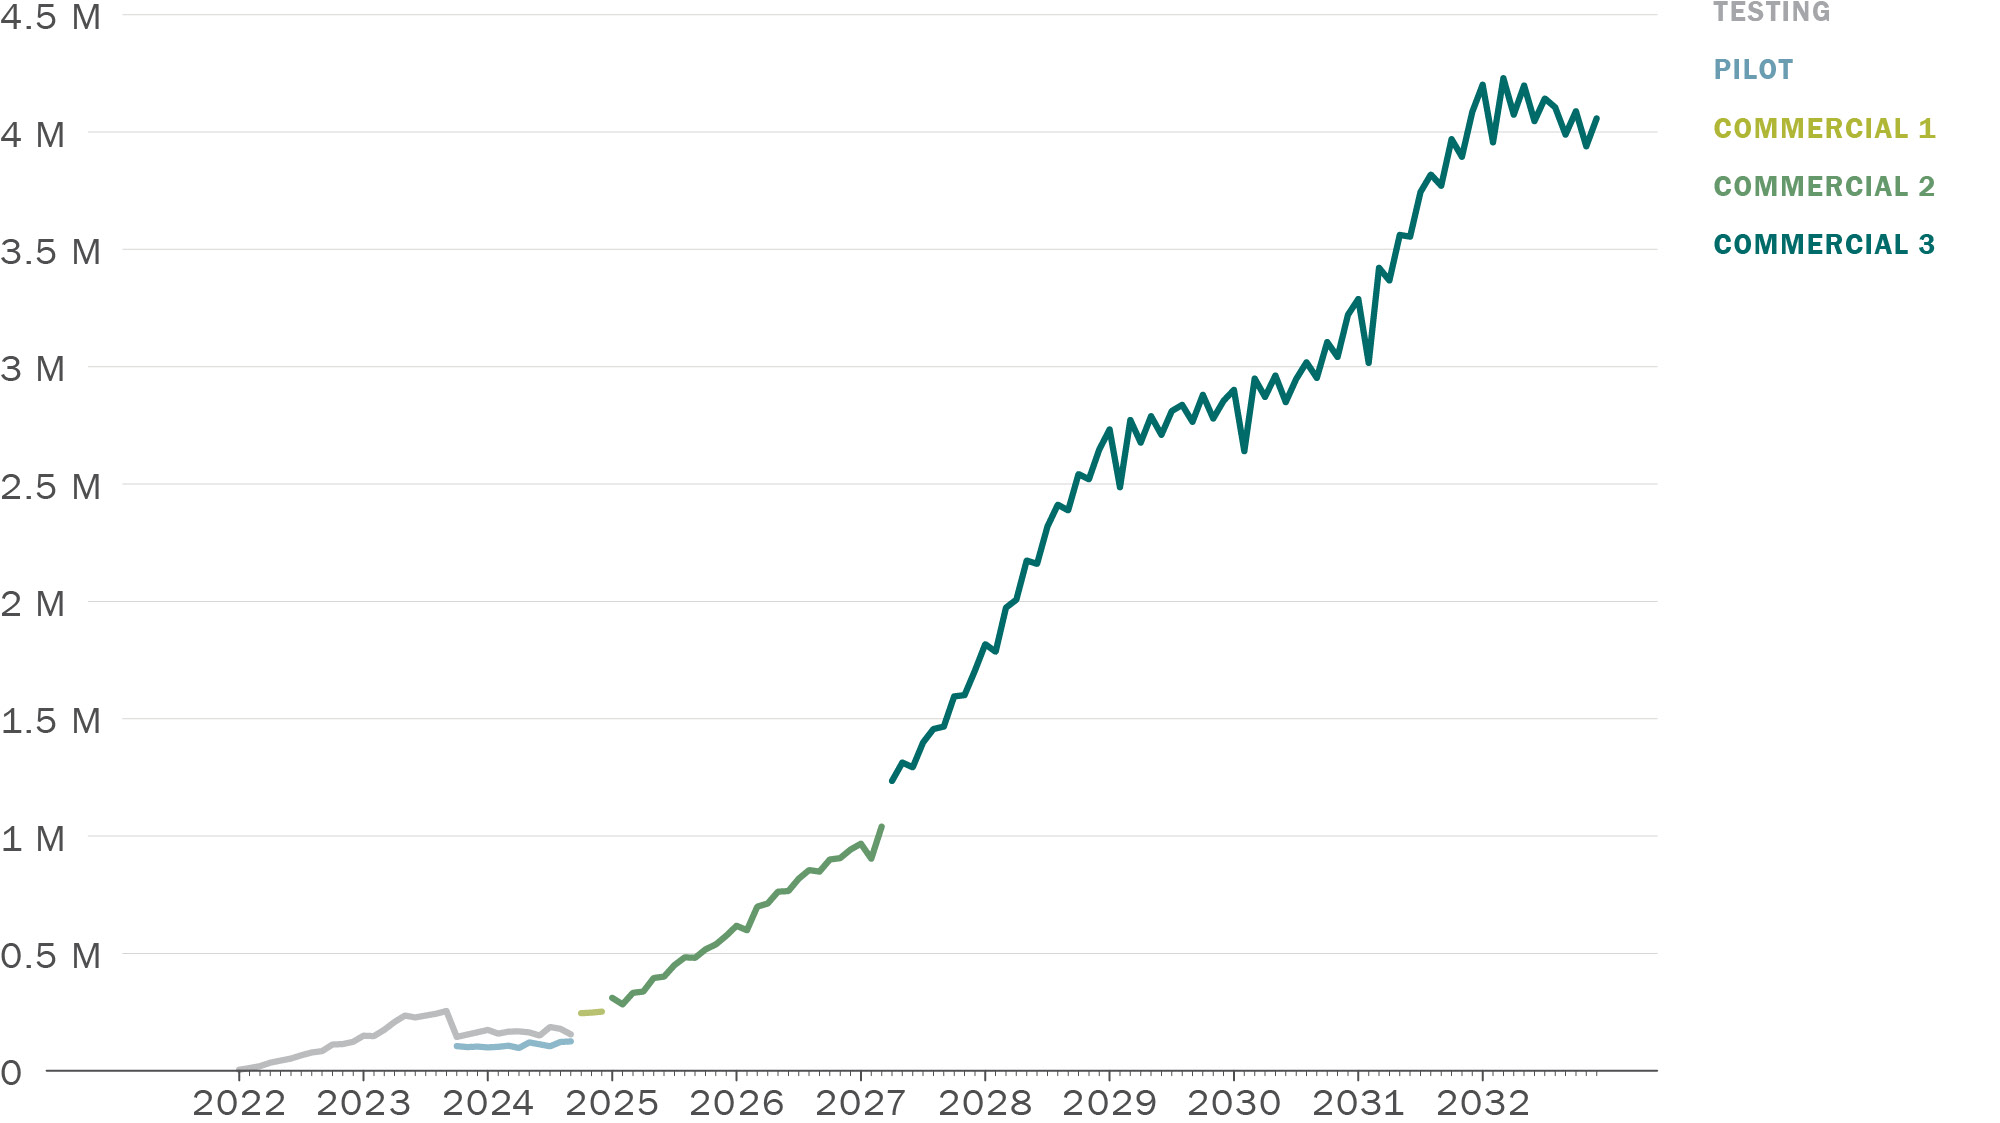
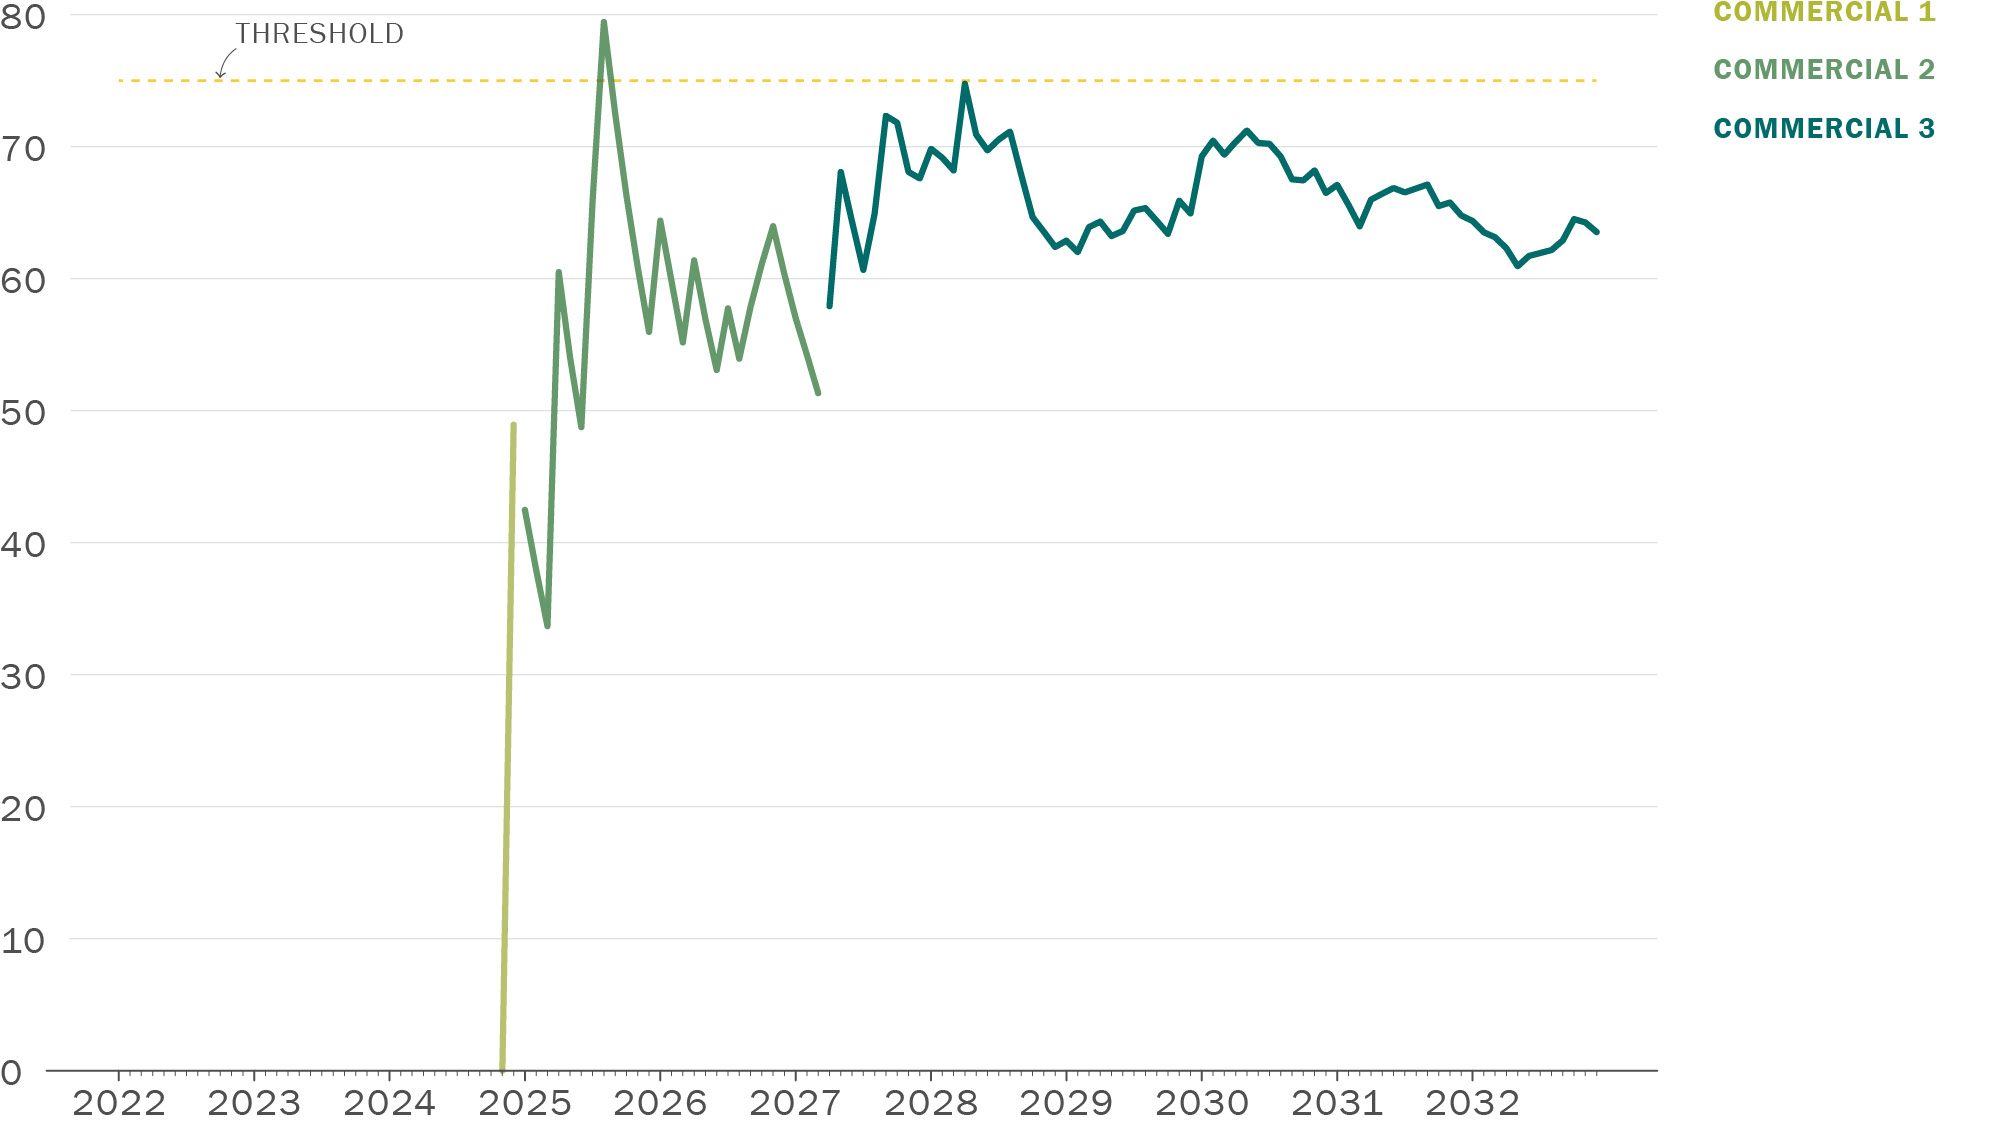
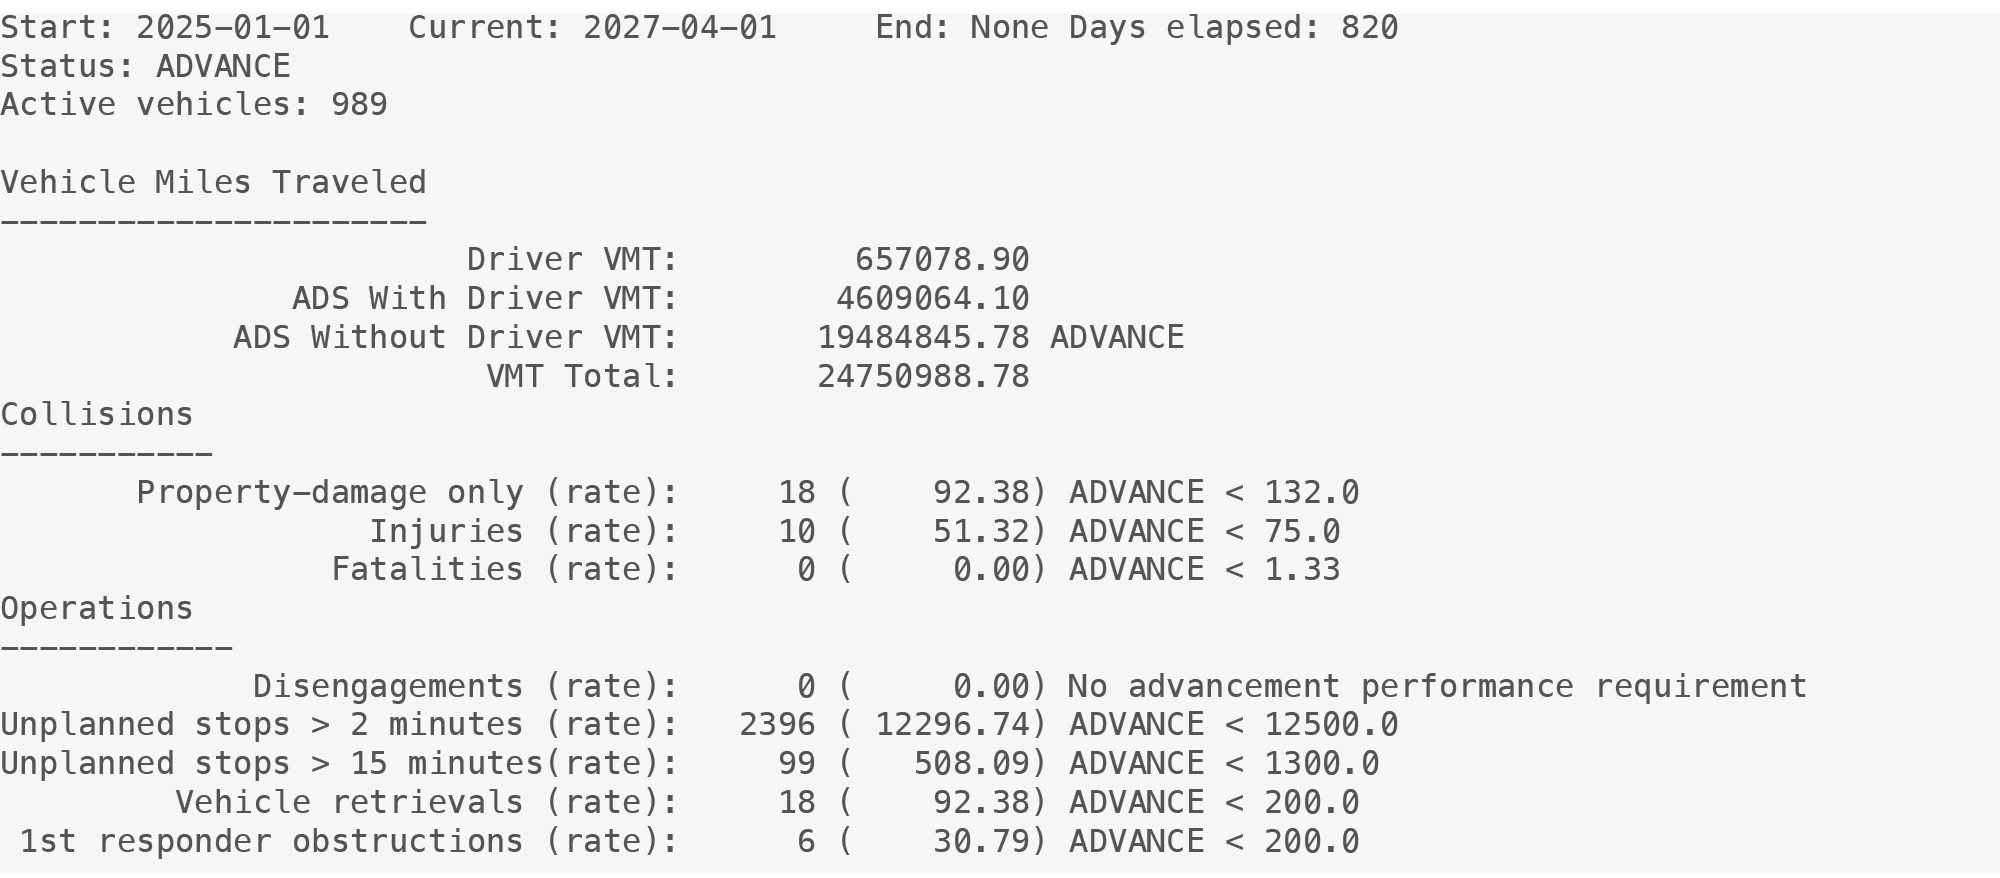
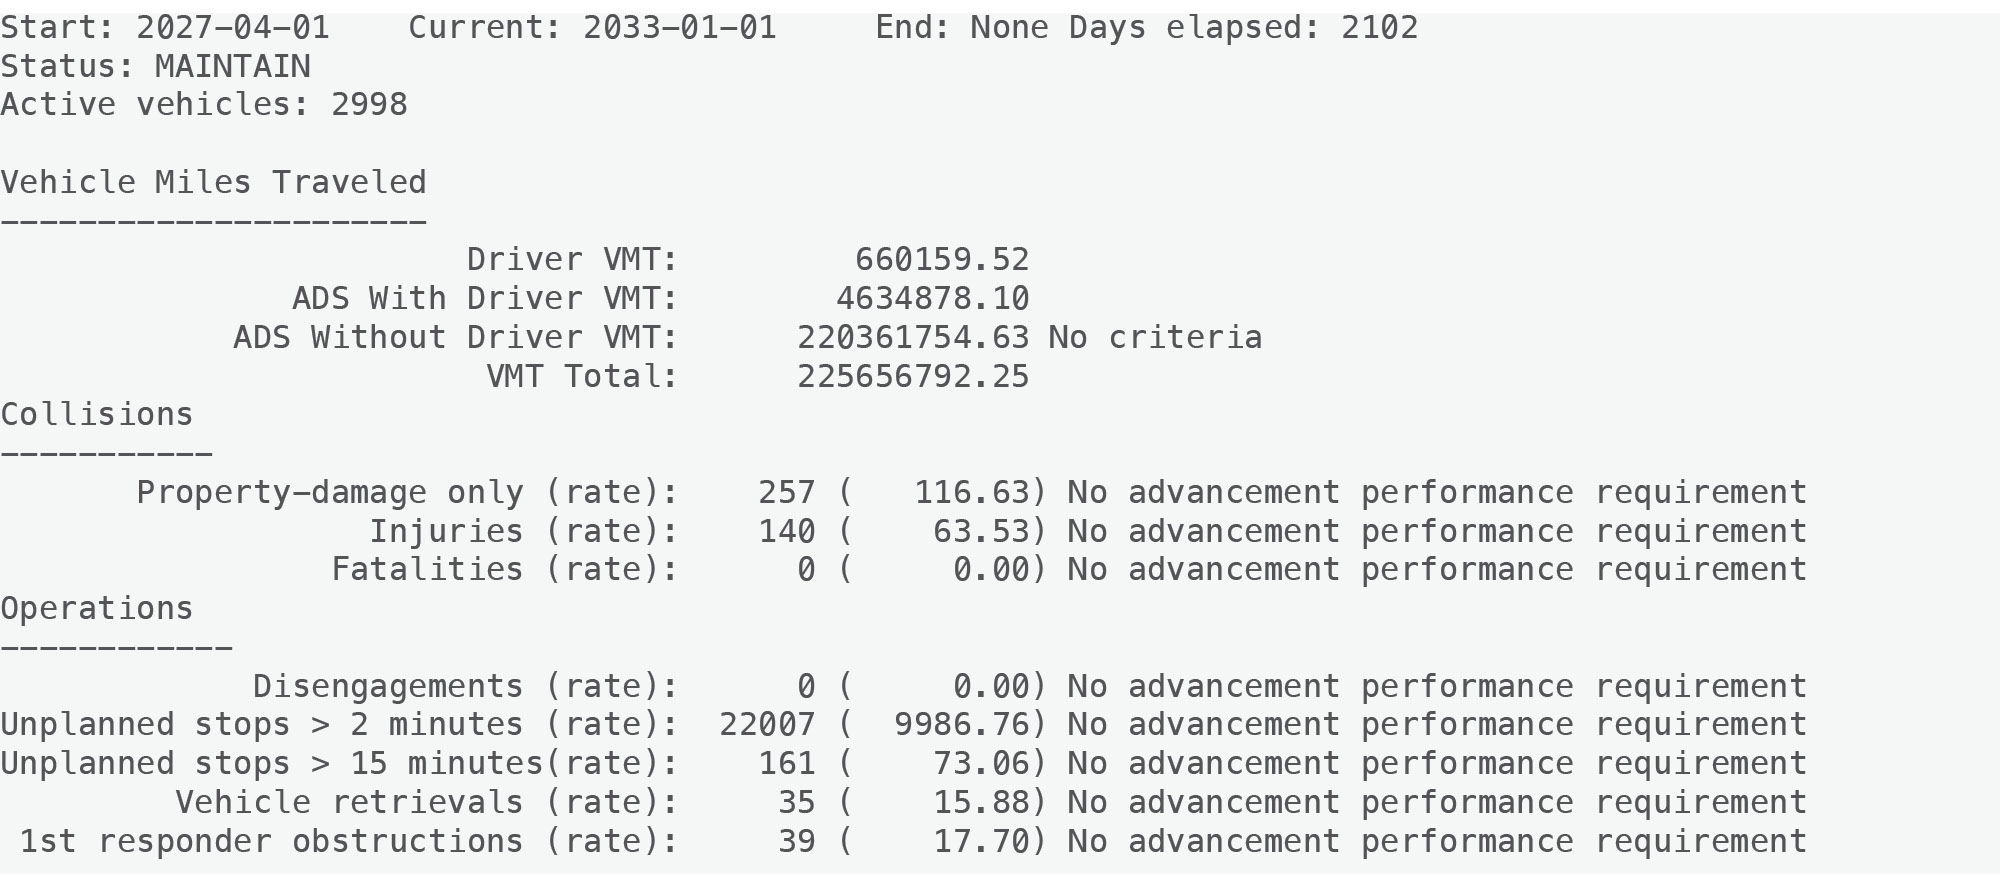
Omicron operated in Commercial Phase 3 from April 2027 to December 2032, the end of the simulated period. During this time they accumulated over 200 million miles. They were involved in 239 PDO collisions and collisions which resulted in 130 injuries. Omicron was not involved in any fatal collisions. They nearly 20,000 unplanned stops lasting 2 minutes or longer, 62 unplanned stops lasting 15 minutes or longer, 17 vehicle retrieval events, and 33 instances of obstructing first responders.
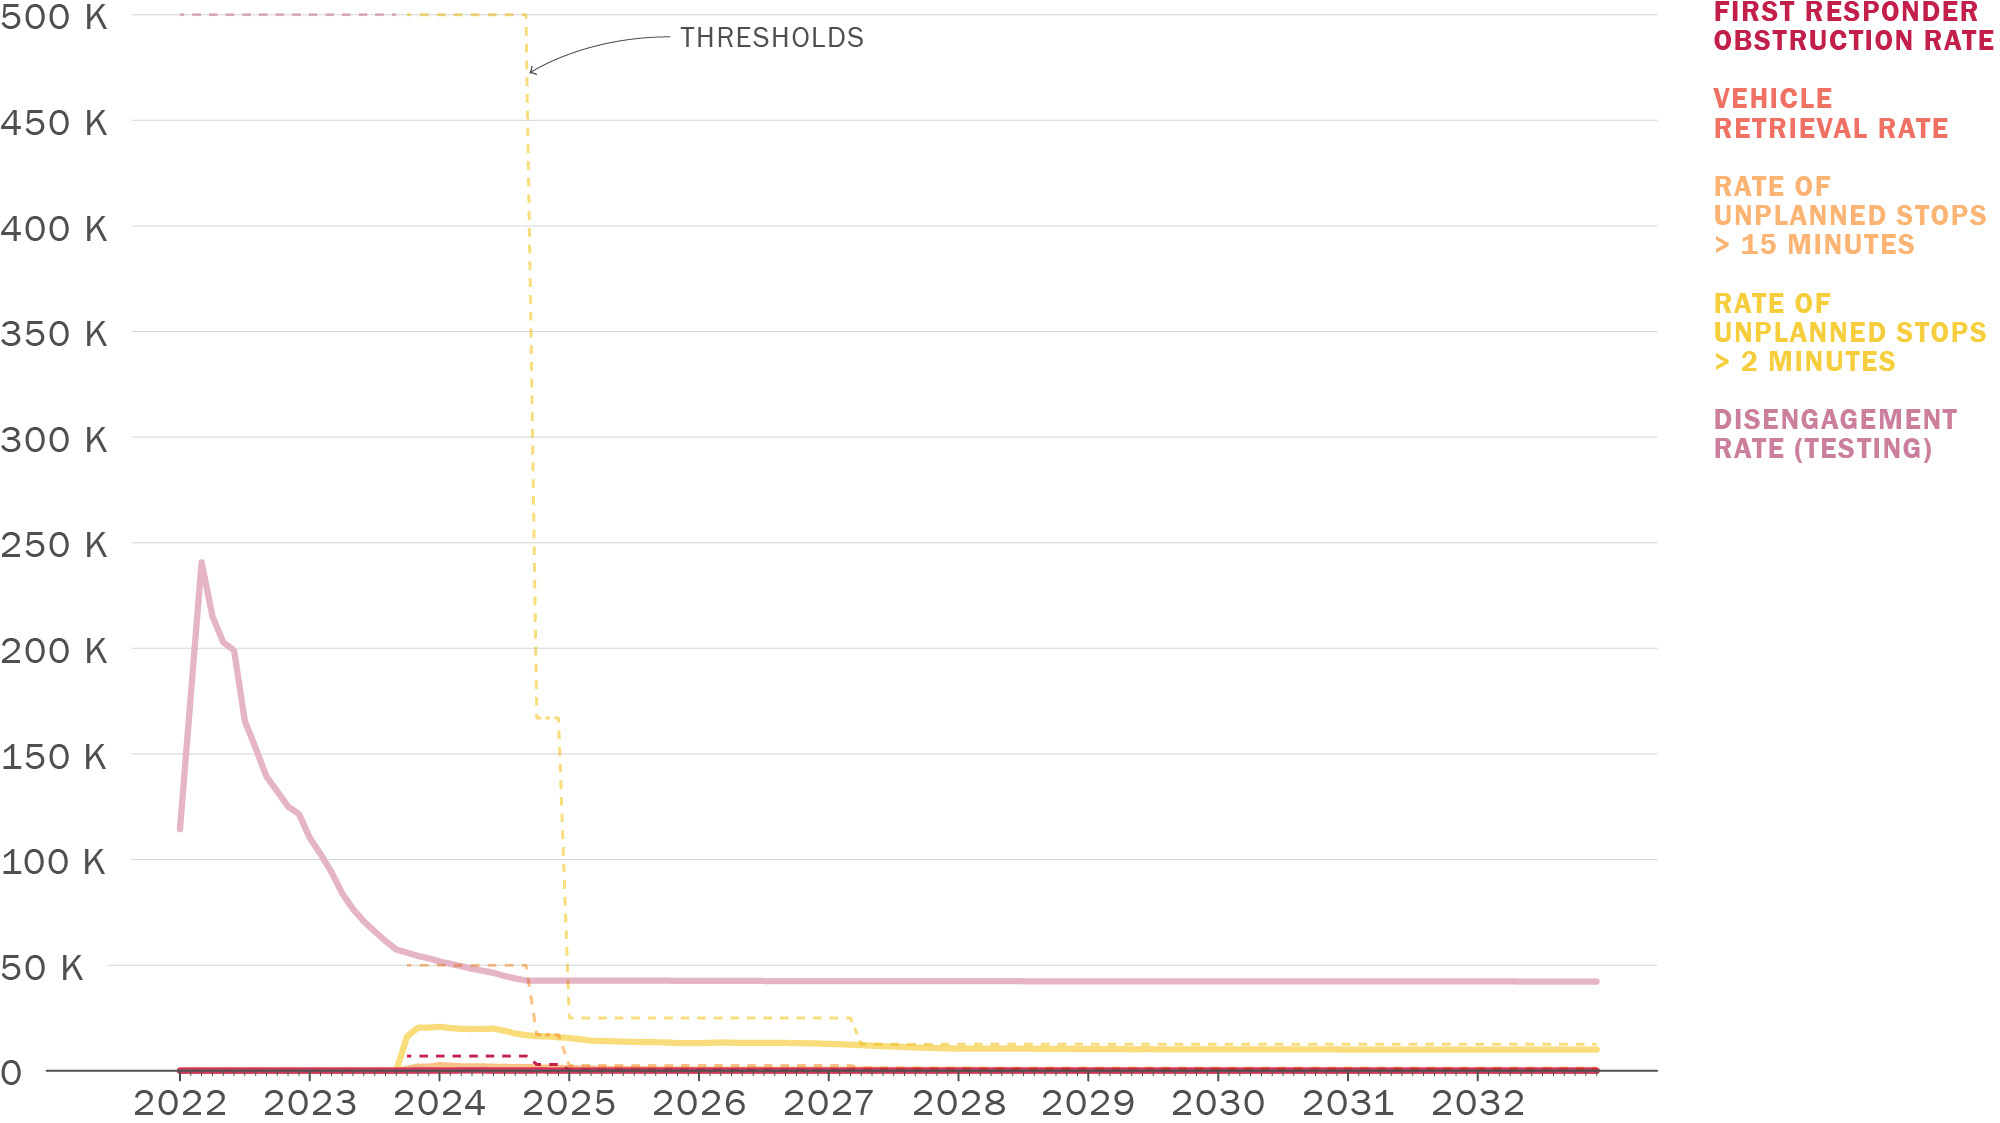
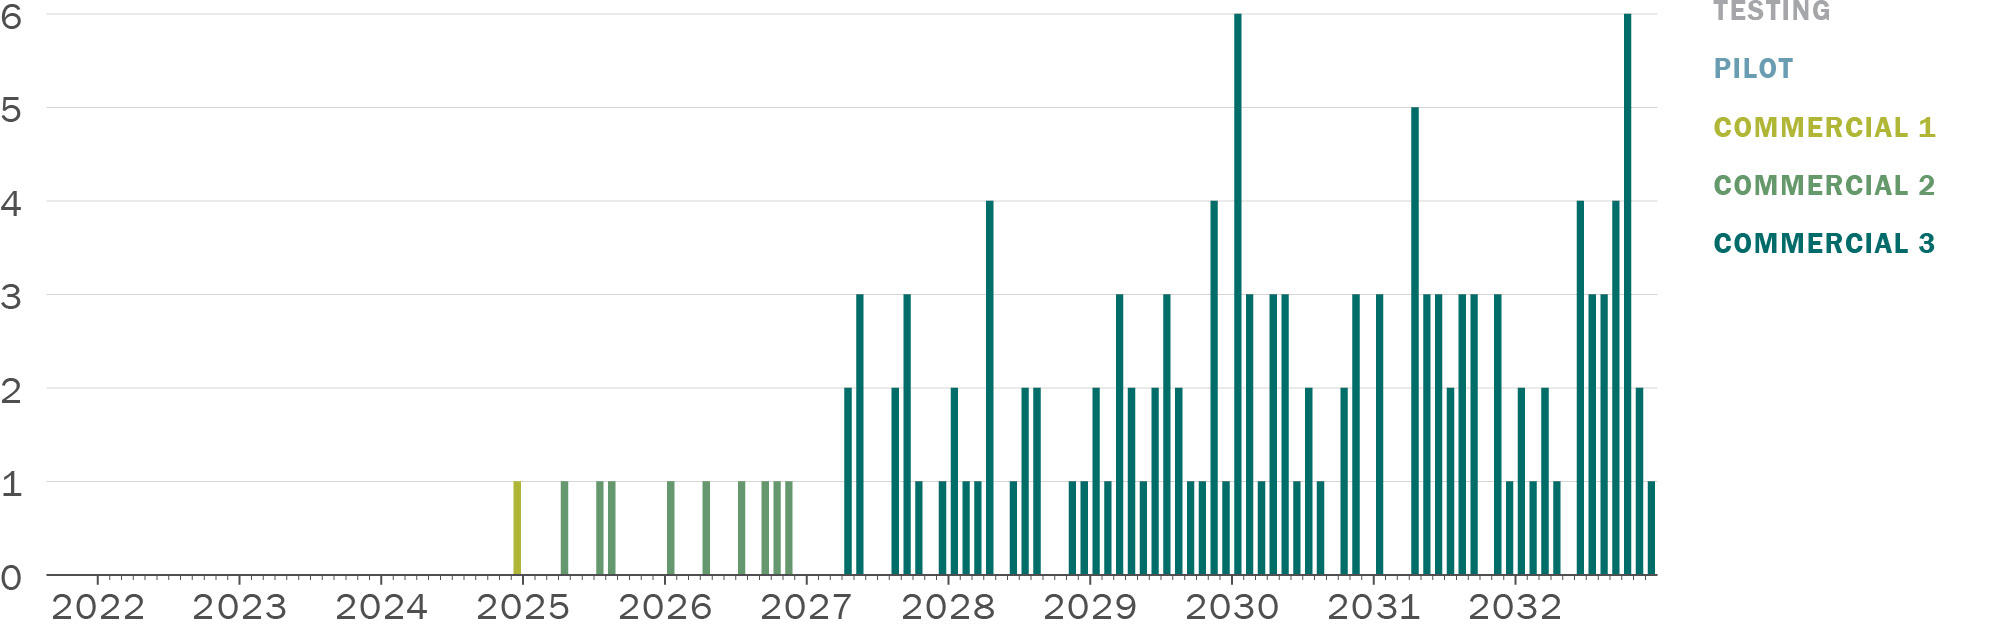
From January 2022 to December 2032, Omicron drove over 220 million driverless miles, and their driverless operations resulted in 257 property damage only collisions, 140 injuries, and no fatalities (See Figure 11). Their safety and operational rates stabilized below the established performance thresholds as their technology matured and the accrued more miles (see Figure 3, Figure 5, and Figure 9). By contrast the absolute number of events in some cases peaked and then began to decline (Figure 15 and Figure 16) while in other cases continued to rise (Figures 12, 13, and 14).
This example demonstrates that the proposed framework provides a transparent tool to track AV performance as an AV provider advances from the testing phases to the more complex commercial driverless operations. AV service providers are held to higher standards at each successive phase, requiring them to demonstrate performance before advancing, and risking demotion into an earlier phase if they advance before they are ready. Transparent data reporting will create a meaningful feedback loop to the regulators and AV service providers, enabling them to identify and address issues as they arise. This transparency will also build confidence among the public.
The next phase of this work will aim to strengthen the conceptual framework by engaging a broader range of stakeholders, including practitioners, academics, regulators, and city officials. This collaboration will help refine the concepts presented here and improve their applicability and effective for real-world contexts.
|
Field |
Description |
|---|---|
|
vin |
Vehicle identification number |
|
company |
AV passenger service operator |
|
phase |
Phase of testing or deployment |
|
dmv_permit_id |
DMV permit ID number |
|
cpuc_permit_id |
CPUC permit ID number |
|
year |
Year |
|
month |
Month |
|
city |
City |
|
county |
County |
|
vmt_total |
Total VMT |
|
vmt_driver |
VMT driven by a human driver |
|
vmt_ads_with_driver |
VMT driven by an automated driving system with a backup human safety driver present |
|
vmt_ads_no_driver |
VMT driven by an automated driving system without a backup human safety driver present |
|
Field |
Description |
|---|---|
|
vin |
Vehicle identification number |
|
company |
AV passenger service operator |
|
phase |
Phase of testing or deployment |
|
dmv_permit_id |
DMV permit ID number |
|
cpuc_permit_id |
CPUC permit ID number |
|
county |
County |
|
city |
City |
|
timestamp |
Date and time in Coordinated Universal Time (UTC) |
|
lat |
Latitude |
|
lon |
Longitude |
|
in_gp_lane |
1 if any part of the vehicle is occupying a GP lane, 0 otherwise |
|
in_bus_lane |
1 if any part of the vehicle is occupying a bus lane, 0 otherwise |
|
in_bike_lane |
1 if any part of the vehicle is occupying a bike line, 0 otherwise |
|
on_rail_track |
1 if any part of the vehicle is in the path of a rail vehicle, 0 otherwise |
|
vehicle_retrieval |
1 if the event ended with the vehicle being towed or driven away by a human driver |
|
first_responder_obstruction |
1 if the event obstructed an ambulance, firetruck, police vehicle, or other emergency or first-responder vehicle |
|
duration |
Duration of the stop in seconds |
|
vin |
Company |
Phase |
dmv_permit_id |
cpuc_permit_id |
year |
month |
city |
county |
vmt_total |
vmt_driver |
vmt_ads_with_driver |
vmt_ads_no_driver |
|---|---|---|---|---|---|---|---|---|---|---|---|---|
|
1A40VPCV082434074 |
Omicron |
commercial_3 |
DMV00032 |
CPUC00033 |
2029 |
9 |
San Francisco |
San Francisco |
158.59 |
0 |
0 |
158.59 |
|
1A40VPCV082434074 |
Omicron |
commercial_3 |
DMV00032 |
CPUC00033 |
2029 |
10 |
San Francisco |
San Francisco |
1238.38 |
0 |
0 |
1238.38 |
|
1A40VPCV082434074 |
Omicron |
commercial_3 |
DMV00032 |
CPUC00033 |
2029 |
11 |
San Francisco |
San Francisco |
1301.19 |
0 |
0 |
1301.19 |
|
1A40VPCV082434074 |
Omicron |
commercial_3 |
DMV00032 |
CPUC00033 |
2029 |
12 |
San Francisco |
San Francisco |
1345.93 |
0 |
0 |
1345.93 |
|
1A40VPCV082434074 |
Omicron |
commercial_3 |
DMV00032 |
CPUC00033 |
2030 |
1 |
San Francisco |
San Francisco |
1311.18 |
0 |
0 |
1311.18 |
|
1A40VPCV082434074 |
Omicron |
commercial_3 |
DMV00032 |
CPUC00033 |
2030 |
2 |
San Francisco |
San Francisco |
1248.50 |
0 |
0 |
1248.50 |
|
1A40VPCV082434074 |
Omicron |
commercial_3 |
DMV00032 |
CPUC00033 |
2030 |
3 |
San Francisco |
San Francisco |
1359.42 |
0 |
0 |
1359.42 |
|
1A40VPCV082434074 |
Omicron |
commercial_3 |
DMV00032 |
CPUC00033 |
2030 |
4 |
San Francisco |
San Francisco |
1420.13 |
0 |
0 |
1420.13 |
|
1A40VPCV082434074 |
Omicron |
commercial_3 |
DMV00032 |
CPUC00033 |
2030 |
5 |
San Francisco |
San Francisco |
1478.56 |
0 |
0 |
1478.56 |
|
1A40VPCV082434074 |
Omicron |
commercial_3 |
DMV00032 |
CPUC00033 |
2030 |
6 |
San Francisco |
San Francisco |
1181.57 |
0 |
0 |
1181.57 |
|
1A40VPCV082434074 |
Omicron |
commercial_3 |
DMV00032 |
CPUC00033 |
2030 |
7 |
San Francisco |
San Francisco |
1409.28 |
0 |
0 |
1409.28 |
|
1A40VPCV082434074 |
Omicron |
commercial_3 |
DMV00032 |
CPUC00033 |
2030 |
8 |
San Francisco |
San Francisco |
1338.72 |
0 |
0 |
1338.72 |
|
1A40VPCV082434074 |
Omicron |
commercial_3 |
DMV00032 |
CPUC00033 |
2030 |
9 |
San Francisco |
San Francisco |
1164.10 |
0 |
0 |
1164.10 |
|
1A40VPCV082434074 |
Omicron |
commercial_3 |
DMV00032 |
CPUC00033 |
2030 |
10 |
San Francisco |
San Francisco |
1490.93 |
0 |
0 |
1490.93 |
|
1A40VPCV082434074 |
Omicron |
commercial_3 |
DMV00032 |
CPUC00033 |
2030 |
11 |
San Francisco |
San Francisco |
1217.89 |
0 |
0 |
1217.89 |
|
1A40VPCV082434074 |
Omicron |
commercial_3 |
DMV00032 |
CPUC00033 |
2030 |
12 |
San Francisco |
San Francisco |
1336.19 |
0 |
0 |
1336.19 |
|
1A40VPCV082434074 |
Omicron |
commercial_3 |
DMV00032 |
CPUC00033 |
2031 |
1 |
San Francisco |
San Francisco |
1183.48 |
0 |
0 |
1183.48 |
|
1A40VPCV082434074 |
Omicron |
commercial_3 |
DMV00032 |
CPUC00033 |
2031 |
2 |
San Francisco |
San Francisco |
1099.45 |
0 |
0 |
1099.45 |
|
1A40VPCV082434074 |
Omicron |
commercial_3 |
DMV00032 |
CPUC00033 |
2031 |
3 |
San Francisco |
San Francisco |
1407.42 |
0 |
0 |
1407.42 |
|
1A40VPCV082434074 |
Omicron |
commercial_3 |
DMV00032 |
CPUC00033 |
2031 |
4 |
San Francisco |
San Francisco |
1269.48 |
0 |
0 |
1269.48 |
|
1A40VPCV082434074 |
Omicron |
commercial_3 |
DMV00032 |
CPUC00033 |
2031 |
5 |
San Francisco |
San Francisco |
1252.95 |
0 |
0 |
1252.95 |
|
1A40VPCV082434074 |
Omicron |
commercial_3 |
DMV00032 |
CPUC00033 |
2031 |
6 |
San Francisco |
San Francisco |
1288.89 |
0 |
0 |
1288.89 |
|
1A40VPCV082434074 |
Omicron |
commercial_3 |
DMV00032 |
CPUC00033 |
2031 |
7 |
San Francisco |
San Francisco |
1362.56 |
0 |
0 |
1362.56 |
|
1A40VPCV082434074 |
Omicron |
commercial_3 |
DMV00032 |
CPUC00033 |
2031 |
8 |
San Francisco |
San Francisco |
1480.09 |
0 |
0 |
1480.09 |
|
1A40VPCV082434074 |
Omicron |
commercial_3 |
DMV00032 |
CPUC00033 |
2031 |
9 |
San Francisco |
San Francisco |
1254.84 |
0 |
0 |
1254.84 |
|
1A40VPCV082434074 |
Omicron |
commercial_3 |
DMV00032 |
CPUC00033 |
2031 |
10 |
San Francisco |
San Francisco |
1341.48 |
0 |
0 |
1341.48 |
|
1A40VPCV082434074 |
Omicron |
commercial_3 |
DMV00032 |
CPUC00033 |
2031 |
11 |
San Francisco |
San Francisco |
1309.70 |
0 |
0 |
1309.70 |
|
1A40VPCV082434074 |
Omicron |
commercial_3 |
DMV00032 |
CPUC00033 |
2031 |
12 |
San Francisco |
San Francisco |
1468.41 |
0 |
0 |
1468.41 |
|
1A40VPCV082434074 |
Omicron |
commercial_3 |
DMV00032 |
CPUC00033 |
2032 |
1 |
San Francisco |
San Francisco |
1404.52 |
0 |
0 |
1404.52 |
|
1A40VPCV082434074 |
Omicron |
commercial_3 |
DMV00032 |
CPUC00033 |
2032 |
2 |
San Francisco |
San Francisco |
1288.26 |
0 |
0 |
1288.26 |
|
1A40VPCV082434074 |
Omicron |
commercial_3 |
DMV00032 |
CPUC00033 |
2032 |
3 |
San Francisco |
San Francisco |
1251.09 |
0 |
0 |
1251.09 |
|
1A40VPCV082434074 |
Omicron |
commercial_3 |
DMV00032 |
CPUC00033 |
2032 |
4 |
San Francisco |
San Francisco |
1234.97 |
0 |
0 |
1234.97 |
|
vin |
company |
phase |
dmv_permit_id |
cpuc_permit_id |
county |
city |
timestamp |
lat |
lon |
|---|---|---|---|---|---|---|---|---|---|
|
KNMT562639G271674 |
Omicron |
testing |
DMV00030 |
None |
San Francisco |
San Francisco |
2032-03-13T15:09:29Z |
37.72908786 |
-122.542675 |
|
KNMT562639G271674 |
Omicron |
testing |
DMV00030 |
None |
San Francisco |
San Francisco |
2032-06-09T22:17:27Z |
37.77445578 |
-122.4860209 |
|
LYVDR4SZ9K5534872 |
Omicron |
testing |
DMV00030 |
None |
San Francisco |
San Francisco |
2022-01-25T14:40:45Z |
37.72654014 |
-122.4732428 |
|
LYVDR4SZ9K5534872 |
Omicron |
testing |
DMV00030 |
None |
San Francisco |
San Francisco |
2022-02-14T18:52:58Z |
37.79270151 |
-122.5898753 |
|
LYVDR4SZ9K5534872 |
Omicron |
testing |
DMV00030 |
None |
San Francisco |
San Francisco |
2022-03-29T21:43:57Z |
37.75380135 |
-122.4172918 |
|
LYVDR4SZ9K5534872 |
Omicron |
testing |
DMV00030 |
None |
San Francisco |
San Francisco |
2022-04-01T12:50:14Z |
37.78013623 |
-122.5494776 |
|
LYVDR4SZ9K5534872 |
Omicron |
testing |
DMV00030 |
None |
San Francisco |
San Francisco |
2022-05-23T23:56:47Z |
37.77924623 |
-122.4061459 |
|
LYVDR4SZ9K5534872 |
Omicron |
testing |
DMV00030 |
None |
San Francisco |
San Francisco |
2022-05-31T18:24:33Z |
37.78912015 |
-122.5919029 |
|
LYVDR4SZ9K5534872 |
Omicron |
testing |
DMV00030 |
None |
San Francisco |
San Francisco |
2022-07-07T08:08:09Z |
37.74992645 |
-122.4716263 |
|
NFB428VL620312771 |
Omicron |
testing |
DMV00030 |
None |
San Francisco |
San Francisco |
2022-02-02T19:48:17Z |
37.78963587 |
-122.5895678 |
|
NFB428VL620312771 |
Omicron |
testing |
DMV00030 |
None |
San Francisco |
San Francisco |
2022-03-29T23:44:19Z |
37.78016545 |
-122.5285855 |
|
NFB428VL620312771 |
Omicron |
testing |
DMV00030 |
None |
San Francisco |
San Francisco |
2022-04-09T17:40:47Z |
37.7697676 |
-122.4462013 |
|
NFB428VL620312771 |
Omicron |
testing |
DMV00030 |
None |
San Francisco |
San Francisco |
2022-04-28T06:07:04Z |
37.78734728 |
-122.6534396 |
|
NFB428VL620312771 |
Omicron |
testing |
DMV00030 |
None |
San Francisco |
San Francisco |
2022-05-29T19:27:44Z |
37.78678603 |
-122.4119954 |
|
NFB428VL620312771 |
Omicron |
testing |
DMV00030 |
None |
San Francisco |
San Francisco |
2022-06-01T12:20:18Z |
37.77694394 |
-122.6679641 |
|
NFB428VL620312771 |
Omicron |
testing |
DMV00030 |
None |
San Francisco |
San Francisco |
2022-08-31T19:26:21Z |
37.78374425 |
-122.5079374 |
|
VSK4GNGX0N1329004 |
Omicron |
testing |
DMV00030 |
None |
San Francisco |
San Francisco |
2022-02-18T07:53:07Z |
37.77885479 |
-122.5171663 |
|
VSK4GNGX0N1329004 |
Omicron |
testing |
DMV00030 |
None |
San Francisco |
San Francisco |
2022-02-23T15:05:15Z |
37.79351208 |
-122.5044698 |
|
VSK4GNGX0N1329004 |
Omicron |
testing |
DMV00030 |
None |
San Francisco |
San Francisco |
2022-02-28T12:38:54Z |
37.78327491 |
-122.4522674 |
|
VSK4GNGX0N1329004 |
Omicron |
testing |
DMV00030 |
None |
San Francisco |
San Francisco |
2022-03-02T17:12:51Z |
37.79083979 |
-122.522424 |
|
VSK4GNGX0N1329004 |
Omicron |
testing |
DMV00030 |
None |
San Francisco |
San Francisco |
2022-03-18T18:20:42Z |
37.79075968 |
-122.4599065 |
|
VSK4GNGX0N1329004 |
Omicron |
testing |
DMV00030 |
None |
San Francisco |
San Francisco |
2022-05-01T16:09:06Z |
37.79336347 |
-122.6269946 |
|
VSK4GNGX0N1329004 |
Omicron |
testing |
DMV00030 |
None |
San Francisco |
San Francisco |
2022-08-19T16:56:06Z |
37.73284718 |
-122.4750582 |
|
VSK4GNGX0N1329004 |
Omicron |
testing |
DMV00030 |
None |
San Francisco |
San Francisco |
2022-08-26T05:33:06Z |
37.78788699 |
-122.5048926 |
|
VSK4GNGX0N1329004 |
Omicron |
testing |
DMV00030 |
None |
San Francisco |
San Francisco |
2022-09-02T17:35:08Z |
37.76776526 |
-122.595861 |
|
VSK4GNGX0N1329004 |
Omicron |
testing |
DMV00030 |
None |
San Francisco |
San Francisco |
2022-10-13T21:17:40Z |
37.74325393 |
-122.5360168 |
|
VSK4GNGX0N1329004 |
Omicron |
testing |
DMV00030 |
None |
San Francisco |
San Francisco |
2022-10-22T09:33:03Z |
37.75805826 |
-122.5087512 |
|
VSK4GNGX0N1329004 |
Omicron |
testing |
DMV00030 |
None |
San Francisco |
San Francisco |
2022-11-10T14:34:42Z |
37.75189938 |
-122.6279204 |
|
7JRW5WCG3KS826325 |
Omicron |
testing |
DMV00030 |
None |
San Francisco |
San Francisco |
2022-02-05T15:32:54Z |
37.74307933 |
-122.5810294 |
|
7JRW5WCG3KS826325 |
Omicron |
testing |
DMV00030 |
None |
San Francisco |
San Francisco |
2022-02-26T15:22:51Z |
37.79484452 |
-122.4310456 |
|
7JRW5WCG3KS826325 |
Omicron |
testing |
DMV00030 |
None |
San Francisco |
San Francisco |
2022-04-07T18:09:52Z |
37.7613847 |
-122.6018284 |
|
7JRW5WCG3KS826325 |
Omicron |
testing |
DMV00030 |
None |
San Francisco |
San Francisco |
2022-04-23T18:22:35Z |
37.72681114 |
-122.5967837 |
|
vin |
company |
phase |
dmv_permit_id |
cpuc_permit_id |
county |
city |
timestamp |
lat |
lon |
in_gp_lane |
in_bus_lane |
in_bike_lane |
on_rail_track |
vehicle_retrieval |
first_responder_obstruction |
duration |
|---|---|---|---|---|---|---|---|---|---|---|---|---|---|---|---|---|
|
JTHACMRPXTY796263 |
Omicron |
commercial_3 |
DMV00032 |
CPUC00033 |
San Francisco |
San Francisco |
2032-12-26T23:03:02Z |
37.75655129 |
-122.4067191 |
0 |
0 |
0 |
0 |
0 |
0 |
4.29 |
|
XW859Z2W75Z061449 |
Omicron |
commercial_3 |
DMV00032 |
CPUC00033 |
San Francisco |
San Francisco |
2032-12-16T21:31:29Z |
37.7826109 |
-122.407227 |
1 |
0 |
0 |
0 |
0 |
0 |
2.91 |
|
9GAP4KMT3RM061135 |
Omicron |
commercial_3 |
DMV00032 |
CPUC00033 |
San Francisco |
San Francisco |
2032-12-14T23:36:26Z |
37.71803852 |
-122.4679715 |
1 |
0 |
0 |
0 |
0 |
0 |
9.96 |
|
JAE9A2KH87S465441 |
Omicron |
commercial_3 |
DMV00032 |
CPUC00033 |
San Francisco |
San Francisco |
2032-12-26T21:14:55Z |
37.78967245 |
-122.4079982 |
1 |
0 |
1 |
0 |
0 |
0 |
3.36 |
|
JT8HH14Y3E7227195 |
Omicron |
commercial_3 |
DMV00032 |
CPUC00033 |
San Francisco |
San Francisco |
2032-12-15T22:33:42Z |
37.75273583 |
-122.4612034 |
1 |
0 |
0 |
0 |
0 |
0 |
6.62 |
|
VSKMJRVH8GR733869 |
Omicron |
commercial_3 |
DMV00032 |
CPUC00033 |
San Francisco |
San Francisco |
2032-12-04T21:51:56Z |
37.78859929 |
-122.4317611 |
1 |
0 |
0 |
0 |
0 |
0 |
9.63 |
|
WB5WBLM59DS079797 |
Omicron |
commercial_3 |
DMV00032 |
CPUC00033 |
San Francisco |
San Francisco |
2032-11-27T00:28:37Z |
37.78151691 |
-122.429094 |
1 |
0 |
0 |
0 |
0 |
0 |
6.49 |
|
9371SWT34ND081175 |
Omicron |
commercial_3 |
DMV00032 |
CPUC00033 |
San Francisco |
San Francisco |
2032-11-28T21:51:42Z |
37.75592807 |
-122.605527 |
1 |
0 |
0 |
0 |
0 |
0 |
3.02 |
|
W08JYWSYXLL254068 |
Omicron |
commercial_3 |
DMV00032 |
CPUC00033 |
San Francisco |
San Francisco |
2032-12-25T21:50:30Z |
37.72792499 |
-122.6316737 |
1 |
0 |
0 |
0 |
0 |
0 |
10.99 |
|
LVYJ4C2H360041446 |
Omicron |
commercial_3 |
DMV00032 |
CPUC00033 |
San Francisco |
San Francisco |
2032-11-22T21:28:52Z |
37.77307708 |
-122.5477233 |
1 |
0 |
0 |
0 |
0 |
0 |
5.51 |
|
3A4JAHPA1AP663437 |
Omicron |
commercial_3 |
DMV00032 |
CPUC00033 |
San Francisco |
San Francisco |
2032-12-27T21:10:20Z |
37.7414588 |
-122.4336098 |
1 |
0 |
0 |
0 |
0 |
0 |
4.14 |
|
NC0A2B6K1DK631573 |
Omicron |
commercial_3 |
DMV00032 |
CPUC00033 |
San Francisco |
San Francisco |
2032-10-16T22:20:24Z |
37.77430439 |
-122.5111114 |
1 |
0 |
0 |
0 |
0 |
0 |
6.15 |
|
9BV9WNJN8PG827768 |
Omicron |
commercial_3 |
DMV00032 |
CPUC00033 |
San Francisco |
San Francisco |
2032-11-04T22:15:48Z |
37.76174858 |
-122.5859872 |
1 |
0 |
0 |
0 |
0 |
0 |
1.96 |
|
NMTDT8T00HK531542 |
Omicron |
commercial_3 |
DMV00032 |
CPUC00033 |
San Francisco |
San Francisco |
2032-10-09T22:34:34Z |
37.7909341 |
-122.4988251 |
1 |
0 |
0 |
0 |
0 |
0 |
5.11 |
|
NMTDT8T00HK531542 |
Omicron |
commercial_3 |
DMV00032 |
CPUC00033 |
San Francisco |
San Francisco |
2032-11-04T03:04:54Z |
37.78517536 |
-122.6140846 |
1 |
1 |
0 |
0 |
0 |
0 |
3.93 |
|
NMTDT8T00HK531542 |
Omicron |
commercial_3 |
DMV00032 |
CPUC00033 |
San Francisco |
San Francisco |
2032-12-24T21:38:11Z |
37.77678214 |
-122.4405881 |
1 |
0 |
1 |
0 |
0 |
0 |
3.40 |
|
4G1CBK982PL965020 |
Omicron |
commercial_3 |
DMV00032 |
CPUC00033 |
San Francisco |
San Francisco |
2032-12-04T23:24:50Z |
37.7410294 |
-122.5714009 |
1 |
1 |
0 |
0 |
0 |
0 |
4.26 |
|
MEE37YN40MG306437 |
Omicron |
commercial_3 |
DMV00032 |
CPUC00033 |
San Francisco |
San Francisco |
2032-10-04T21:41:18Z |
37.78594707 |
-122.5193814 |
1 |
0 |
0 |
0 |
0 |
0 |
7.48 |
|
MEE37YN40MG306437 |
Omicron |
commercial_3 |
DMV00032 |
CPUC00033 |
San Francisco |
San Francisco |
2032-11-30T21:51:28Z |
37.78841439 |
-122.475631 |
1 |
0 |
0 |
0 |
0 |
0 |
4.70 |
|
6T1K93ELXLR799093 |
Omicron |
commercial_3 |
DMV00032 |
CPUC00033 |
San Francisco |
San Francisco |
2032-10-09T23:41:21Z |
37.77913774 |
-122.5171875 |
1 |
0 |
0 |
0 |
0 |
0 |
8.73 |
|
AFB1VXH83WF109925 |
Omicron |
commercial_3 |
DMV00032 |
CPUC00033 |
San Francisco |
San Francisco |
2032-10-01T21:19:23Z |
37.7487027 |
-122.3988329 |
1 |
0 |
0 |
0 |
0 |
0 |
6.74 |
|
4VABVJGE5J8373573 |
Omicron |
commercial_3 |
DMV00032 |
CPUC00033 |
San Francisco |
San Francisco |
2032-10-31T22:54:05Z |
37.75100431 |
-122.4287489 |
1 |
0 |
0 |
0 |
0 |
0 |
3.98 |
|
YC186SCD88P455908 |
Omicron |
commercial_3 |
DMV00032 |
CPUC00033 |
San Francisco |
San Francisco |
2032-11-12T21:09:37Z |
37.75393133 |
-122.5052366 |
1 |
0 |
1 |
0 |
0 |
0 |
5.16 |
|
VGAS1B3G13X345304 |
Omicron |
commercial_3 |
DMV00032 |
CPUC00033 |
San Francisco |
San Francisco |
2032-10-06T21:55:19Z |
37.75683354 |
-122.5512859 |
1 |
0 |
0 |
0 |
0 |
0 |
6.01 |
|
VGAS1B3G13X345304 |
Omicron |
commercial_3 |
DMV00032 |
CPUC00033 |
San Francisco |
San Francisco |
2032-12-07T21:40:11Z |
37.72538683 |
-122.4157719 |
1 |
0 |
0 |
0 |
0 |
0 |
3.54 |
|
8AWGREHB6PY703811 |
Omicron |
commercial_3 |
DMV00032 |
CPUC00033 |
San Francisco |
San Francisco |
2032-10-09T22:10:29Z |
37.76679083 |
-122.4318054 |
1 |
0 |
0 |
0 |
0 |
0 |
4.26 |
|
MECZ5AGH54F667281 |
Omicron |
commercial_3 |
DMV00032 |
CPUC00033 |
San Francisco |
San Francisco |
2032-10-27T21:16:06Z |
37.7920317 |
-122.4498376 |
1 |
0 |
0 |
0 |
0 |
0 |
6.47 |
|
MECZ5AGH54F667281 |
Omicron |
commercial_3 |
DMV00032 |
CPUC00033 |
San Francisco |
San Francisco |
2032-11-16T22:21:06Z |
37.7847513 |
-122.4806867 |
1 |
0 |
0 |
0 |
0 |
0 |
4.22 |
|
5UM1JZ0T95V669471 |
Omicron |
commercial_3 |
DMV00032 |
CPUC00033 |
San Francisco |
San Francisco |
2032-09-20T22:21:47Z |
37.78438109 |
-122.4510515 |
1 |
0 |
0 |
0 |
0 |
0 |
4.77 |
|
5UM1JZ0T95V669471 |
Omicron |
commercial_3 |
DMV00032 |
CPUC00033 |
San Francisco |
San Francisco |
2032-11-06T22:44:29Z |
37.78431568 |
-122.406854 |
1 |
0 |
0 |
0 |
0 |
0 |
6.48 |
|
YV1AH29NXN6443360 |
Omicron |
commercial_3 |
DMV00032 |
CPUC00033 |
San Francisco |
San Francisco |
2032-10-22T22:14:58Z |
37.72426209 |
-122.6071279 |
1 |
1 |
0 |
0 |
0 |
0 |
6.65 |
The San Francisco County Transportation Authority would like to thank Dr. Missy Cummings of George Mason University and Dr. Philip Koopman of Carnegie Mellon University for their advice and guidance in the development of this report.