
This website uses cookies and similar technologies. By using our website, closing this banner or clicking "I agree", you consent to our use of cookies. For additional details, please read our privacy policy.

I AGREE

SFCTA

Main navigation

  • Projects & Studies
    • Featured
    • Active
    • Capital Projects
    • Neighborhood Transportation Planning
    • Long-Range Planning
    • Congestion Management
    • All
  • Funding
    • Half-cent Sales Tax for Transportation
    • Prop AA Vehicle Registration Fee
    • Lifeline Transportation Program
    • One Bay Area Grant Program
    • Transportation Fund for Clean Air
    • TNC Tax
    • Funding Opportunities
  • Policies & Initiatives
    • Autonomous Vehicle (AV) Technology
    • Climate Action
    • Closing the Funding Gap
    • Complete Streets
    • Emerging Mobility
    • Equity Priority Communities
    • Neighborhood Program
    • Pricing & Incentives
    • Transit-First Policy
    • Transportation Demand Management
    • Vision Zero
  • Tools & Data
    • Maps & Data
    • Transportation Analysis Tools
  • What's Happening
    • Meetings, Agendas & Events
    • Blog
    • Press Releases
    • Stay Connected
  • About Us
    • Who We Are
    • Work with Us
    • Annual Reports
    • Governing Policies
    • Contact Us

Projects & Studies

We plan, fund, and deliver projects large and small across the city.

Select category

Grid List
Image
A 3-dimensional map of California showing total TNC trips per square mile by zip code. Trip density is represented by height and by color scale from gray to orange. Zip codes with few or no trips are flat and gray. Zip codes with more trips per square mile are progressively taller and darker shades of orange. The map shows a tall cluster of dark orange towers in San Francisco, followed by a cluster of medium-orange towers in Los Angeles, shorter and covering a larger area than San Francisco.

TNCs 2020: A Profile of Ride-Hailing in California

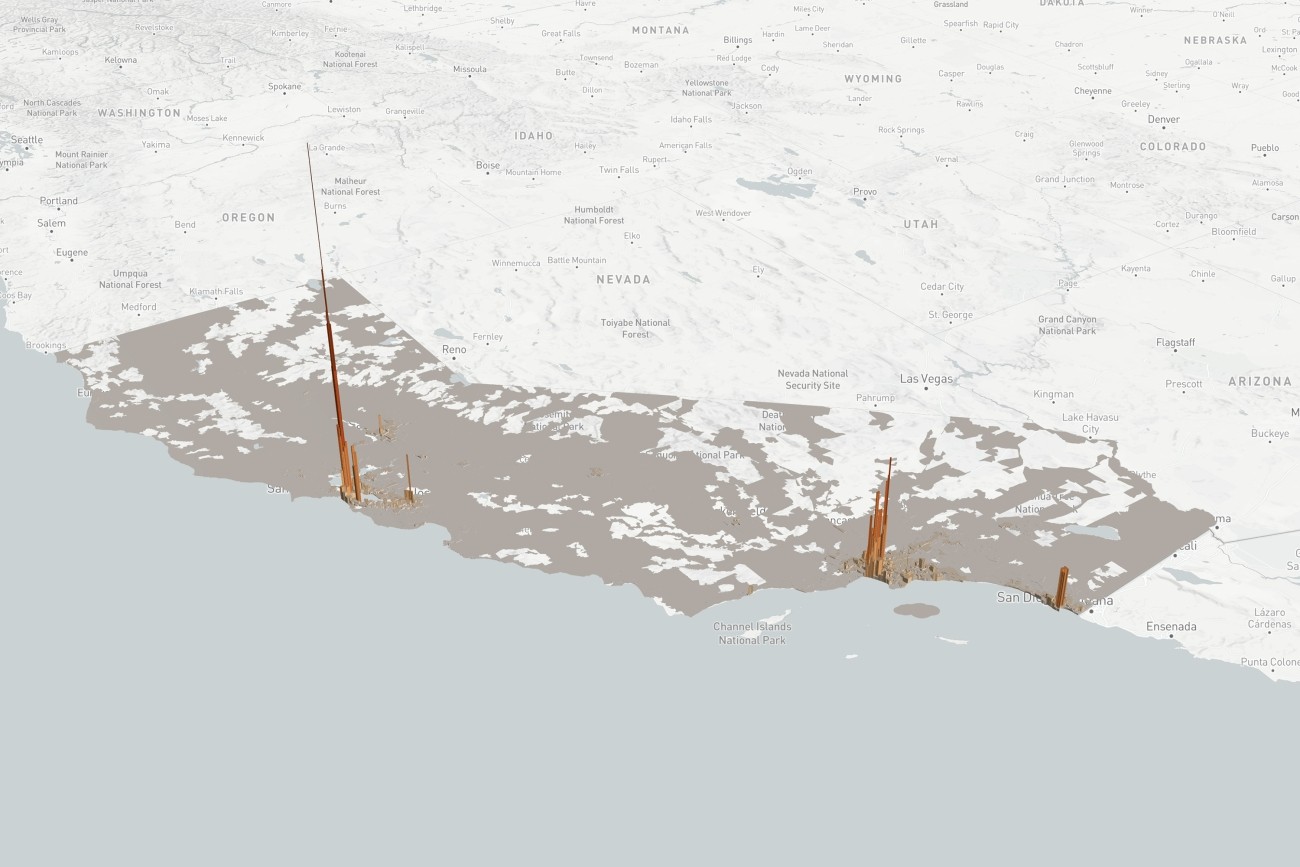
TNCs 2020: A Profile of Ride-Hailing in California is the first comprehensive study of ride-hailing activity statewide, based on an analysis of annual reports filed by Uber and Lyft to the California Public Utilities Commission.
Image
Pedestrians and ride-hail vehicles

TNCs and Congestion

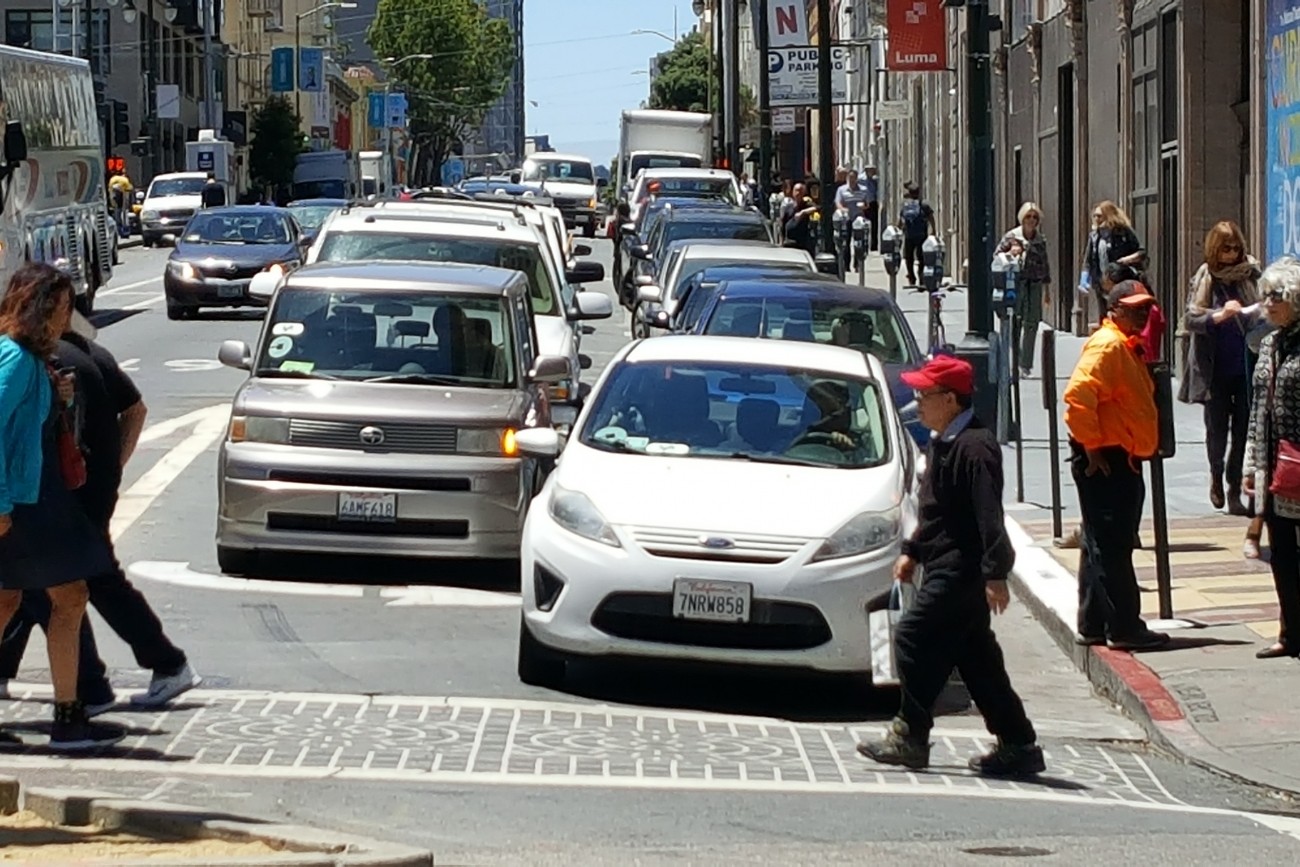
This report provides the first comprehensive analysis of how Transportation Network Companies Uber and Lyft collectively have affected roadway congestion in San Francisco.
Image
An uber vehicle

TNCs Today (2017)

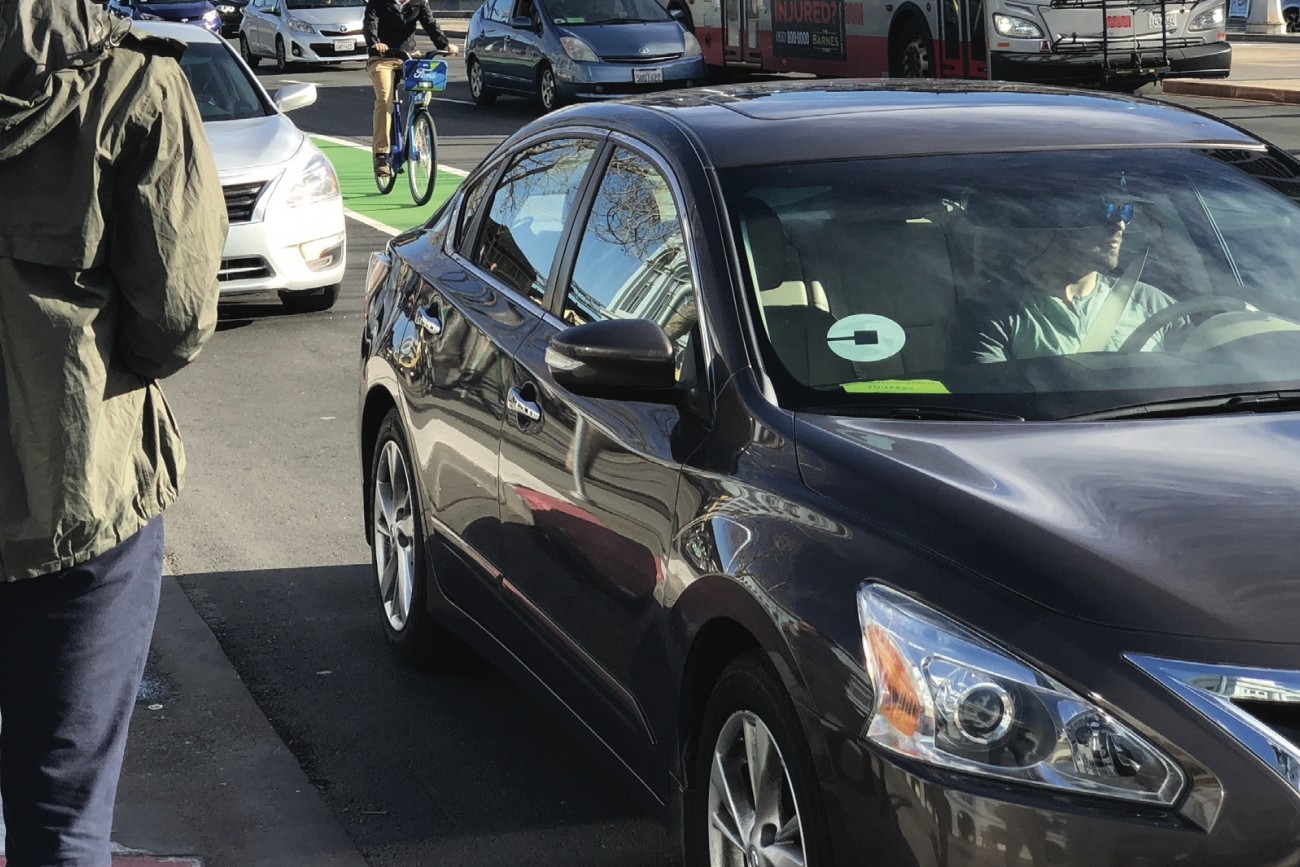
This report provides the first comprehensive estimates of Uber and Lyft activity in the city.
Image
TNC vehicle on Market Street with transit and a bicyclist

The TNC Regulatory Landscape

This report provides an overview of existing state and local regulatory frameworks focusing on ride-hail companies, also known as TNCs.
Image
People standing on a sidewalk with phones and a ride-hail vehicle dropping someone off

Emerging Mobility Evaluation Report

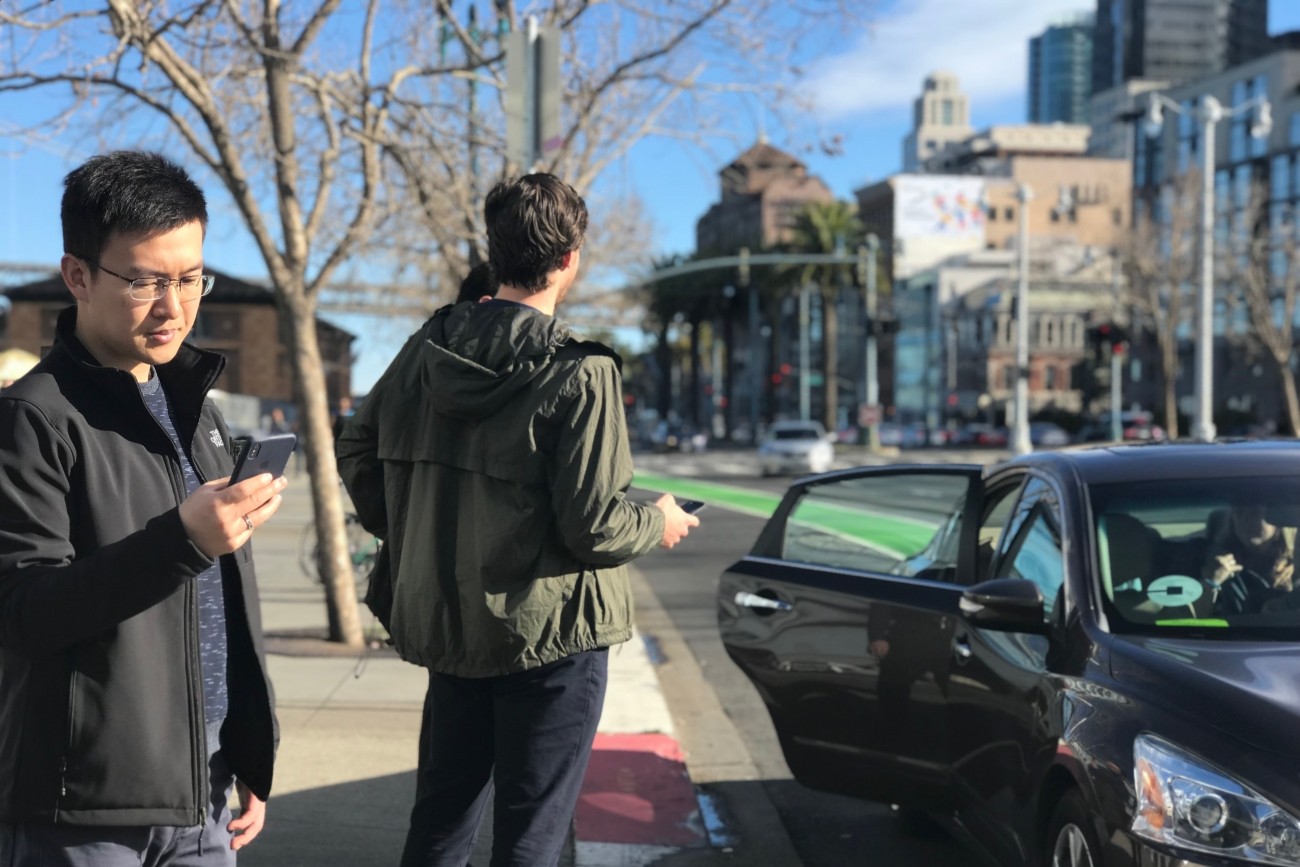
This report provides the first comprehensive look at the rapidly evolving emerging mobility sector in San Francisco.
[site.name]

Social media links

  • Follow us on Facebook Follow us on Facebook
  • Follow us on Instagram Follow us on Instagram
  • Follow us on LinkedIn Follow us on LinkedIn
  • Follow us on Twitter Follow us on Twitter
  • Follow us on YouTube Follow us on YouTube

Stay Connected

Sign up for our monthly email newsletter The Messenger, and get project-specific updates.

Sign Up

Contact

info@sfcta.org
415-522-4800

1455 Market Street, 22nd Floor
San Francisco, CA 94103
United States

View our privacy policy, sweepstakes rules, and terms and conditions.

carrot-left carrot-down arrow-right close menu download carrot-right search logo facebook twitter linkedin youtube instagram carrot-left pdf video zip