Overview
Introduction
The San Francisco County Transportation Authority has released “TNCs 2020: A Profile of Ride-Hailing in California,” the first comprehensive study of ride-hailing activity statewide, based on an analysis of annual reports filed by Uber and Lyft to the California Public Utilities Commission.
The TNCs 2020 report presents findings on a range of topic areas: Reporting Compliance and Integrity, General Characteristics, Public Safety, Labor, Environment, and Accessibility. The study focuses on Annual Reports from 2020, the first year the reports became available.
Key Findings
- Inconsistent and incomplete data reporting means Annual Reports filed by Uber and Lyft do not provide a clear accounting of ride-hailing activity and impacts. This means it is not possible to determine even basic facts such as the number of trips that occured.
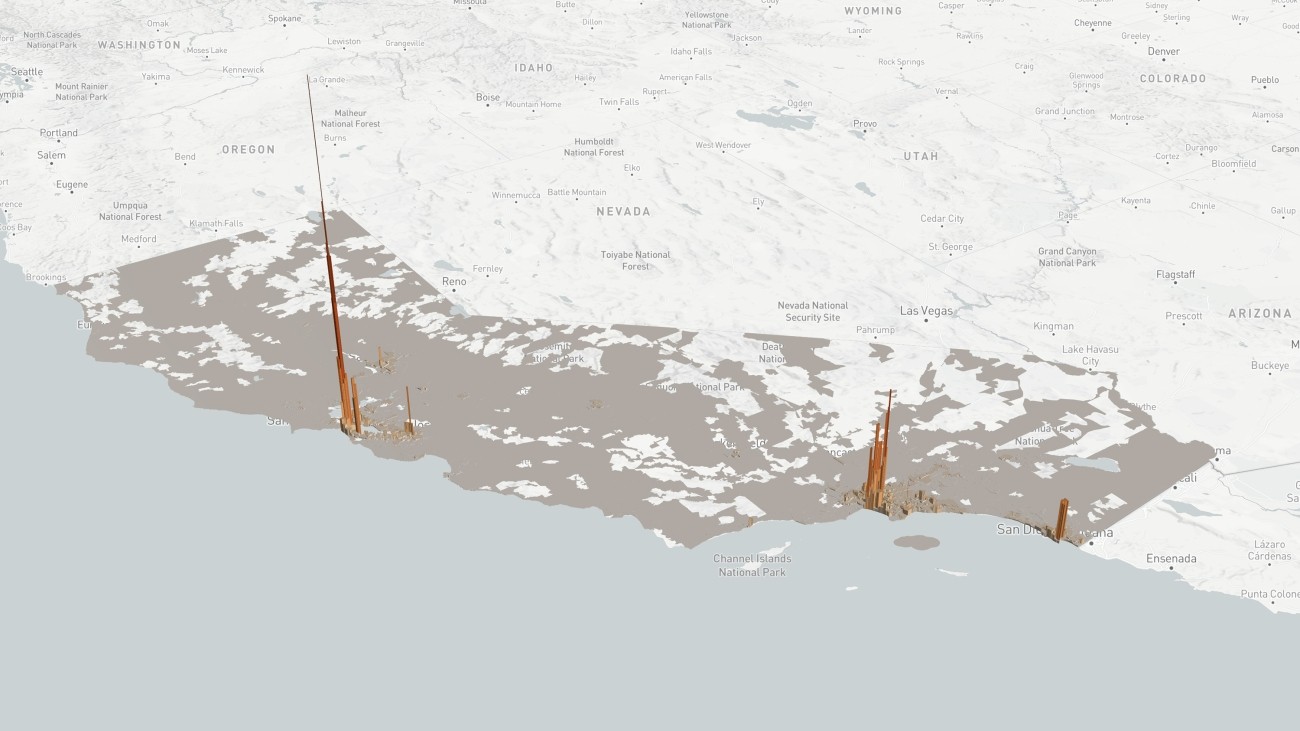
- Uber and Lyft trips are highly concentrated in the urban areas of San Francisco, Los Angeles and San Diego counties, and San Francisco has 500 times more trips per square mile than the rest of the state.
- Lyft reports three times more total public safety incidents per trip than Uber, and 30 times more assaults and harassments per trip. But the rates suggest the companies may be reporting public safety incidents differently, pointing to the need for increased review by regulators.
- Uber and Lyft drivers may violate legal drive-time limits, with 1.3 million driver-days exceeding California’s 10-hour drive time for drivers providing passenger transportation. Due to limitations in the Annual Report data requirements, this report cannot confirm that such drive-time violations have occurred.
- Lyft’s incomplete reports prevent environmental oversight. Uber produced an estimated 494,000 metric tons of CO2 in 2020.
- Half of wheelchair-accessible trip requests statewide go unfulfilled, and Uber provides 16 times as many wheelchair-accessible trips as Lyft.
Resources
Download report and appendices (PDF)
Download Board presentation (PDF)
Contact
Drew Cooper, Acting Co-Deputy Director for Data and Forecasting
Public engagement
April 25, 2023 Transportation Authority Board
Board presentation (PDF)
Related programs
Image
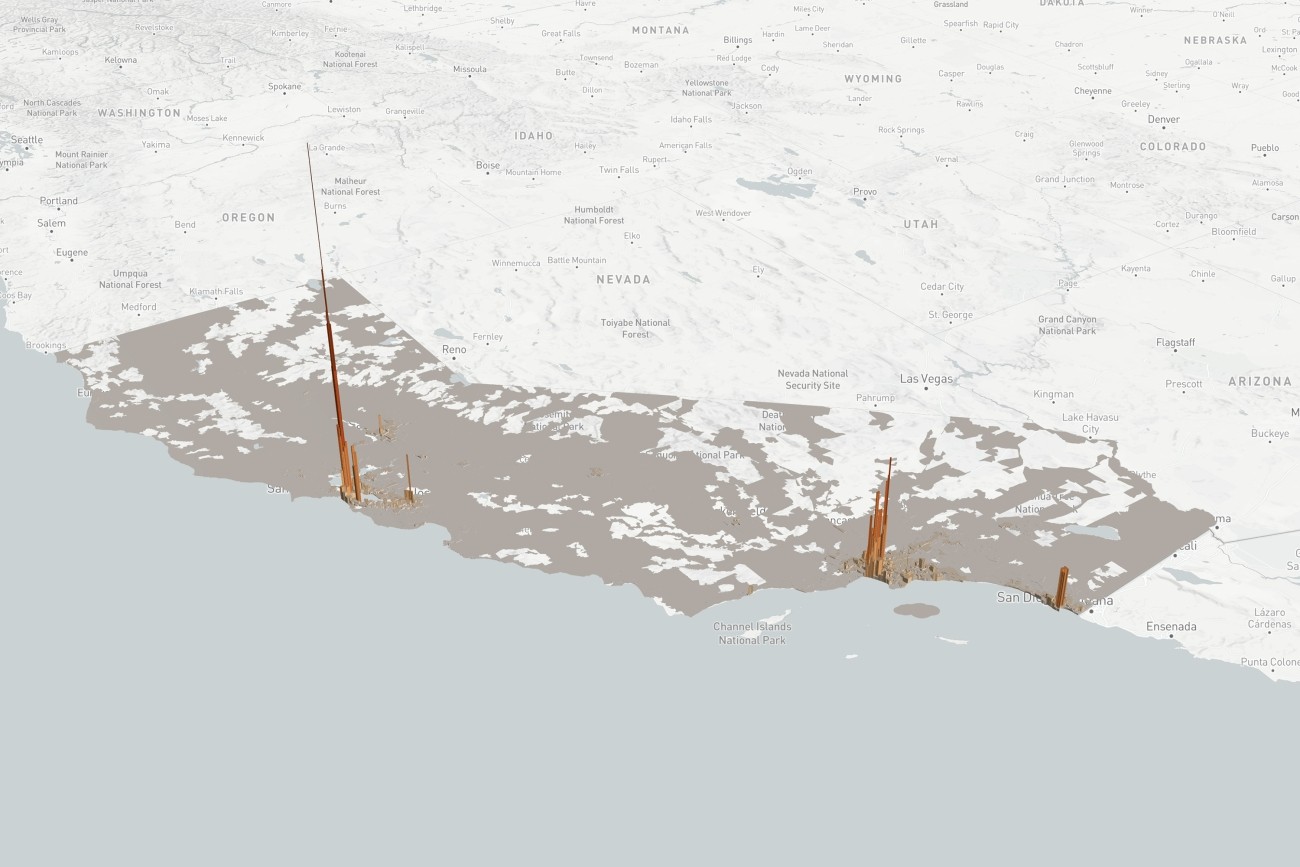
TNCs 2020: A Profile of Ride-Hailing in California is the first comprehensive study of ride-hailing activity statewide, based on an analysis of annual reports filed by Uber and Lyft to the California Public Utilities Commission.
Image

This report provides an overview of existing state and local regulatory frameworks focusing on ride-hail companies, also known as TNCs.
Image
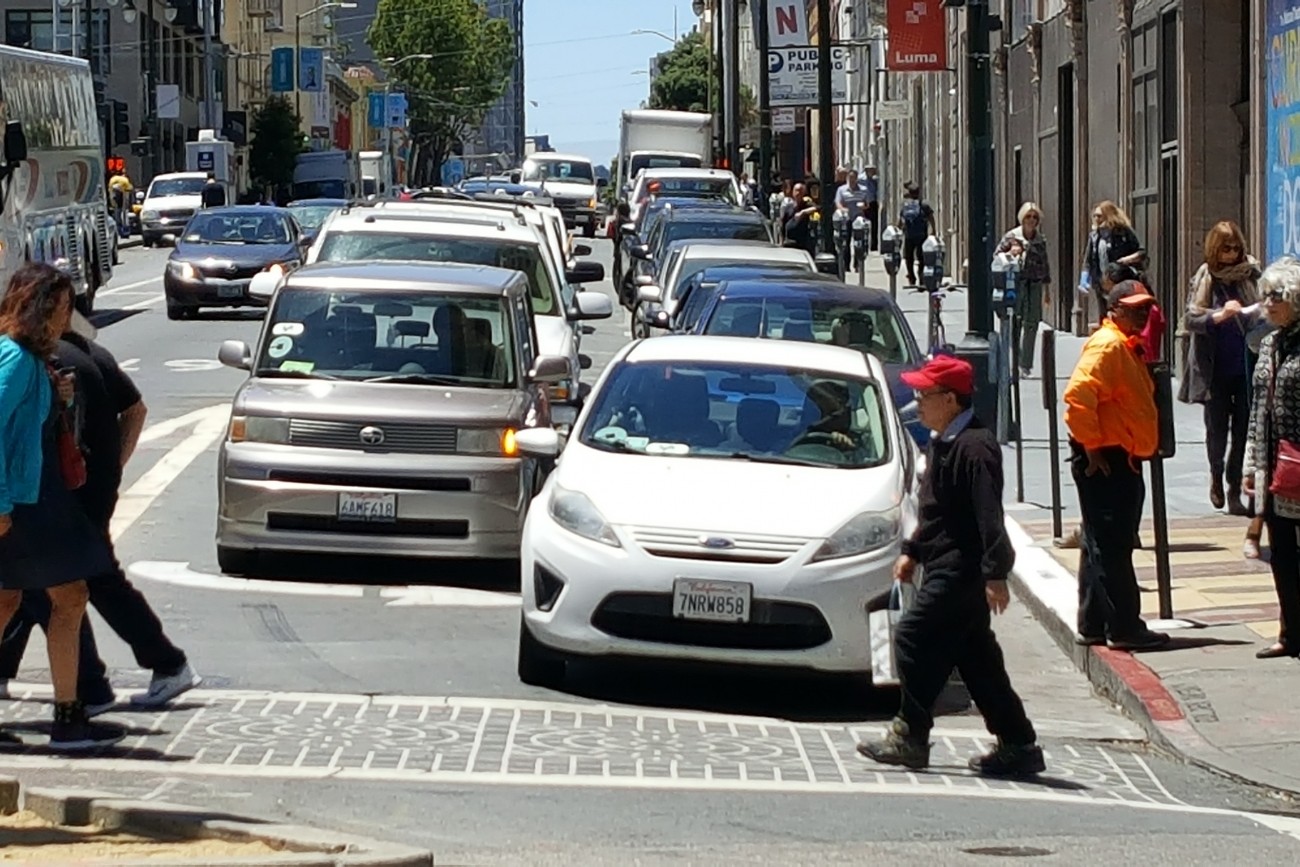
This report provides the first comprehensive analysis of how Transportation Network Companies Uber and Lyft collectively have affected roadway congestion in San Francisco.
Image
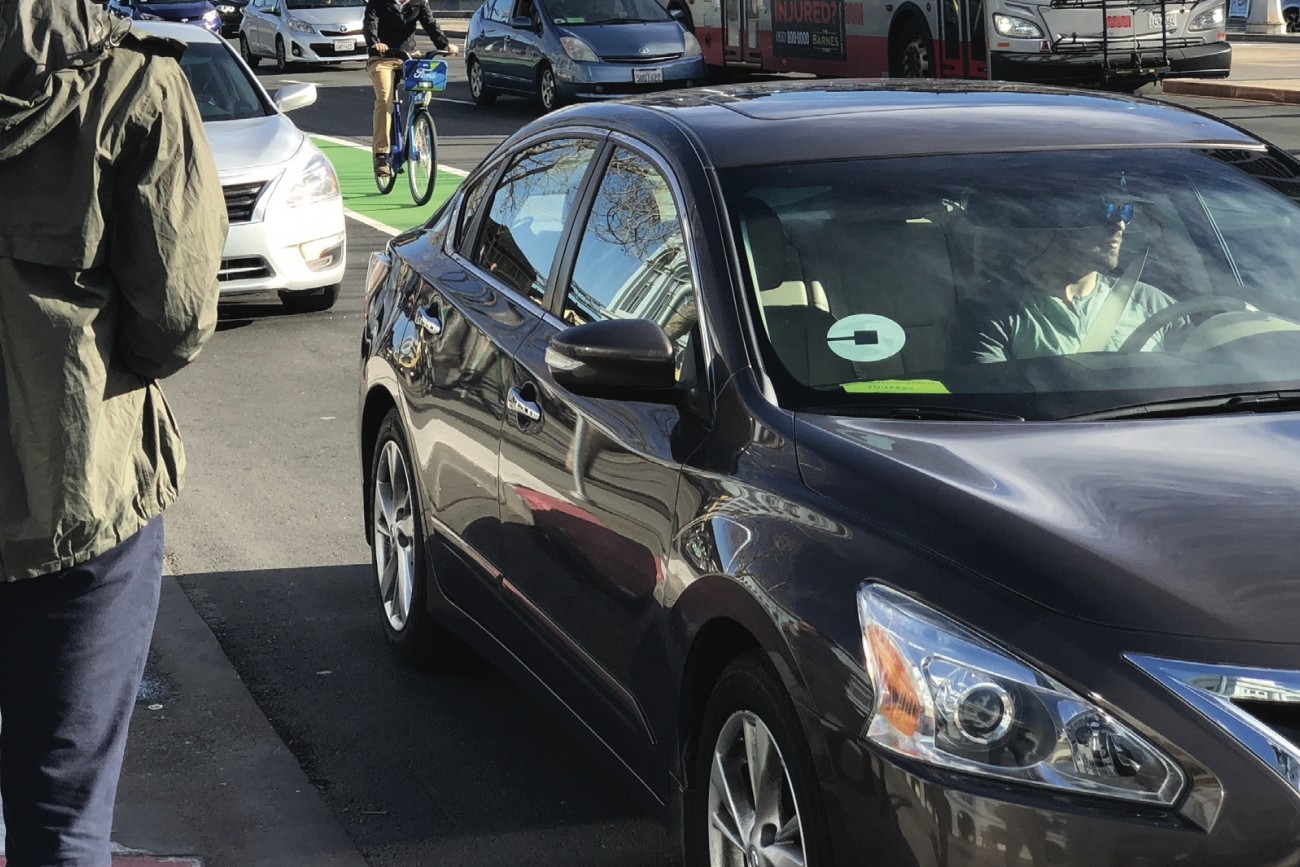
This report provides the first comprehensive estimates of Uber and Lyft activity in the city.