Photo by SFMTA Photography Department
Congestion Management Update
The Transportation Authority has released the latest data on congestion in San Francisco. As San Francisco’s Congestion Management Agency, we monitor transit performance and traffic congestion on San Francisco streets and issue a report on the latest data every two years.
Key findings
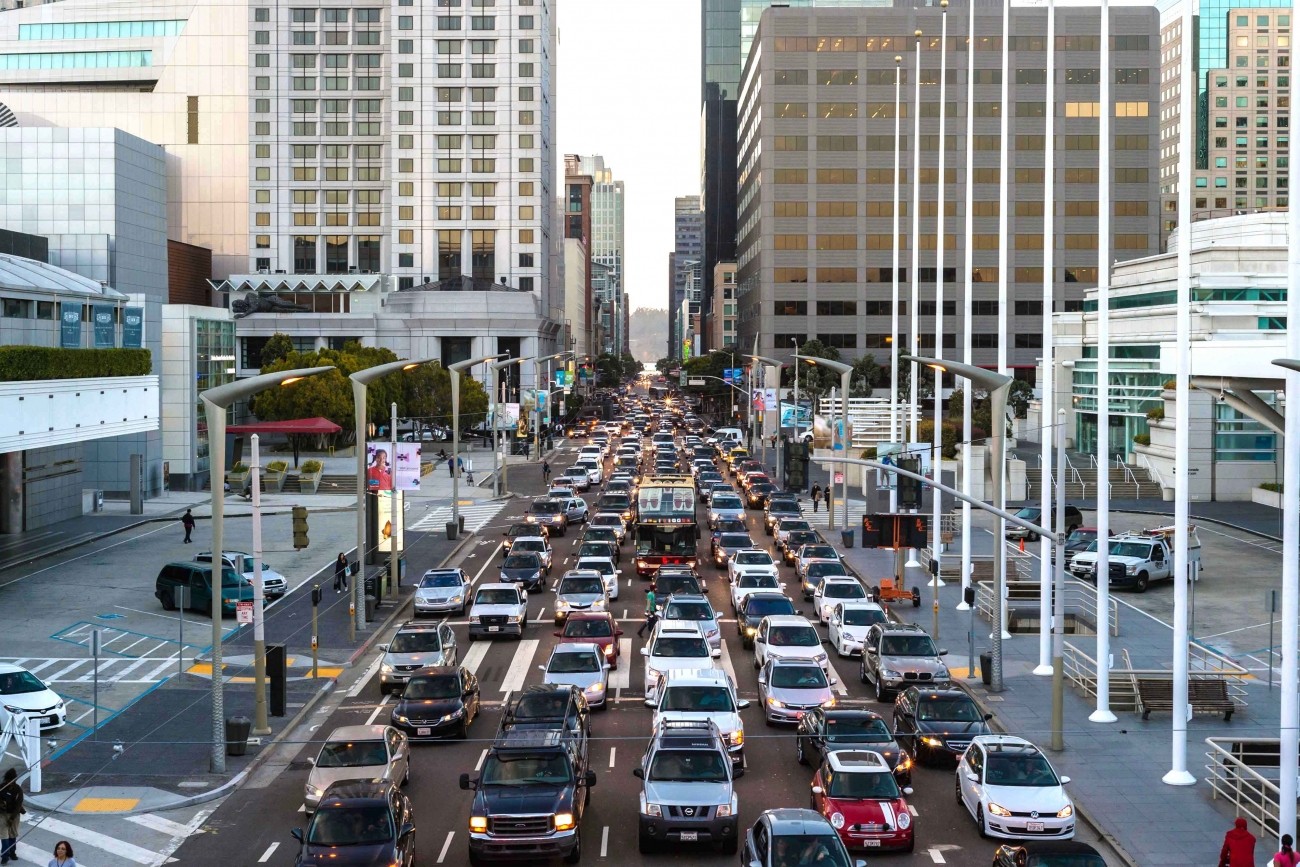
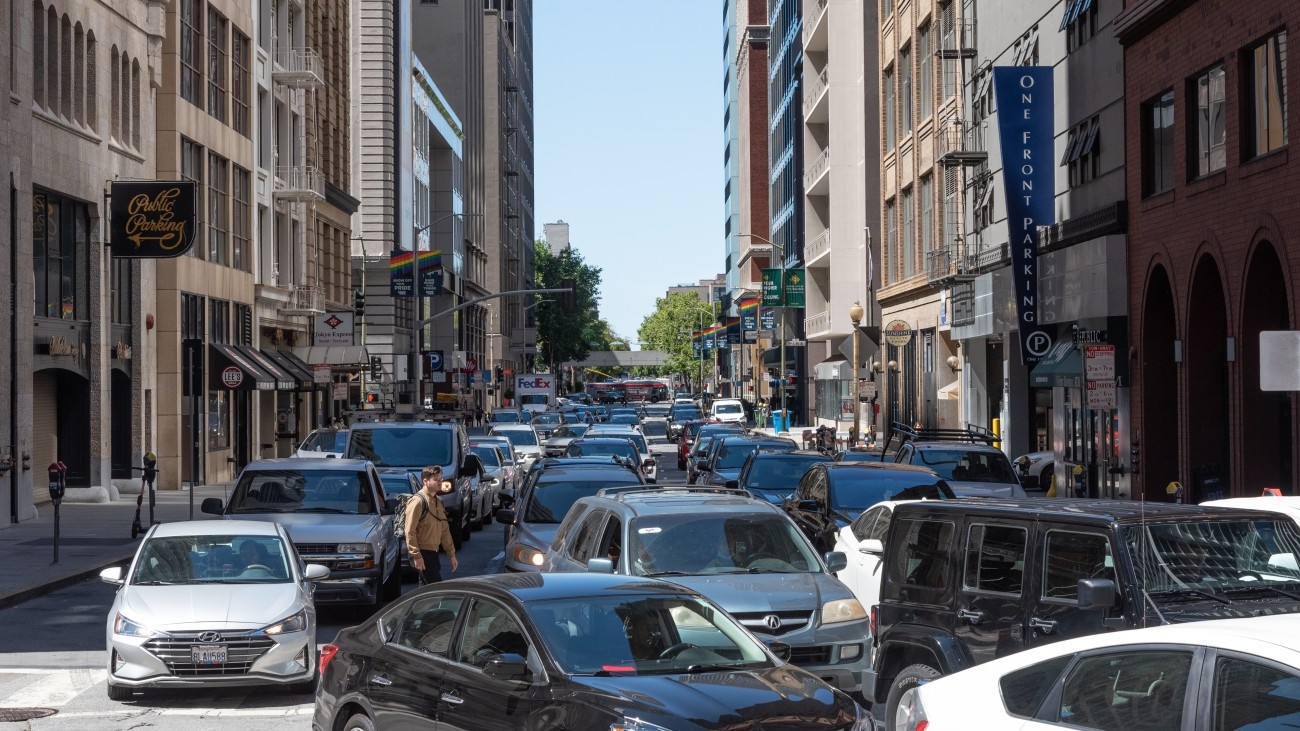
The 2021 CMP update shows recent travel trends have been disrupted due to the profound effect the pandemic had on people's health, livelihoods, activities, and the economy. Roadway and transit speeds improved for the first time in a decade. However, as the city recovers, congestion has been returning to streets and freeways, in some cases to nearly pre-pandemic levels.
Here is a snapshot of the most significant trends as of spring 2021:
Automobile speeds: Increased on average between 33% and 36% on streets, and increased between 42% to 46% on freeways. This reverses a trend of declining street and freeway speeds during the past decade.
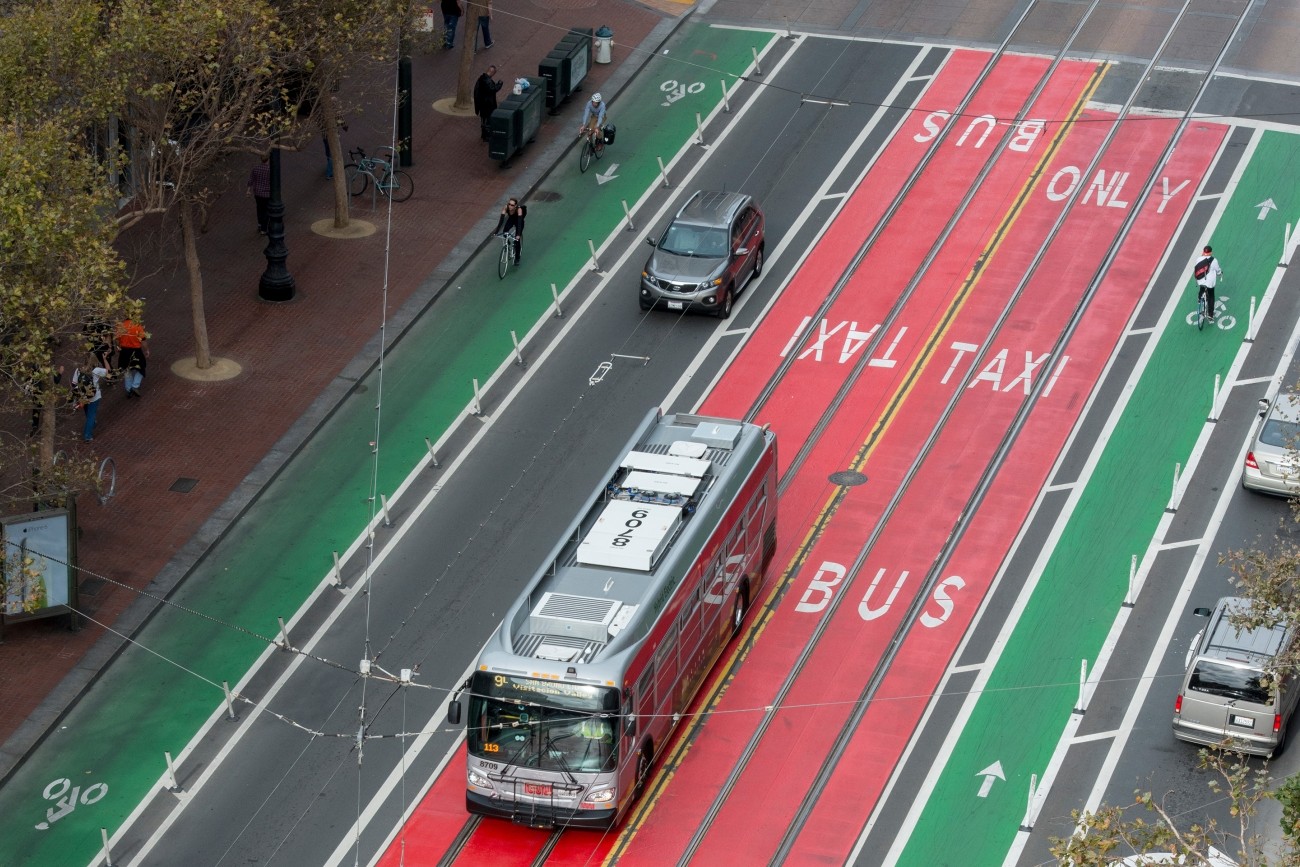
Transit speeds: Increased between 15% and 24%, compared to the last monitoring cycle in 2019. This continues a trend of improvements in transit speeds that was observed between 2017 and 2019 which may be attributable both to the reduction in traffic volumes and implementation of transit priority measures citywide.
Transit ridership: Declined as much as 90% amid the effects of the pandemic as transit service was reduced and riders curtailed trip-making in general or opted for private vehicles over public transportation.
Automobile to Transit Speed Ratio: Transit became slightly less competitive with driving, registering ratios of up to 1.82 in 2021, meaning that travel by auto is almost twice as fast as travel by transit. This ratio is calculated by comparing private vehicle speeds to transit speeds on city streets.
Automobile reliability: Increased 15% on streets and 5% on freeways, according to a new metric called the Buffer Time Index. The Buffer Time Index is a reliability measure calculated as the amount of additional travel time that travelers need to budget so that they have a 95% chance of arriving to their destination on time.
Bicycle and pedestrian injuries and fatalities: Declined in 2020, the most recent year for which numbers are available. Pedestrian and bicycle injury collisions dropped a collective 33% and fatalities dropped a collective 20%. However, non-motorized trips declined even more significantly, with pedestrian volumes declining about 70%, and bicycle volumes dropping up to 50%. This troubling trend suggests that the rate of pedestrian and bicycle collisions may have increased during the pandemic, potentially due to faster vehicle speeds, as reported above.
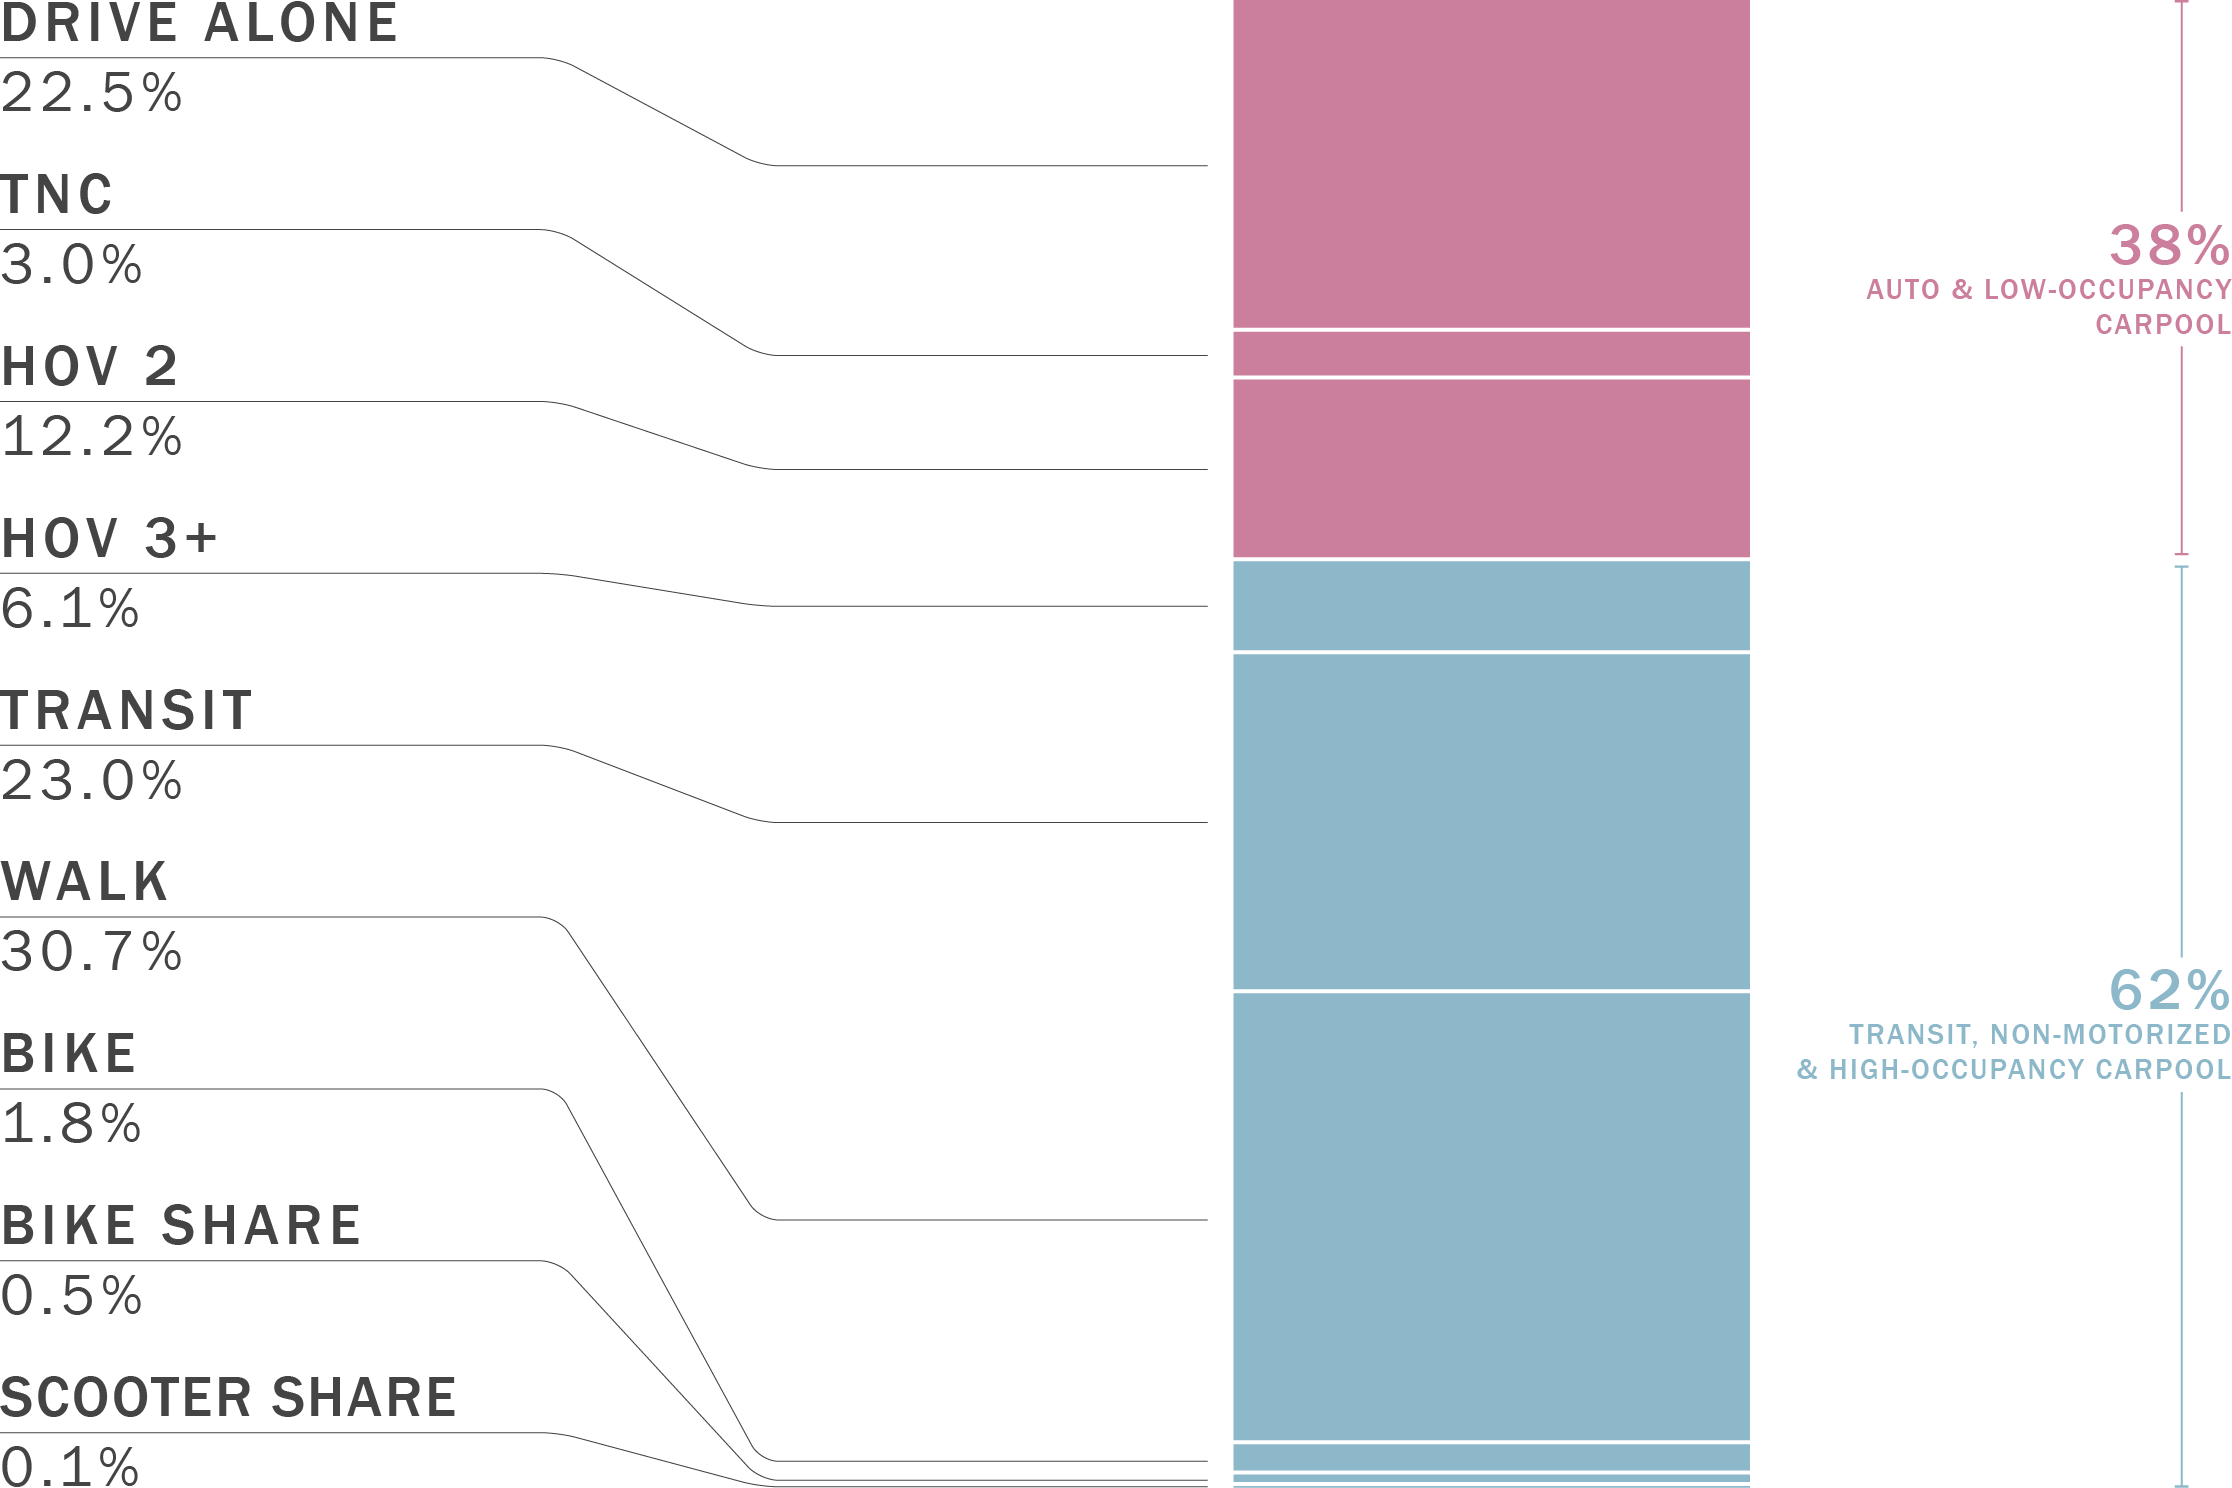
Mode share (pre-Covid): The below graph shows the mode split in San Francisco for all daily trips to, from and within the city. More than 60% of trips involve low carbon methods of travel, including walking, transit, biking, and high-occupancy carpooling. San Francisco has set a goal of 80% low-carbon trips by 2030. (Data collected November 2018 and May 2019.)
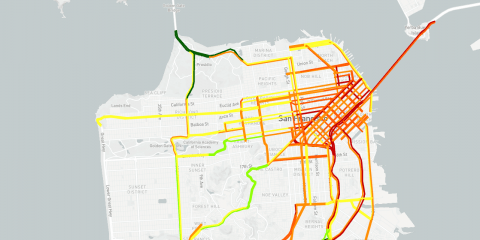
Explore traffic congestion in our interactive map:
Strategies to Manage Congestion
San Francisco is taking concrete steps to address congestion, including:
- Managing demand for travel through land use planning, transit, bicycle and pedestrian facilities investment and demand management (such as parking management, bus priority and educational campaigns).
- Planning projects like ConnectSF, which is a multi-agency collaborative process to build an effective, equitable, and sustainable transportation system for San Francisco’s future. Through this work the SFMTA has recently released the city’s Transit Strategy and the Transportation Authority is leading the Streets and Freeways Strategy. Other significant planning efforts include the Transportation Authority’s Neighborhood Program, Vision Zero Program, and U.S. 101/I-280 Managed Lanes and Express Bus Study.
- Funding and building major capital projects such as the Central Subway, Downtown Rail Extension to Salesforce Transit Center, Caltrain Peninsula Corridor Electrification Project and the purchase of new Muni vehicles.
Additional Information
We joined a SPUR panel to discuss how the pandemic has reshaped our commutes, new scenarios for transit transformation and potential next steps for the Bay Area as the region reopens. See a video of the November 17, 2021 presentation.
Resources
Presentation to Transportation Authority Citizens Advisory Committee (PDF)
Final Report: Congestion Management Program 2021 (PDF) and Executive Summary (PDF)
Related Content